Structured notes · analysis & evaluation
Structured Notes Analysis Tool
Upload a structured note term sheet and get an independent, quantitative view of the payoff before you recommend it. Speval models autocalls, barriers, coupons, and the underlying in one report.
No login required · Independent, issuer-neutral analysis
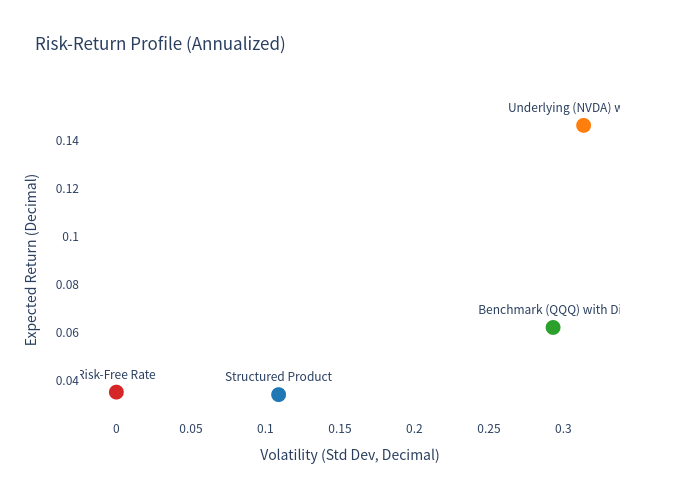
Chart from a real Speval analysis report.
Example structured note analysis
3.44%
Expected annualized return
Product
8.66%
Probability of loss
vs. 23.69% for NVDA
72.12%
Autocall probability
Early redemption
6.2 mo
Expected holding period
Not 12 months
A structured note is a bond with a rulebook attached. The coupon, the protection, and the maturity date all look simple on the term sheet, but the payoff usually depends on a path: whether an index crosses a barrier, whether an autocall triggers, whether the worst name in a basket holds up. A structured notes analysis tool exists to turn that rulebook into a distribution of outcomes you can actually judge.
This page explains what a structured note analysis should show, the five numbers that matter most, and how Speval produces them from a real term sheet.
What structured notes analysis has to answer
Most term sheets answer the wrong question. They tell you the maximum coupon, the protection level, and the participation rate. They rarely tell you:
- How often the note is likely to autocall, and when.
- What happens in the paths where it is not called.
- How much of the coupon is compensation for risk you cannot see.
- How the note compares with simply holding the underlying.
- What the loss looks like in the worst 1% of scenarios.
Those are the questions an analysis tool should answer. Everything else is marketing copy.
The five numbers that matter
| Metric | What it tells you | Why it matters |
|---|---|---|
| Expected return | The probability-weighted return across all simulated paths | The coupon is not the expected return; autocalls and losses change it |
| Probability of loss | Share of paths where total payoff is below the amount invested | Captures the frequency of bad outcomes, including small ones |
| Autocall probability | Share of paths redeemed early, and the timing | A high number shortens the holding period and caps total coupons |
| Expected holding period | Average time capital is actually exposed | Annualized returns are misleading when the note is called early |
| 99% VaR | Loss threshold in the worst 1% of paths | Shows tail risk that averages hide |
A report that gives you only a fair value, or only a coupon, is not enough for a path-dependent product.
Worked example: an NVDA autocallable certificate
Speval's example report for an NVDA-linked autocallable certificate shows how the numbers fit together. The note is a one-year certificate with quarterly observations, a 100% autocall trigger, a 67% knock-in barrier observed at maturity, a 50% coupon barrier, and a maximum coupon of 10% per annum (2.5% per quarter).
The simulation produced:
- 3.44% expected annualized return — well below the 10% maximum coupon.
- 8.66% probability of loss — versus 23.69% for holding NVDA directly.
- 72.12% autocall probability — the note is likely to redeem early.
- 6.2 months expected holding period and 2.04 coupons on average.
The gap between the 10% headline coupon and the 3.44% expected annualized return is the point of the analysis. The note is called early in most paths, so the coupon is earned for a shorter period, and the paths that are not called carry the loss.
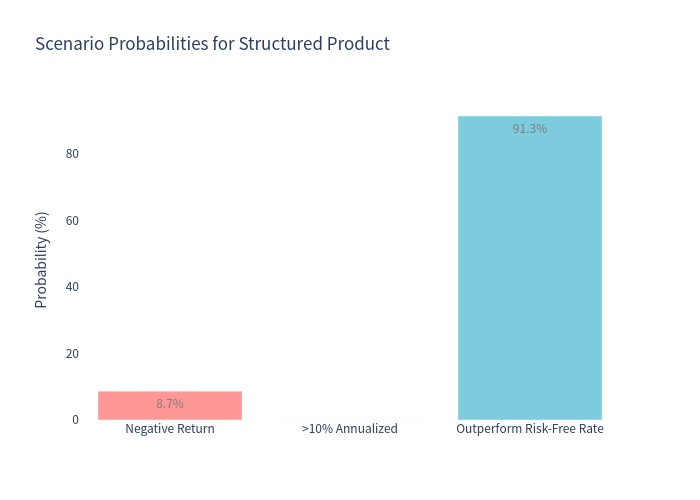
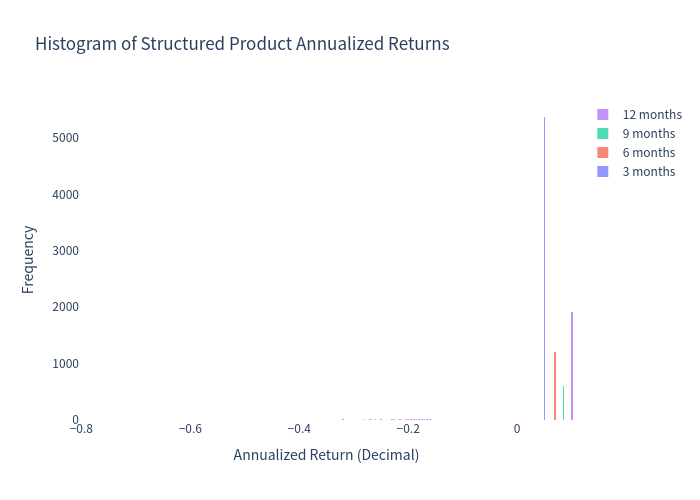
The full report is available in the examples library. The same analysis can be run on any term sheet through the free evaluator.
How Speval analyzes a note
- Extract the terms. The uploaded document is parsed for the underlying, barriers, coupon conditions, observation dates, settlement rules, and currency.
- Model the underlying. A GJR-GARCH(1,1) model with a Student's t distribution is fitted to the underlying's historical returns, and joint paths are generated for baskets.
- Apply the payoff path by path. Each of the 10,000 paths is run through the note's actual rules: coupon tests, autocall triggers, knock-in events, and maturity settlement.
- Report the distribution. The output includes expected return, probability of loss, autocall probability, expected holding period, VaR, and scenario charts.
Nothing in that process uses the issuer's pricing assumptions. The report is built from the term sheet and market data.
Structured note analysis vs. a term sheet summary
A term sheet summary is a description. An analysis is a test. The difference shows up in questions like:
- The term sheet says "10% coupon." The analysis says the expected annualized return is 3.44% because the note is usually called early.
- The term sheet says "67% knock-in protection." The analysis says the loss probability is 8.66% and the 99% VaR is -45.08%, because the tail is driven by the paths where the barrier is hit.
- The term sheet says "1-year maturity." The analysis says the expected holding period is 6.2 months.
If a summary cannot produce those three pairs of numbers, it is not an analysis.
Who this is for
- Financial advisors who need a defensible, independent view before recommending a note.
- Wealth managers comparing several notes for the same client.
- Private bankers who need to explain path dependency and tail risk.
- Family offices reviewing a proposed allocation.
- Compliance and product teams documenting suitability.
The tool is deliberately issuer-neutral. It does not score a note as "good" or "bad"; it shows what the note does across scenarios.
Common mistakes in structured note analysis
- Reading the coupon as the return. The maximum coupon assumes the note survives and pays every coupon. Autocalls and losses change the realized return.
- Ignoring the observation style. A continuous barrier is triggered more often than a closing-price barrier, even for the same level.
- Treating protection as free. Protection is funded by lower participation, a cap, no income, or a longer term.
- Comparing notes with different underlyings on coupon alone. A 10% coupon on a volatile single stock is not the same risk as a 10% coupon on a diversified index.
- Ignoring the issuer. A structured note is an unsecured obligation. Credit risk is not in the Monte Carlo unless you add it.
Related analysis
- ELN analysis tool for equity-linked notes.
- Autocallable notes analysis tool for autocall and Phoenix structures.
- Reverse convertible analysis tool for barrier reverse convertibles.
- Structured product calculator for quick coupon and barrier math.
Figures in this article come from a Speval example report and are simulated, not investment advice. Past performance and historical calibrations do not guarantee future results.
Example structured note analysis
NVDA Autocallable Certificate (SGD quanto)
This is a full report generated by Speval from a real term sheet. The same analysis is available for your product — upload the document and get the report in minutes.
Frequently asked questions
What is a structured notes analysis tool?
A structured notes analysis tool reads a note's term sheet, models its path-dependent payoff, and reports the risk and return outcomes an investor actually faces. Speval does this with Monte Carlo simulation rather than a single deterministic price.
What should a structured note analysis show?
At minimum: expected return, probability of loss, autocall probability, barrier breach probability, expected holding period, and a distribution of outcomes. A single fair value or coupon figure hides the path dependency.
How does Speval analyze a structured note?
Speval extracts the terms from the uploaded document, fits a GJR-GARCH(1,1) model with a Student's t distribution to the underlying's history, simulates 10,000 price paths, and applies the note's actual payoff rules on every path.
Can I analyze a structured note without an account?
Yes. The free evaluation lets you upload a term sheet and receive a report link by email. No login is required to try the analyzer.
Is the analysis independent of the issuer?
Yes. Speval does not use issuer pricing assumptions or sales materials. The model is built from the term sheet, market data, and stated simulation methodology.
What structured note types are supported?
Autocallables, Phoenix and memory structures, equity-linked notes, reverse convertibles, barrier reverse convertibles, principal-protected notes, buffered notes, worst-of baskets, bonus certificates, and market-linked notes.
Related analysis tools
Further reading
Run this analysis on your own term sheet
Upload a PDF, Excel, or Word term sheet. Speval extracts the terms, runs 10,000 Monte Carlo paths, and returns autocall probability, probability of loss, expected return, and scenario charts.