
Headline Simulation Results
Based on 10,000 Monte Carlo simulations using a GJR‑GARCH(1,1) model with Student’s t‑distribution:
| Metric | Structured Product | Underlying (NVDA) with Dividends | Benchmark (QQQ) with Dividends |
|---|---|---|---|
| Expected Annualized Return | 3.44% | 14.64% | 6.23% |
| Annualized Volatility | 10.89% | 31.36% | 29.31% |
| Probability of Loss | 8.66% | 23.69% | 42.12% |
| 99% Confidence VaR (1‑year) | -45.08% | -53.34% | -55.57% |
Additional Product‑Specific Metrics
- Expected total return over the realized holding period: 1.77%
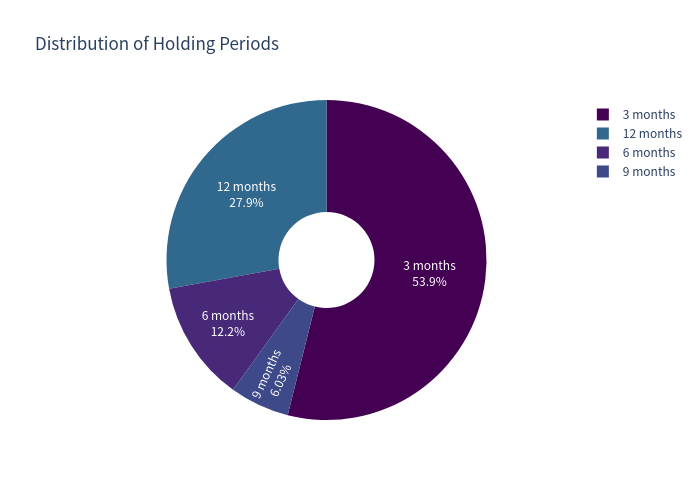
- Expected holding period: 6.2 months
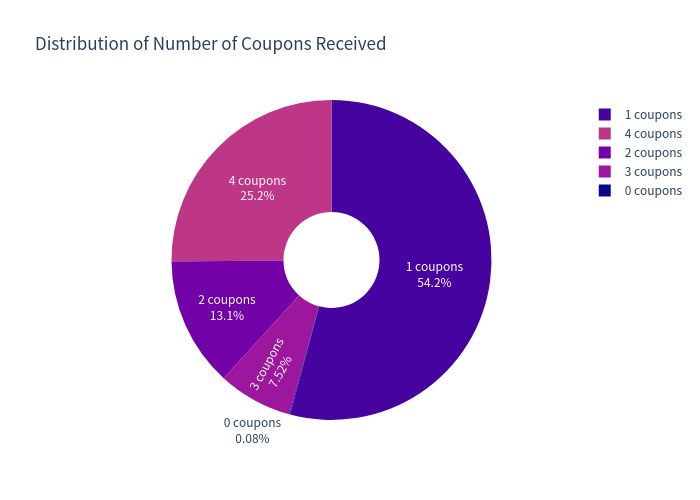
- Expected number of coupons received: 2.04
- Probability of early redemption (autocall): 72.12%
Product Overview
How It Works (Layman Explanation)
This is an autocallable certificate linked to the stock of Nvidia Corporation (NVDA).
The product has a 1‑year maturity with quarterly observation dates.
- On each observation date, if the NVDA stock price is at or above its initial level (100%), the product is automatically redeemed early – investors receive their principal back plus any coupon due on that date.
- If the product is not called early, at maturity investors receive:
- 100% of principal if the stock price on the final observation date is at or above 67% of its initial level.
- A reduced amount (proportional to the stock’s decline) if the stock price on the final observation date is below 67% of its initial level (a “knock‑in” event). The reduction is calculated as (Final Price / Strike Price) × principal, with a maximum loss of 100%.
- Coupons of 2.5% of the notional are paid quarterly, provided the stock price is above 50% of its initial level on the observation date.
Key Features
- Underlying: Nvidia Corporation (NVDA)
- Currency: Notional in SGD, underlying in USD (quanto)
- Autocall barrier: 100% of initial price
- Knock‑in barrier: 67% of initial price (observed only on the final valuation date)
- Distribution (coupon) barrier: 50% of initial price
- Maximum coupon: 10% per annum (4 × 2.5%)
- Cap on upside: 100% of principal (no upside participation)
Simulation Methodology
- Price paths were simulated using a GJR‑GARCH(1,1) model with Student’s t‑distribution fitted to 20 years of historical daily returns.
- Drift = risk‑free rate (US 1‑year Treasury yield 3.54%) + equity risk premium (6.00%).
- Dividend yields have been added to the underlying and benchmark returns (NVDA: 2.00%, QQQ: 0.46%).
- All payoffs are calculated month‑by‑month according to the product’s term sheet.
- 10,000 simulations were run to capture a wide range of market scenarios.
Charts & Visual Analysis
1. Structured Product vs Underlying Return
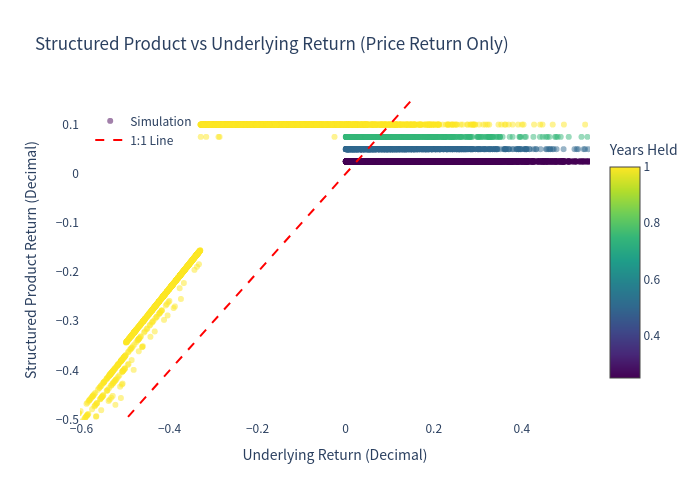
Each point represents one simulation. The red dashed line is the 1:1 line – points above it indicate the product outperforming the underlying, points below indicate underperformance. Color shows the number of years the product was held.
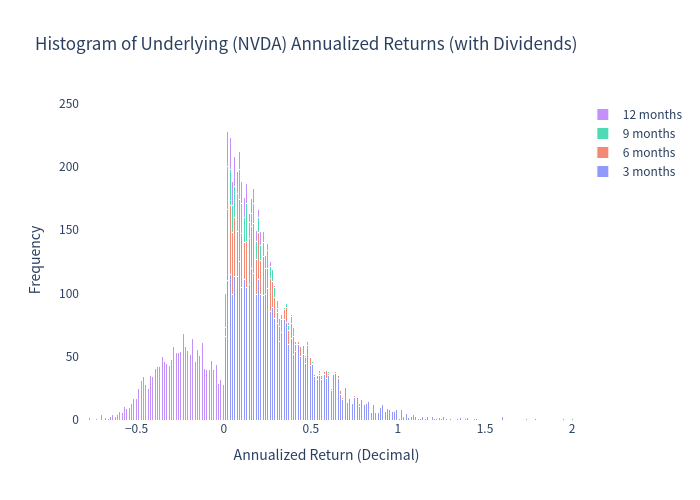
2. Distribution of Annualized Returns
Underlying (NVDA) with Dividends
Structured Product
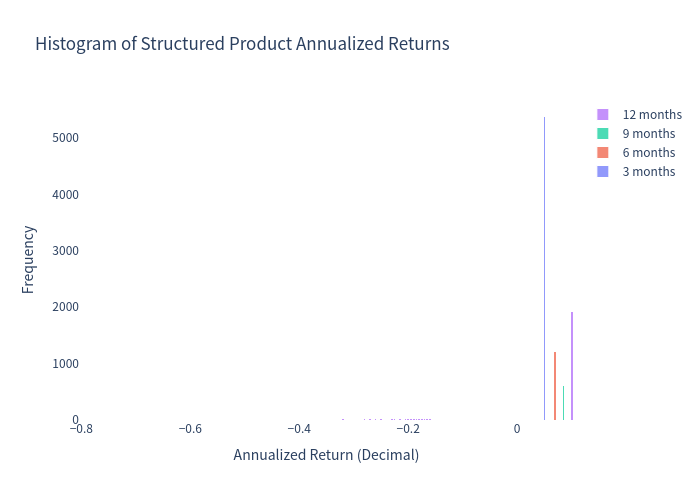
Both histograms use 1% bins and are stacked by the holding period (3, 6, 9 or 12 months).
3. Scenario Probabilities
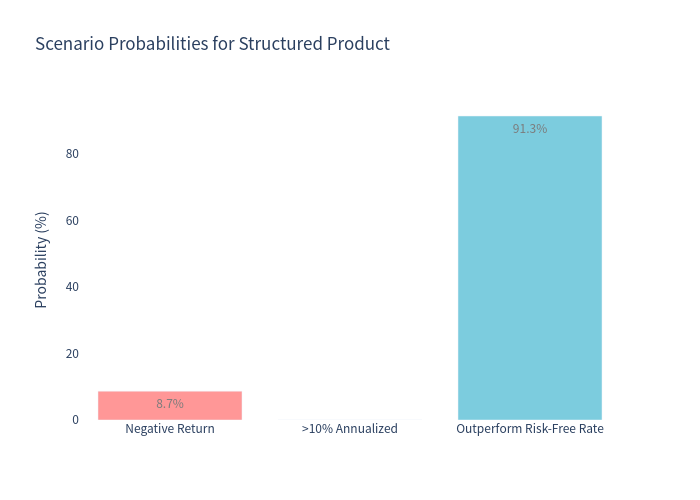
Probability of a negative return, a >10% annualized return, and outperforming the risk‑free rate.
4. Risk‑Return Profile
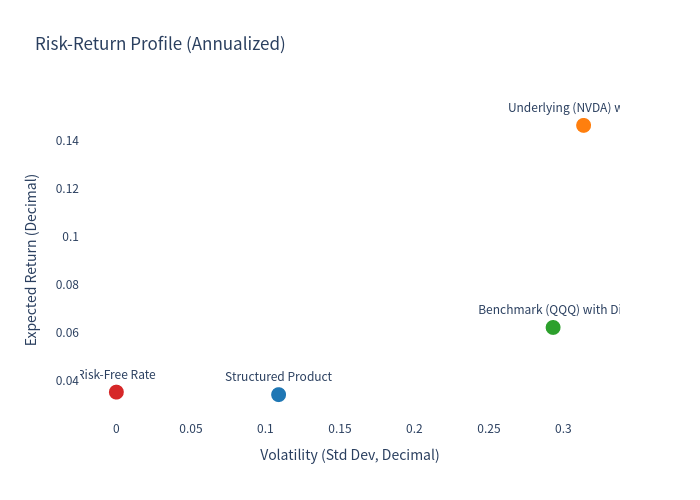
Expected annualized return vs. volatility for the structured product, the underlying (with dividends), the benchmark (with dividends), and the risk‑free rate.
5. Box‑Plot Comparison
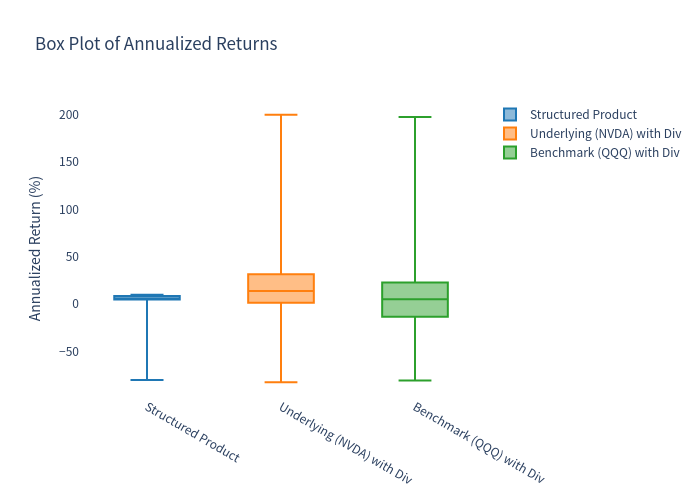
Distribution of annualized returns for the structured product, the underlying (with dividends), and the benchmark (with dividends).
6. Holding Period & Coupon Distribution
Holding Periods
Number of Coupons Received
Investment Commentary
Potential Advantages
- Lower probability of loss (8.66% vs. 23.69% for the underlying) due to the knock‑in protection and autocall feature.
- Lower volatility (10.89% vs. 31.36% for the underlying) – the product’s returns are more stable.
- Regular coupon income (up to 10% per annum) as long as the stock stays above 50% of its initial level.
- Early redemption possibility – approximately 72% of simulations resulted in early redemption, returning principal after 3, 6, or 9 months.
Potential Drawbacks
- Capped upside – the maximum return is limited to the coupons received; no participation in stock appreciation beyond the initial level.
- Downside exposure if a knock‑in occurs on the final observation date and the stock finishes below the strike price (90% of initial), investors can suffer losses proportional to the stock’s decline.
- Complexity – the product’s payoff depends on multiple barriers and observation dates, making it difficult to intuitively assess its value.
Important Considerations
- The product is SGD‑denominated but linked to a USD stock, introducing implicit currency risk (not modelled in this analysis).
- The expected annualized return of 3.44% is below the underlying’s expected return (14.64%) but also carries significantly lower risk.
- Because the product often redeems early, the effective holding period is shorter than the full 12 months (average 6.2 months). Annualized figures for early‑redemption scenarios are computed using a scaling formula and can appear more extreme than total‑return figures.
Limitations & Assumptions
- Dividends are added as a simple linear accrual; compounding and reinvestment are not considered.
- FX effects between SGD and USD are ignored.
- Transaction costs, fees, and taxes are not included.
- The risk‑free rate is assumed constant at the current US 1‑year Treasury yield.
- Market stress scenarios may not be fully captured by the historical GARCH model.