Equity linked notes · ELN analysis
ELN Analysis Tool
An ELN analysis has to answer one question: what does the equity linkage actually cost you, and what do you get paid for it? Speval turns the term sheet into a distribution of outcomes instead of a brochure headline.
No login required · Independent, issuer-neutral analysis
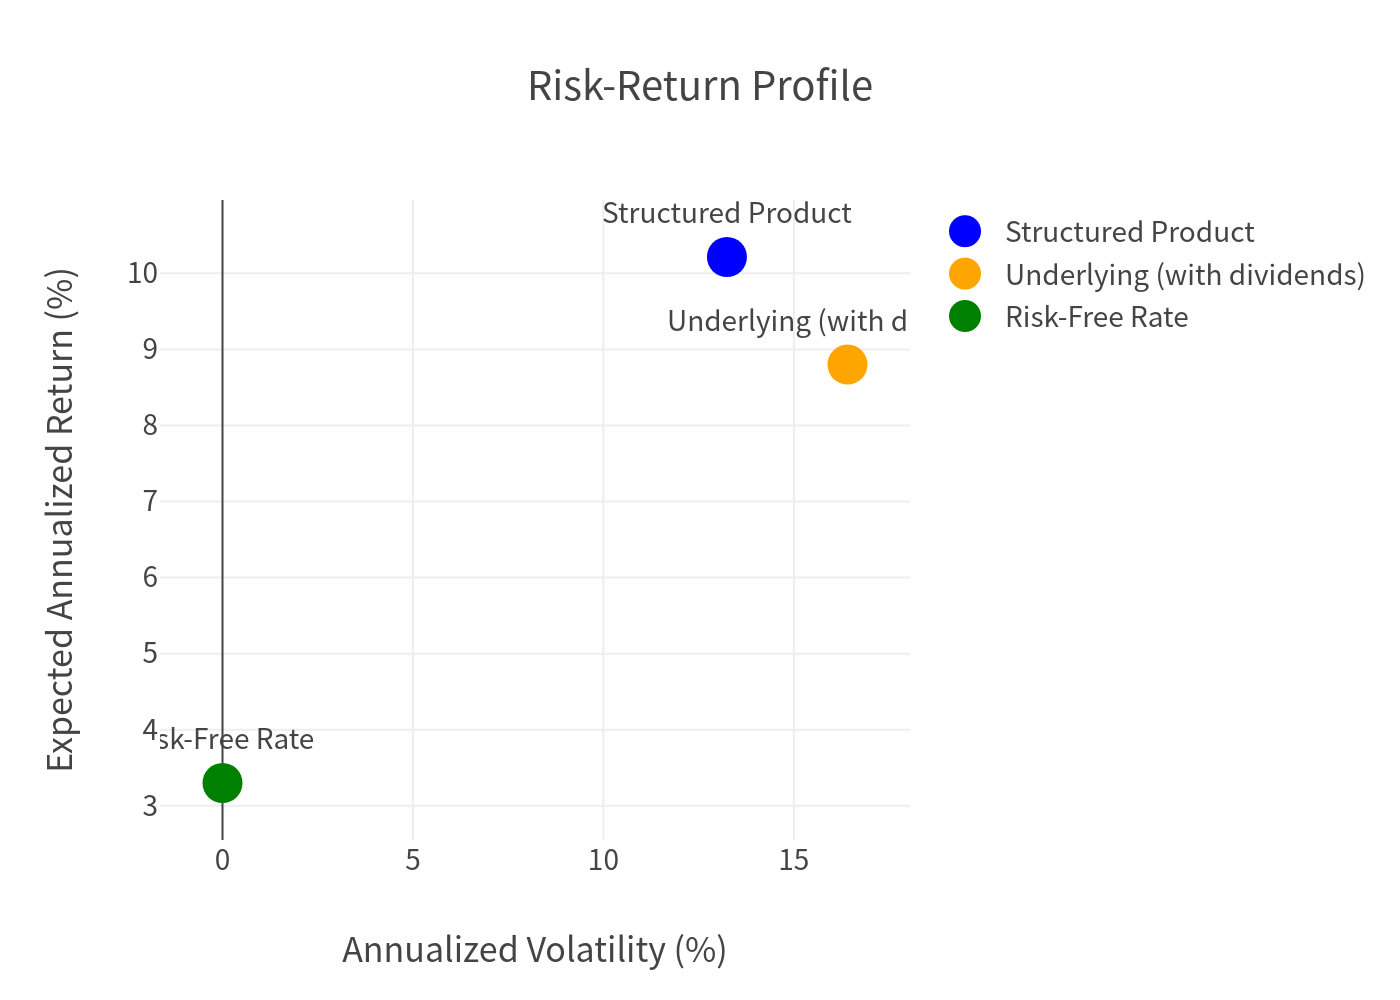
Chart from a real Speval analysis report.
Example equity linked note analysis
10.22%
Expected annualized return
3.5-year term
37.20%
Probability of negative return
Simulated
13.24%
Expected volatility
vs. 16.41% index
5%
Maximum principal loss
95% protection
An equity linked note (ELN) is a debt security whose return is tied to an equity index, a basket, or a single stock. The issuer combines a bond with an embedded option. The investor gets a coupon or participation in exchange for accepting whatever the option gives up: full protection, uncapped upside, income certainty, or liquidity.
That trade is the whole product. An ELN analysis tool should make the trade visible: what you are giving up, what you are being paid, and how often the bad outcome happens. Whether the term sheet says ELN, equity linked note, or equity linked notes analysis, the workflow is the same: define the payoff, model the paths, and compare the outcomes.
What is an ELN?
An ELN usually has three moving parts:
- A bond floor or protection level. Some ELNs protect 100% of principal, some protect a slice (95%, 90%), and some offer no protection at all.
- An equity participation feature. This can be a coupon, a participation rate, a cap, a digital payment, or a combination.
- A downside rule. If the underlying falls, the note either absorbs the loss, passes it through after a buffer, or converts into the underlying at maturity.
The label "ELN" covers a wide range. A 95%-protected note linked to the STOXX 600 and a worst-of autocallable linked to three stocks are both equity-linked, but they have very different risk.
ELN and equity linked notes analysis in one page
Decompose the note before modelling it:
- Bond component. What is the present value of the protected amount, given the issuer's credit and the term? This is the floor.
- Option component. What does the participation, coupon, or cap cost? The issuer funds the option from the bond's coupon and any fees.
- Path dependency. Does the payoff depend on a barrier, an average, an autocall, or the worst of several names? If yes, a single Black-Scholes price is not enough.
For path-dependent ELNs, the analysis should be a distribution. For a simple protected participation note, a closed-form comparison may be sufficient. The mistake is using a simple model on a complex payoff.
The metrics that matter for an ELN
| Metric | What it tells you |
|---|---|
| Expected annualized return | Probability-weighted return across all paths |
| Probability of loss | How often the note loses money, including small losses |
| Protection level and buffer | How much principal is exposed, and from what point |
| Participation rate and cap | How much upside is actually available |
| Expected volatility | How much the note's return varies |
| 99% VaR | Loss in the worst 1% of scenarios |
| Issuer credit spread | What the market charges for the issuer's credit risk |
The headline participation rate is not a risk measure. A 110% participation rate on a note with a 95% floor and no income can be less attractive than a 70% participation rate on a fully protected note with a shorter term.
Worked example: Morgan Stanley Equity-Linked Partial Principal at Risk Securities
Speval's report on a Morgan Stanley equity-linked note linked to the STOXX Europe 600 Index shows the trade clearly. The note protects 95% of principal at maturity, pays 110.5% participation in positive index performance, has 1:1 downside below the 95% protection level, pays no coupons, and matures in 3.5 years.
The simulation produced:
- 10.22% expected annualized return — above the index's 8.80% total-return expectation.
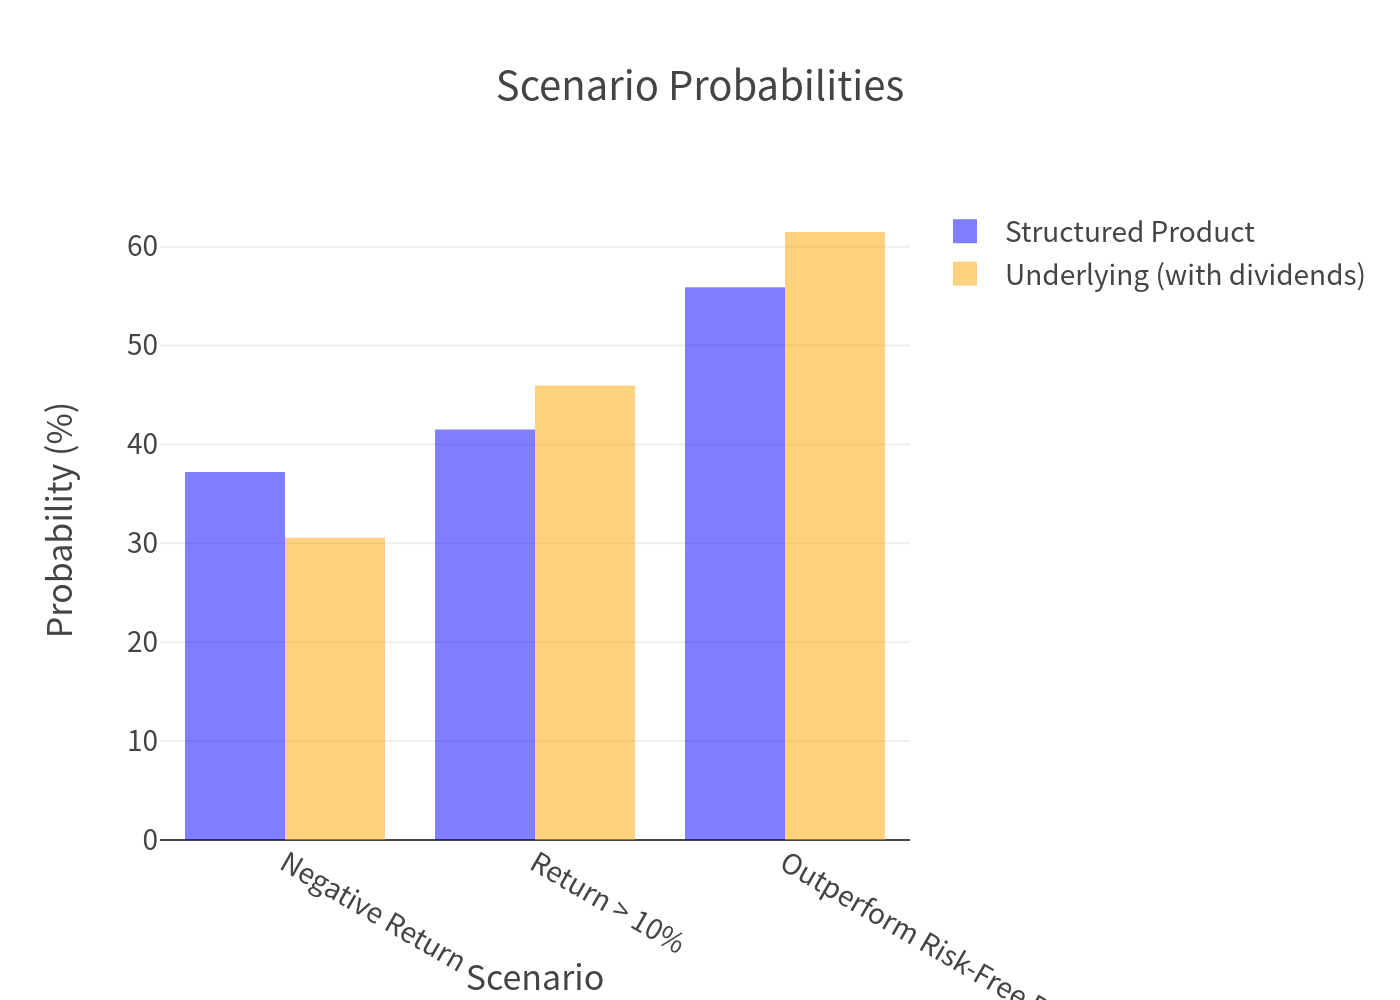
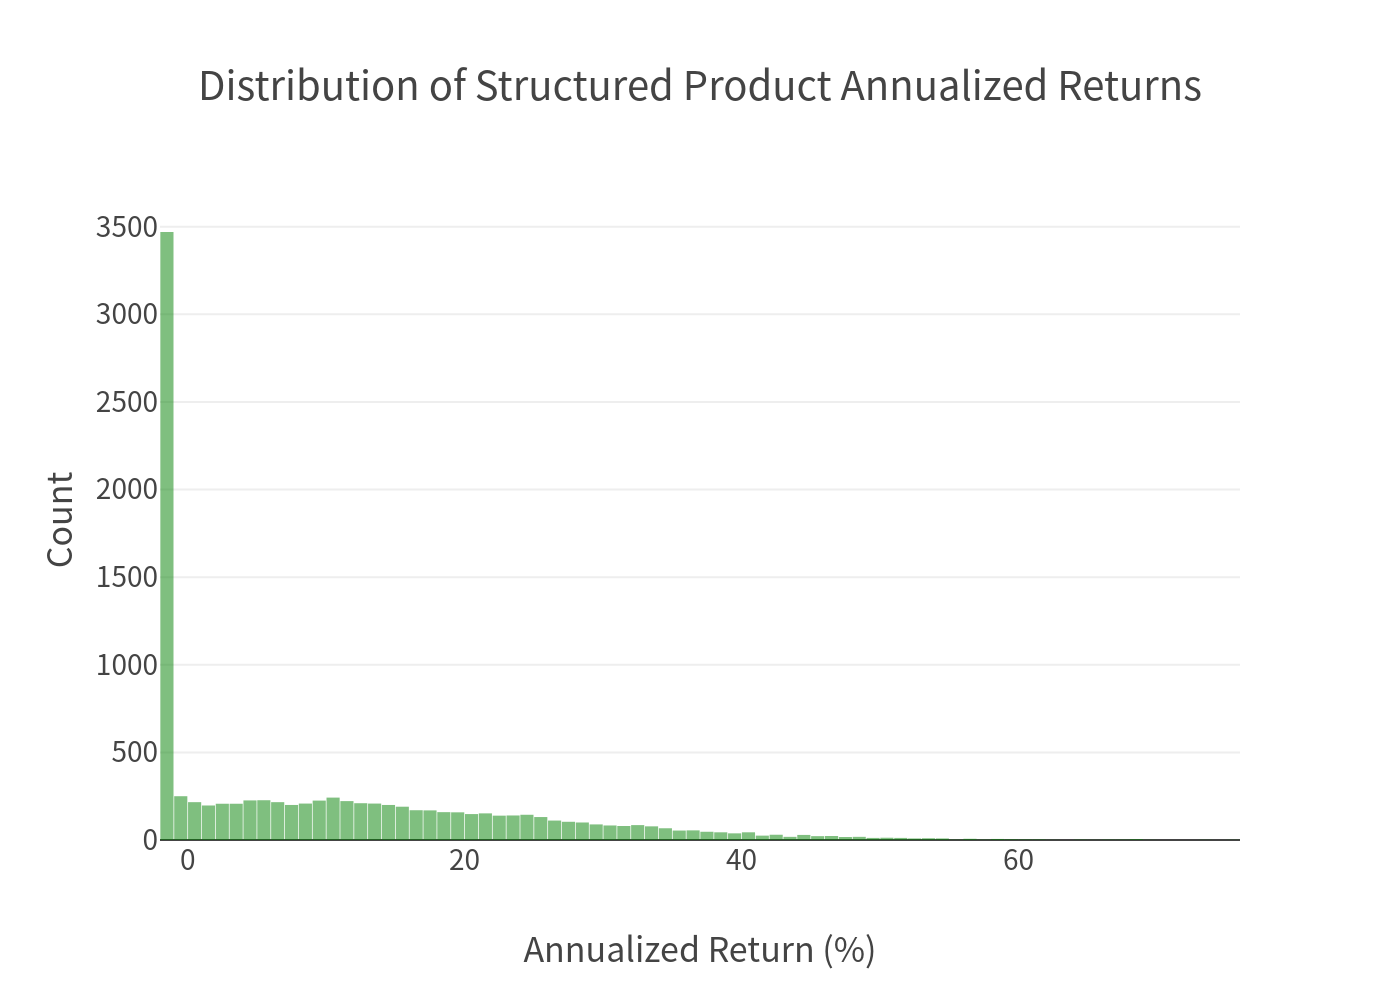
- 37.20% probability of a negative return — the note can lose money even with protection.
- 13.24% expected volatility — below the index's 16.41%.
- -1.45% 99% VaR — the worst 1% of paths lose about 1.45% annualized, versus -29.09% for the index.
- 5% maximum principal loss — the unprotected slice.
The result is a note that looks attractive on return and tail risk, but has a high probability of a small negative outcome. Whether that is acceptable depends on the client, not on the headline participation rate.
How to run an ELN analysis
- Upload the term sheet to the free evaluator.
- Confirm the extracted terms: protection level, participation, cap, term, observation style, and issuer.
- Review the distribution, not just the expected return. Look at the probability of loss and the 99% VaR.
- Compare the note with the underlying, a protected alternative, and cash.
- Document the scenario that would make the recommendation wrong.
ELN vs structured note vs market-linked note
- ELN is the broad category for notes linked to equities.
- Structured note is the broader category that also includes rates, credit, commodity, and hybrid structures.
- Market-linked note usually refers to a note linked to a market index, often with principal protection and a participation rate or cap.
In practice, the labels overlap. The analysis should follow the payoff, not the label.
Red flags in ELN term sheets
- Protection that is less than 100% but marketed as "capital protected."
- Participation measured on the price index, not total return, while the comparison uses total return.
- A cap that is close to the expected return, leaving little upside for the equity risk.
- No coupon and a long term, which makes the opportunity cost easy to miss.
- Issuer credit risk that is not reflected in the comparison.
- A barrier observed continuously when the summary implies a maturity-only test.
Related analysis
- Structured notes analysis tool for the broader category.
- Market-linked notes analysis tool for protected index notes.
- Principal protected note analysis tool for 100% protection structures.
- Structured product calculator for quick coupon and barrier math.
Figures in this article come from a Speval example report and are simulated, not investment advice.
Example equity linked note analysis
Morgan Stanley Equity-Linked Partial Principal at Risk Securities
This is a full report generated by Speval from a real term sheet. The same analysis is available for your product — upload the document and get the report in minutes.
Frequently asked questions
What is an ELN (equity linked note)?
An equity linked note is a debt security whose return is tied to an equity index, basket, or single stock. The issuer combines a bond with an embedded option, so the investor gives up some combination of capital protection, income certainty, or upside in exchange for the stated payoff.
How do you analyze an equity linked note?
Decompose the note into its bond floor and embedded option, then model the payoff across thousands of price paths. The output should show expected return, probability of loss, participation and cap effects, and the distribution of outcomes, not just the headline coupon or participation rate.
What is the difference between an ELN and a structured note?
ELN is a subset of structured notes. Every ELN is a structured note, but structured notes also include rates-linked, commodity-linked, credit-linked, and hybrid structures. In practice the terms are often used interchangeably for equity-linked retail notes.
Can an ELN lose money?
Yes, unless it offers full principal protection. Partial-protection ELNs can lose the unprotected slice; unprotected ELNs can lose most or all of the principal if the underlying falls below the relevant barrier or strike.
What metrics matter most in ELN analysis?
Probability of loss, expected return, participation rate and cap, protection level, volatility versus the underlying, and the 99% VaR. The headline coupon or participation rate alone is not a risk measure.
Does Speval support equity linked notes in multiple currencies?
Yes. Speval analyzes quanto and non-quanto structures and reports the currency assumptions it uses. FX risk is called out separately when the note is denominated in a different currency from the underlying.
Related analysis tools
Further reading
Run this analysis on your own term sheet
Upload a PDF, Excel, or Word term sheet. Speval extracts the terms, runs 10,000 Monte Carlo paths, and returns autocall probability, probability of loss, expected return, and scenario charts.