Case Study: A 99% Auto-Call Probability in Action
The Product
This structured note is linked to the SPUMP40 Index (S&P U.S. Equity Momentum 40% VT 4% Decrement Index), a custom index employing momentum-based equity selection with a 40% volatility target and a 4% per annum decrement (an embedded fee).
Key terms:
- Auto-call: Starting at month 12, if the underlier closes at or above 85% of its initial level on any monthly observation date, the security is redeemed at $1,000 notional plus ~10.50% per annum return
- Maturity payment (non-called): Fixed payment of approximately 10.50% per annum
- Downside protection: If the underlier declines more than 15% at maturity, investors absorb losses on a 1:1 basis below the 85% buffer, down to $150 per security
- Issuer: Morgan Stanley
- Auto-call: Starting at month 12, if the underlier closes at or above 85% of its initial level on any monthly observation date, the security is redeemed at $1,000 notional plus ~10.50% per annum return
- Maturity payment (non-called): Fixed payment of approximately 10.50% per annum
- Downside protection: If the underlier declines more than 15% at maturity, investors absorb losses on a 1:1 basis below the 85% buffer, down to $150 per security
- Issuer: Morgan Stanley
The Quantitative Analysis
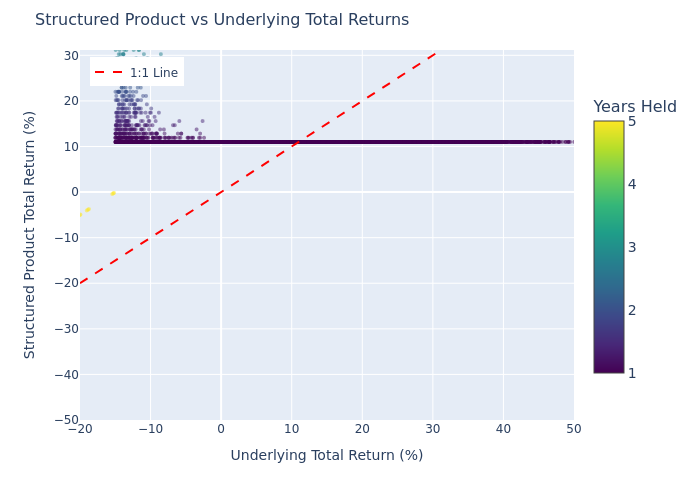
We ran 10,000 Monte Carlo simulations over a 60-month horizon using a GJR-GARCH(1,1) model with Student's t distribution, calibrated against 20 years of S&P 500 daily data. The results tell a compelling story.
Headline Results
What the Simulations Reveal
Near-Certain Early Redemption
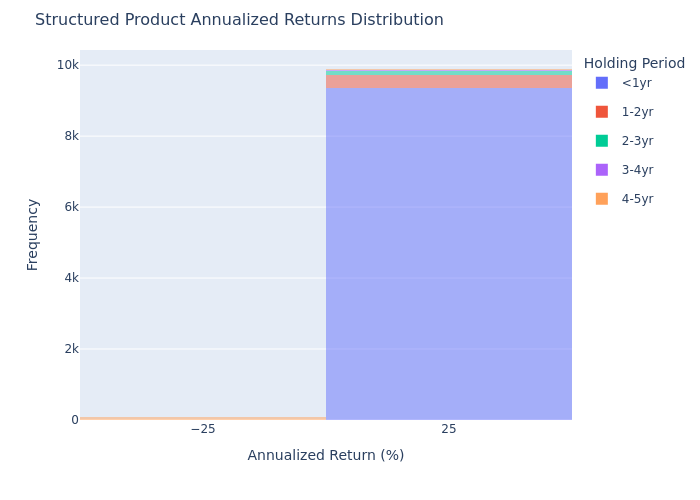
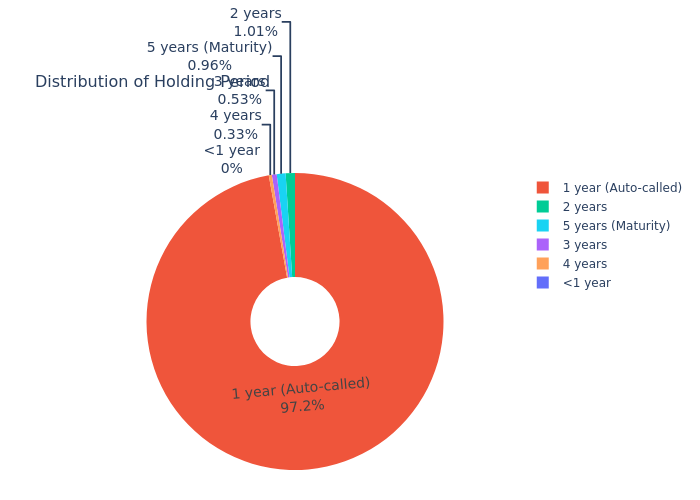
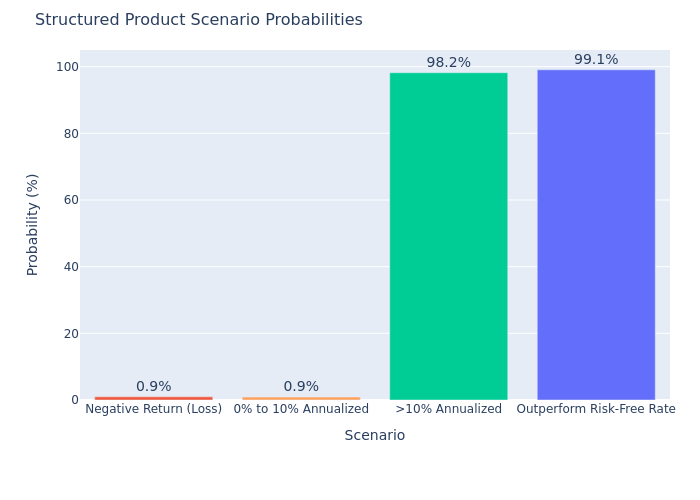
99.04% of simulation paths resulted in an auto-call. The vast majority were called at the very first observation date (month 12), giving the product an expected holding period of just 1.09 years. This is a structured product designed to return capital quickly.
Dramatic Volatility Reduction
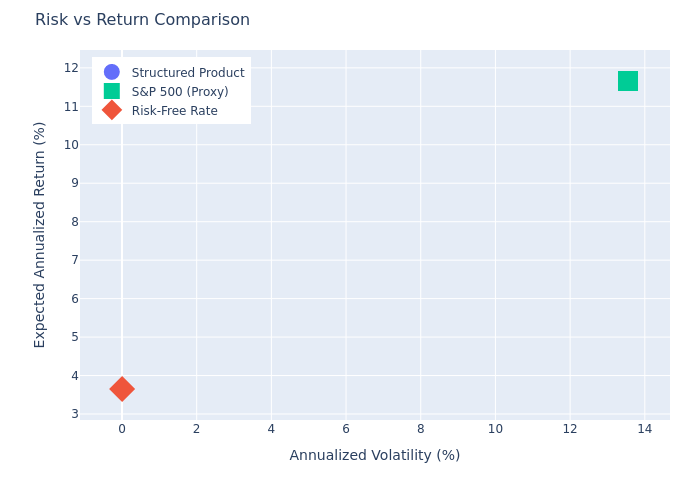
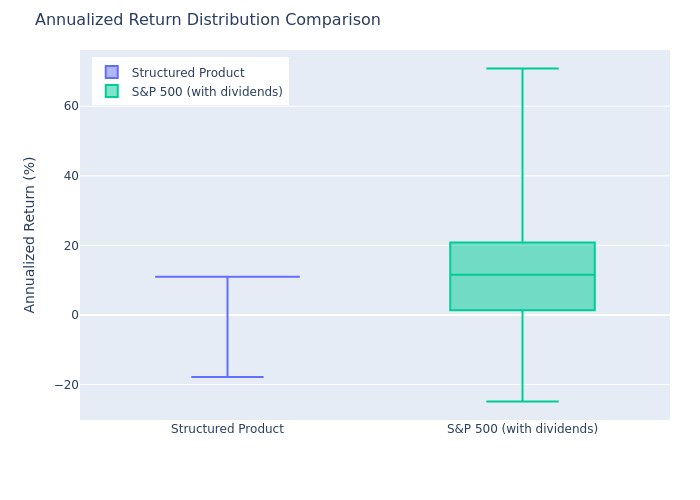
The structured product's expected volatility of 1.61% stands in stark contrast to the S&P 500's 13.55%. This is the buffer mechanism at work — it absorbs moderate market declines and compresses the return distribution around a narrow positive range.
Risk-Return Comparison
When plotted against the S&P 500 benchmark, the product occupies a distinct position on the risk-return spectrum: lower expected return than equities, but with dramatically compressed downside risk.
Strengths
Considerations
Why This Matters for Practitioners
For wealth managers and structured product analysts, this case study demonstrates the value of quantitative due diligence. A term sheet promising "99% auto-call probability" is striking — but the Monte Carlo simulation reveals the full picture: the near-certainty of early redemption, the concentration of outcomes in a narrow band, and the trade-offs between downside protection and upside participation.
Without running the simulation, an advisor might not appreciate how quickly the product is expected to redeem, or how the buffer mechanism reshapes the risk profile relative to a direct equity investment.
Run Your Own Analysis
Every structured product tells a different story. SP Evaluator lets you upload a term sheet and receive a comprehensive Monte Carlo simulation with the same depth of analysis shown here — return distributions, scenario probabilities, risk metrics, and benchmark comparisons.
SP Evaluator is a tool for professional use. Results are based on stated assumptions and market data. Independent verification is recommended. This is not investment advice. Past performance does not guarantee future results.