How to Calculate Structured Product Risks
How to Calculate Structured Product Risks
Structured products come with complex risk profiles that aren't captured by a single number. Here's how professionals evaluate risk using four essential metrics — applied to a real Market-Linked Note linked to the S&P 500.
The Four Key Risk Metrics
1. Expected Annualized Return
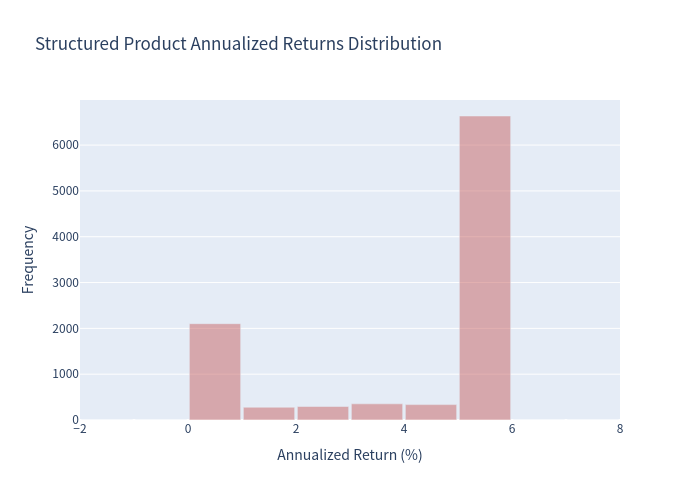
The average return across thousands of simulated market scenarios. Unlike the headline "maximum return" in the term sheet, this accounts for both good and bad outcomes.
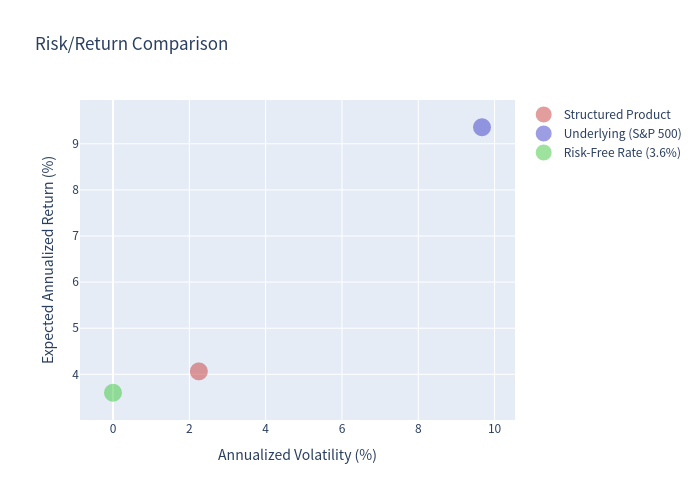
For the Market-Linked Note we analyzed: 4.06% expected annualized return, with a capped maximum of 17.50%. The S&P 500 underlying has a much higher expected return (11.76% with dividends) — but the note provides principal protection in exchange for capping upside.
2. Probability of Negative Return
The percentage of simulated scenarios where you lose money. This is the single most important risk metric for structured products.
For our Market-Linked Note: the probability of negative return was effectively 0% — it's a principal-protected note. But for non-principal-protected products, this number can be significant (e.g., 10-20% for barrier reverse convertibles).
3. Value at Risk (VaR)
The worst expected loss at a given confidence level. A 99% VaR of −X% means that in 99 out of 100 scenarios, your loss will not exceed X%.
For the Market-Linked Note: the 99% VaR was 0% — principal protection means no loss scenario. Compare this to the underlying S&P 500 index, which has a 99% VaR of approximately −20%.
4. Annualized Volatility
How much the product's return varies year to year. Lower volatility typically means more predictable outcomes.
For the Market-Linked Note: the expected volatility was ~5% — significantly lower than the S&P 500's ~18% annualized volatility, thanks to the principal protection structure.
Putting It Together: A Risk Profile
Here's how the four metrics paint a complete picture of the Market-Linked Note:
The note offers complete downside protection but caps upside at 17.50%. This creates a risk profile where you won't lose money but will underperform in strong bull markets.
How to Run Risk Calculations Yourself
Instead of manually computing Monte Carlo simulations, you can use tools that handle the heavy lifting:
Token Engine's SP Evaluator automates all four steps. Upload any structured product term sheet and get the full risk profile in minutes.