Worst-of baskets · correlation risk
Worst-Of Notes Analysis Tool
A worst-of note does not care about the average. It cares about the one name that breaks. That makes correlation and single-name tail risk the centre of the analysis.
No login required · Independent, issuer-neutral analysis
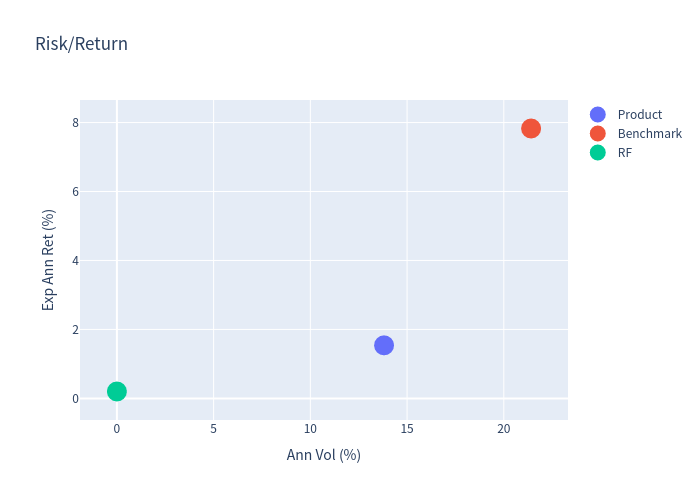
Chart from a real Speval analysis report.
Example worst-of note analysis
3 names
Worst-of basket
Bayer, EMS-CHEMIE, Lonza
26.0%
Probability of loss
Simulated
48.2%
Early redemption
Autocall
60%
Knock-in barrier
Continuous
A worst-of note does not care about the average. It cares about the weakest name in the basket. If one stock falls far enough, the payoff can be driven by that stock even if the other names are flat or up.
That makes correlation and single-name tail risk the centre of the analysis. A worst-of notes analysis tool should show the joint behaviour of the basket, not just each name's volatility.
What is a worst-of note?
A worst-of note is a structured note linked to a basket whose payoff is determined by the worst-performing underlying. Common variants include:
- Worst-of reverse convertible. The coupon is paid, but if the barrier is breached, the maturity payoff is based on the worst-performing stock.
- Worst-of autocallable. The note can autocall if all names are at or above their initial levels; the barrier may be breached by any single name.
- Worst-of bonus certificate. The bonus is paid if the barrier holds; if it is breached, the payoff reverts to the worst-performing stock.
The worst-of feature usually increases the coupon or bonus, because the investor is taking more tail risk than a single-name note.
Correlation is the hidden variable
For a basket of two stocks, the risk is not just the average volatility. It is also how the stocks move together:
- High correlation. The names behave more like one asset. The worst-of feature is less damaging because the names tend to fall together.
- Low correlation. The names move independently, which increases the chance that at least one name breaches a barrier while the others hold up.
In a worst-of note, lower correlation can be worse for the investor. That is counter-intuitive and easy to miss. The analysis should stress correlation, not just volatility.
Worked example: 10.75% CHF Autocall Barrier Reverse Convertible on a worst-of basket
Speval's example report analyzes a 10.75% p.a. CHF autocall barrier reverse convertible linked to a worst-of basket of Bayer AG, EMS-CHEMIE Holding AG, and Lonza Group AG. The note pays a 10.75% annual coupon, can autocall from around month six if all three names are at or above their initial levels, and has a continuous 60% knock-in barrier on each name.
The simulation produced:
- 1.54% expected annualized return — far below the 10.75% coupon.
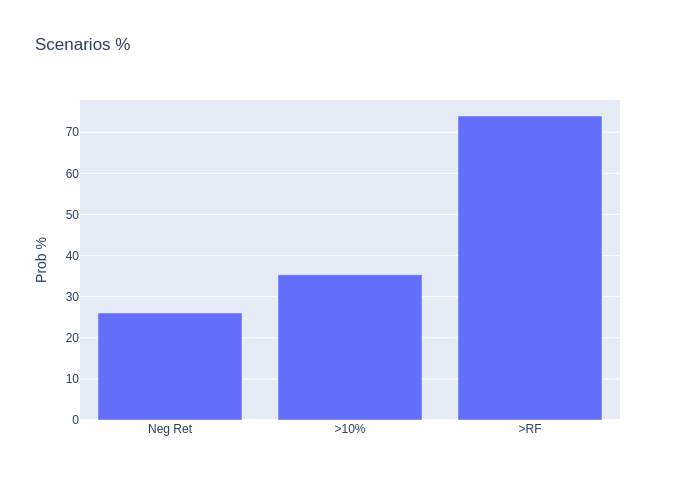
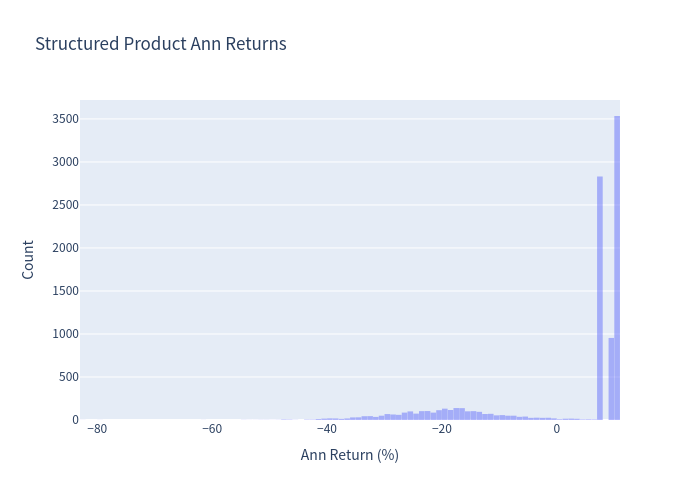
- 26.0% probability of a negative return — the worst-of feature drives the tail.
- 38.0% 99% VaR — the loss in the worst 1% of paths.
- 13.3 months expected holding period — shorter than the stated term.
- 48.2% early redemption probability — the note is called in roughly half of paths.
The expected return is low relative to the coupon because the paths that are not called are often the paths where one name has fallen and the barrier is at risk. The coupon compensates for that risk, but it does not eliminate it.
Worst-of autocallables vs single-name notes
A worst-of autocallable usually offers a higher coupon than a single-name note because the investor is taking more risk. The trade-off is not just a higher probability of loss; it is a different loss distribution:
- Single-name note. The loss is driven by one stock's path.
- Worst-of note. The loss is driven by the weakest of several paths. The probability that at least one name breaches a barrier is higher than the probability that a single name does, especially when correlations are low.
The analysis should show the identity of the worst performer across scenarios, not just the aggregate loss probability.
Stress testing correlation
A historical simulation uses historical correlations. Those correlations can change. A worst-of analysis should include:
- Correlation stress. What happens if correlations fall? The barrier breach probability usually rises.
- Volatility stress. What happens if volatility rises? The tails get fatter.
- Single-name stress. What happens if one name falls sharply while the others hold up?
- Barrier observation stress. Continuous vs closing-price observation can change the breach probability materially.
If a report shows only one correlation assumption, it is not a stress test.
What to check in a worst-of term sheet
- Basket composition. How many names, and how correlated are they historically?
- Barrier level and observation style. Continuous vs closing vs maturity-only.
- Autocall condition. Does it require all names, a percentage of names, or the basket average?
- Worst-of definition. Is it based on price return or total return? Is it measured at maturity or throughout?
- Coupon conditions. Unconditional, conditional, or memory-linked?
- Currency. Quanto or non-quanto.
Related analysis
- Reverse convertible analysis tool for barrier reverse convertibles.
- Autocallable notes analysis tool for autocall features.
- Structured notes analysis tool for the broader category.
- Structured product calculator for quick coupon and barrier math.
Figures in this article come from a Speval example report and are simulated, not investment advice.
Example worst-of note analysis
10.75% p.a. CHF Autocall Barrier Reverse Convertible on a worst-of basket
This is a full report generated by Speval from a real term sheet. The same analysis is available for your product — upload the document and get the report in minutes.
Frequently asked questions
What is a worst-of note?
A worst-of note is linked to a basket whose payoff is determined by the worst-performing underlying. Even if most names rise, one weak name can drive the maturity payoff and the loss.
Why does correlation matter in a worst-of note?
Lower correlation means the basket members move more independently, which increases the chance that at least one name breaches a barrier. Higher correlation makes the names behave more like a single asset. The analysis should stress correlation, not just volatility.
How do you analyze a worst-of note?
Simulate the basket jointly, preserving historical volatilities and correlations, then apply the worst-of payoff and barrier rules on every path. Report probability of loss, barrier breach probability, expected return, and the identity of the worst performer across scenarios.
What is a worst-of autocallable?
A worst-of autocallable combines a basket-linked note with an early-redemption trigger. The autocall usually requires all names to be at or above their initial levels, while the barrier may be breached by any single name.
Is a worst-of note riskier than a single-name note?
Not necessarily in every scenario, but it carries a different risk. The coupon is usually higher to compensate for the worst-of feature, and the left tail can be fatter because one name can drive the loss even when the basket average is positive.
What data does Speval use for basket analysis?
Speval fits the historical return series and dependence structure for each basket member, then simulates joint paths. The report states the historical window and the modelling assumptions.
Related analysis tools
Further reading
Run this analysis on your own term sheet
Upload a PDF, Excel, or Word term sheet. Speval extracts the terms, runs 10,000 Monte Carlo paths, and returns autocall probability, probability of loss, expected return, and scenario charts.