
Morgan Stanley Worst-of INDU, SX5E & RTY Contingent Income Auto-Callable Securities
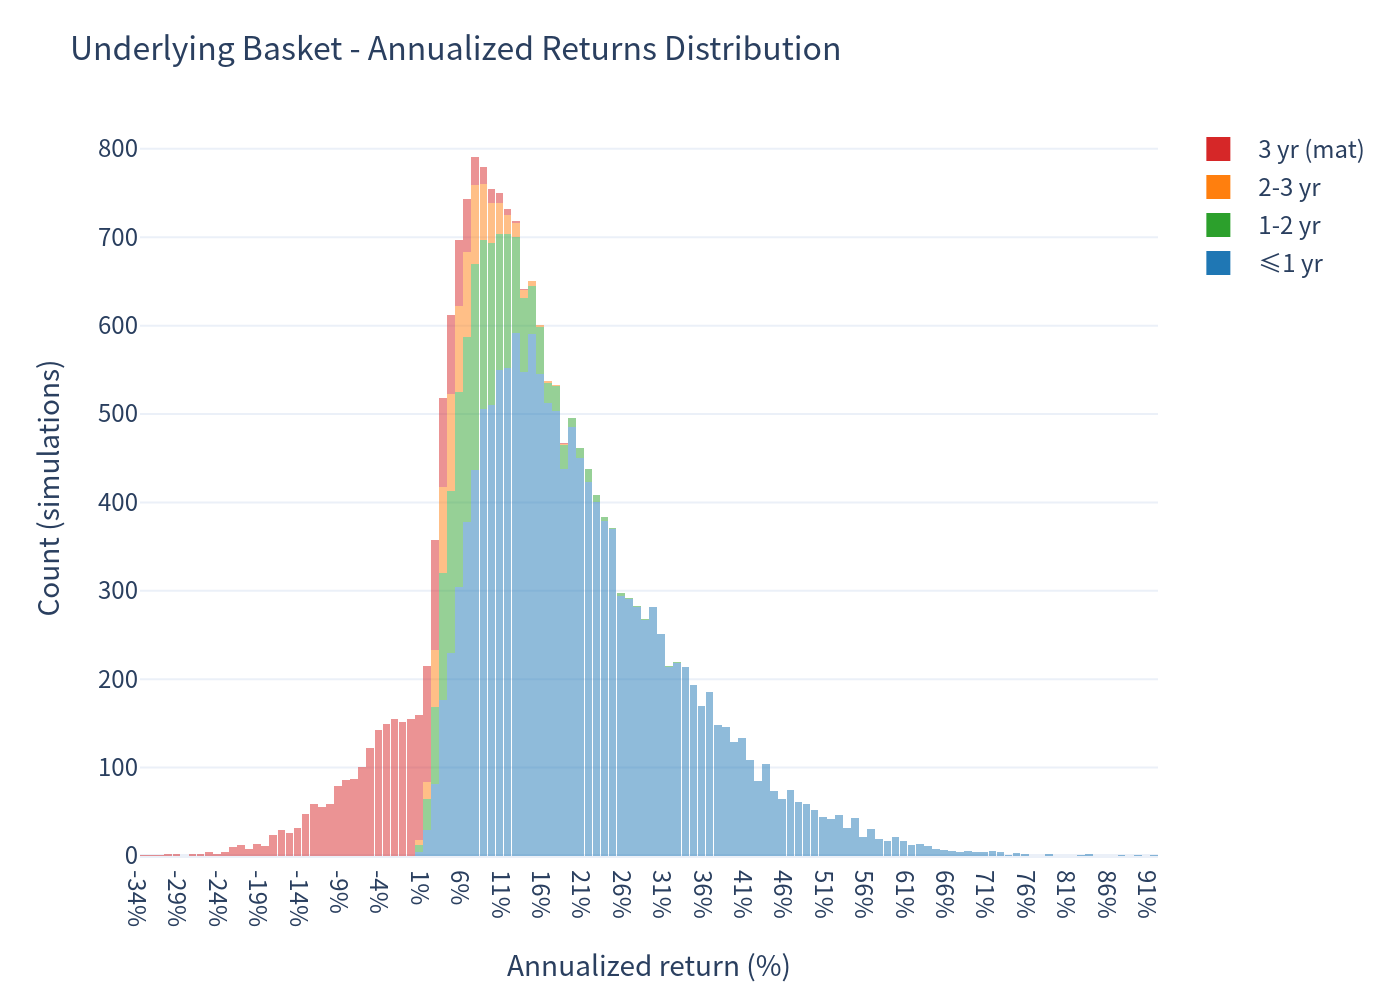
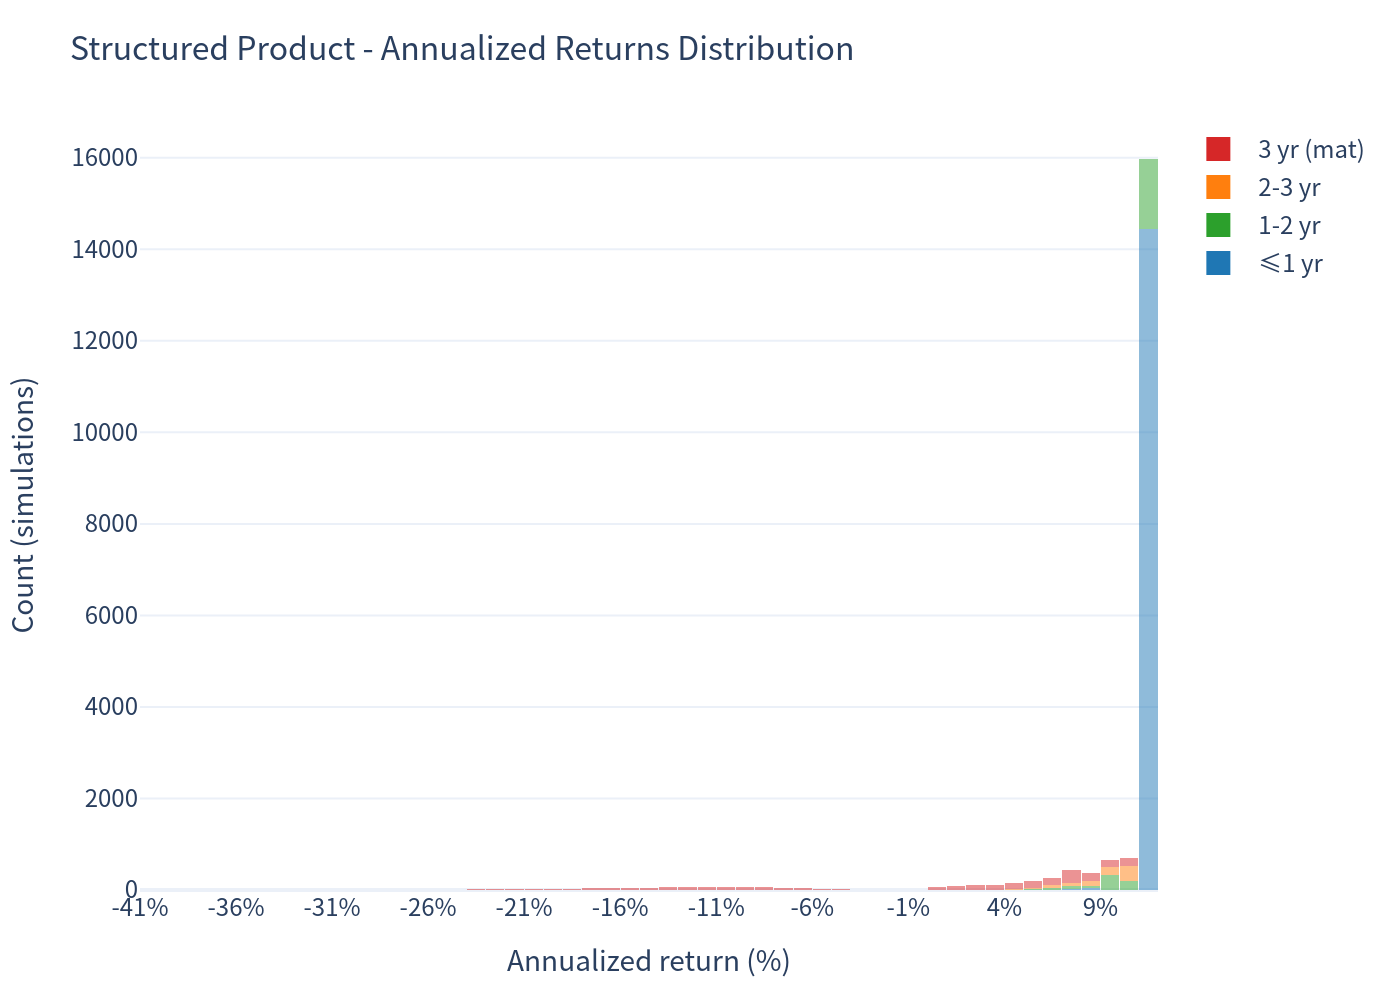
Note on annualized figures: the product auto-calls very early in most scenarios (~55% of simulations end within 6 months). For holding periods shorter than 12 months, annualized returns are scaled linearly and can therefore look elevated; the expected total return of 7.89% over the average holding period of about one year is the more intuitive figure.
How It Works
- The security is linked to the worst performing of three major equity indices: the Dow Jones Industrial Average (INDU), the EURO STOXX 50 (SX5E) and the Russell 2000 (RTY).
- It pays a contingent quarterly coupon of 2.88% (11.50% per annum, midpoint of the 11.00%–12.00% range) on each quarterly payment date, provided that all three indices close at or above 80% of their initial level on the related observation date.
- Starting after 6 months, on each quarterly observation date, if all three indices close at or above 100% of their initial level, the security is automatically redeemed at par plus the coupon then due.
- If not auto-called, at maturity (36 months) the investor receives:
- Par + final coupon if all three indices are at or above 80% of initial;
- Par only if the worst index is between 70% and 80% of initial;
- A 1-for-1 loss matching the worst index if it falls below 70% of initial.
- Upside is capped: the investor does not participate in any index appreciation beyond the coupons.
Key Product Facts
- Coupon: 11.50% p.a. (range 11.00%–12.00%), paid quarterly = 2.875 points per coupon on a 100 notional; up to 12 coupons (max 34.50 points).
- Autocall: quarterly from month 6, at 100% of initial for each index.
- Coupon barrier: 80% of initial for each index.
- Downside threshold: 70% of initial (worst-of, observed at maturity).
- Underlying type: worst-of, 3 equity indices; payoff depends on the worst performer.
| Metric | Structured Product | Underlying Basket (total return) |
|---|---|---|
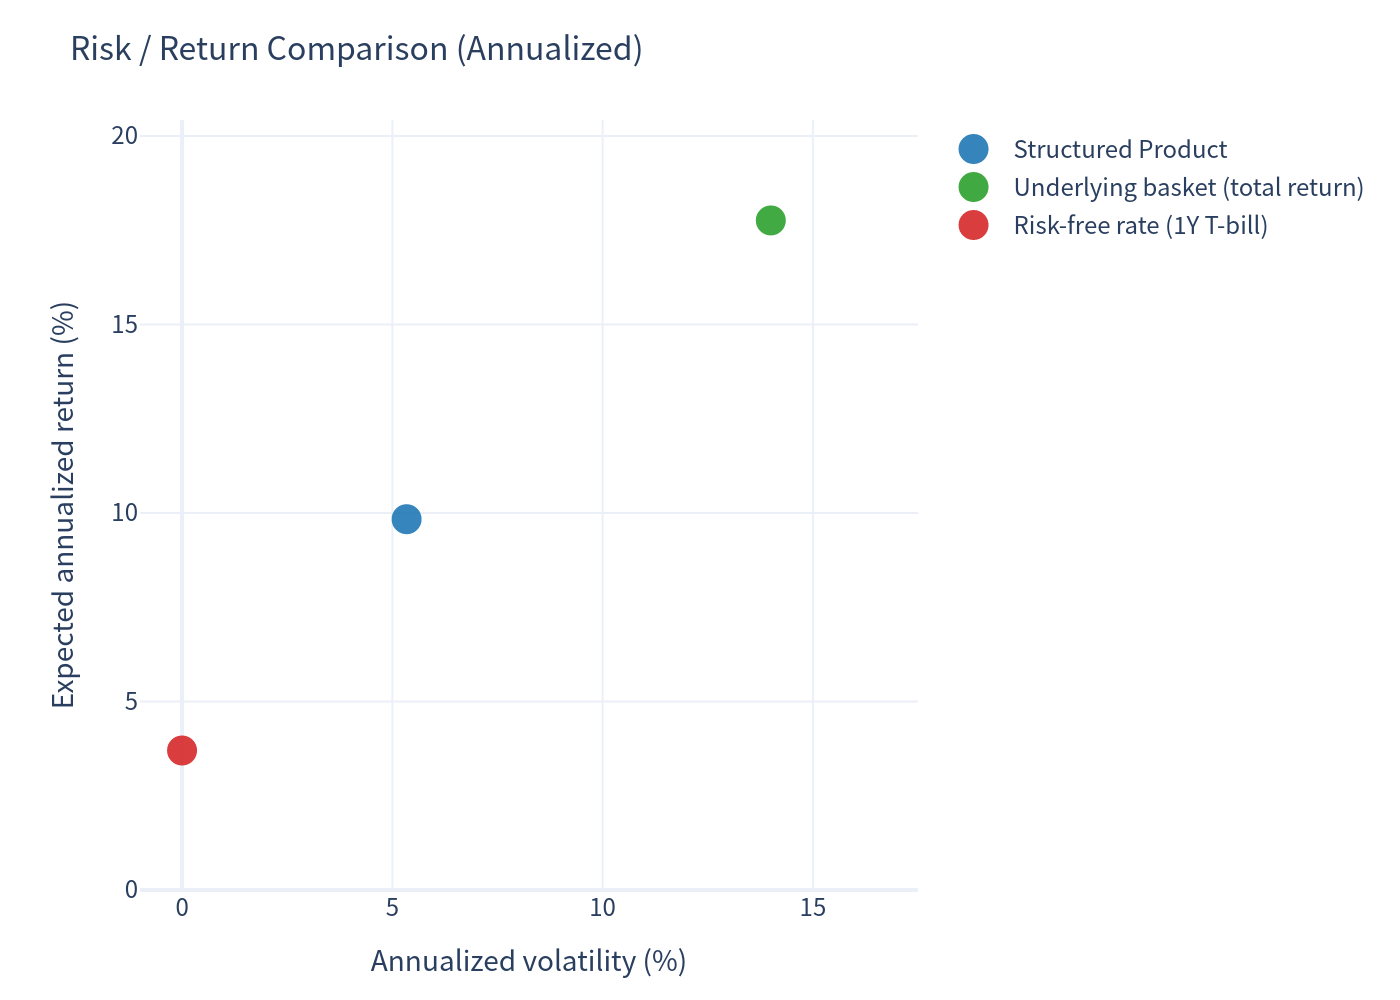
| Expected annualized return | 9.83% | 17.76% |
| Expected annualized volatility | 5.34% | 14.00% |
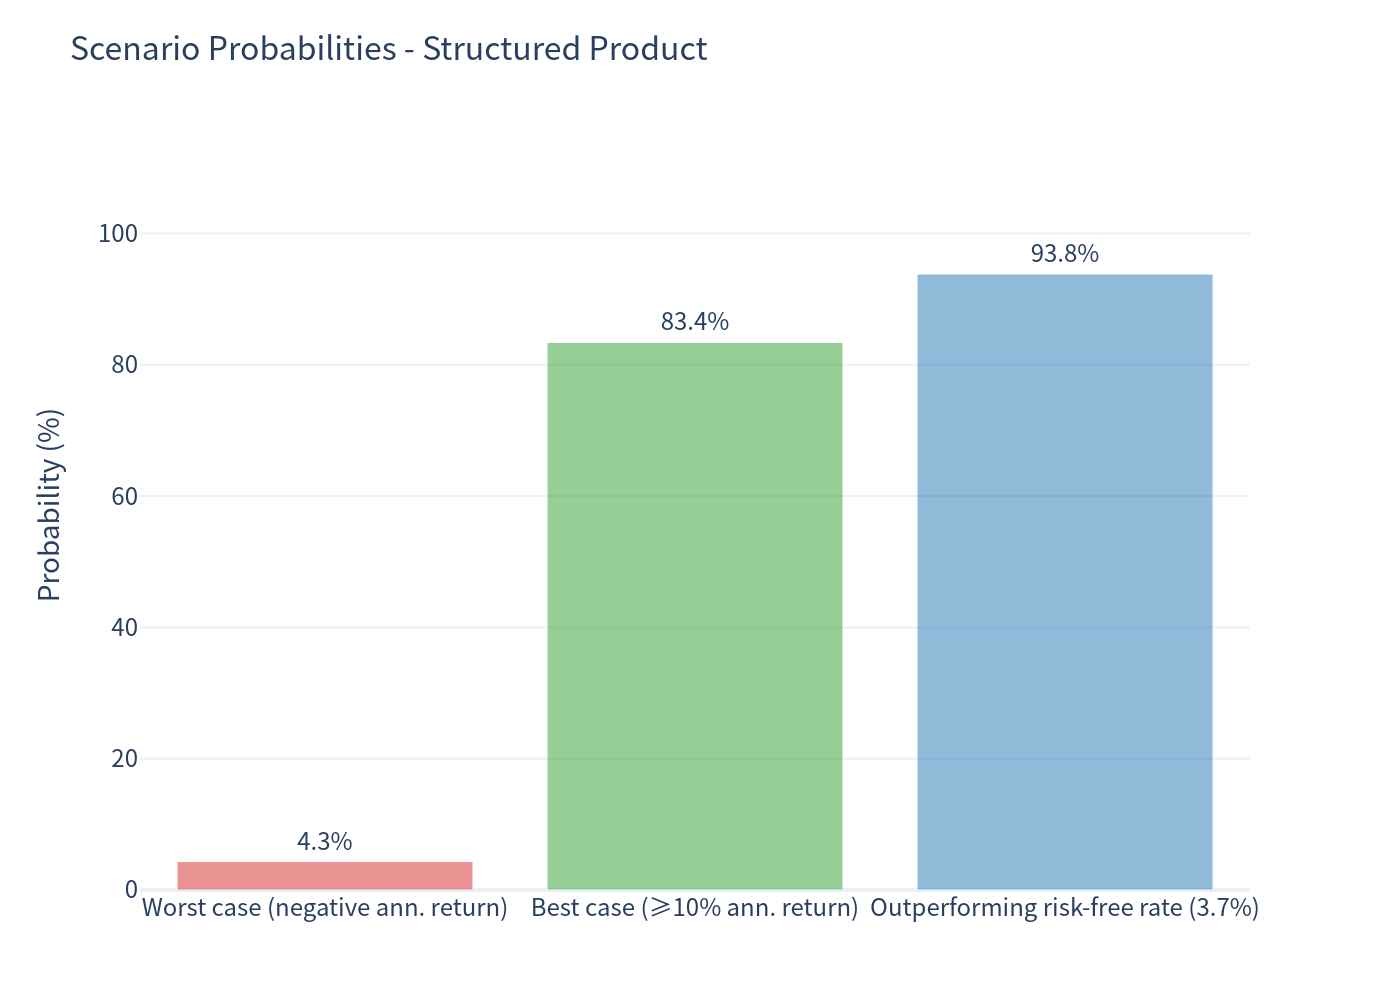
| Probability of loss | 4.34% | 6.97% |
| 99% VaR (1-year) | -17.04% | -12.11% |
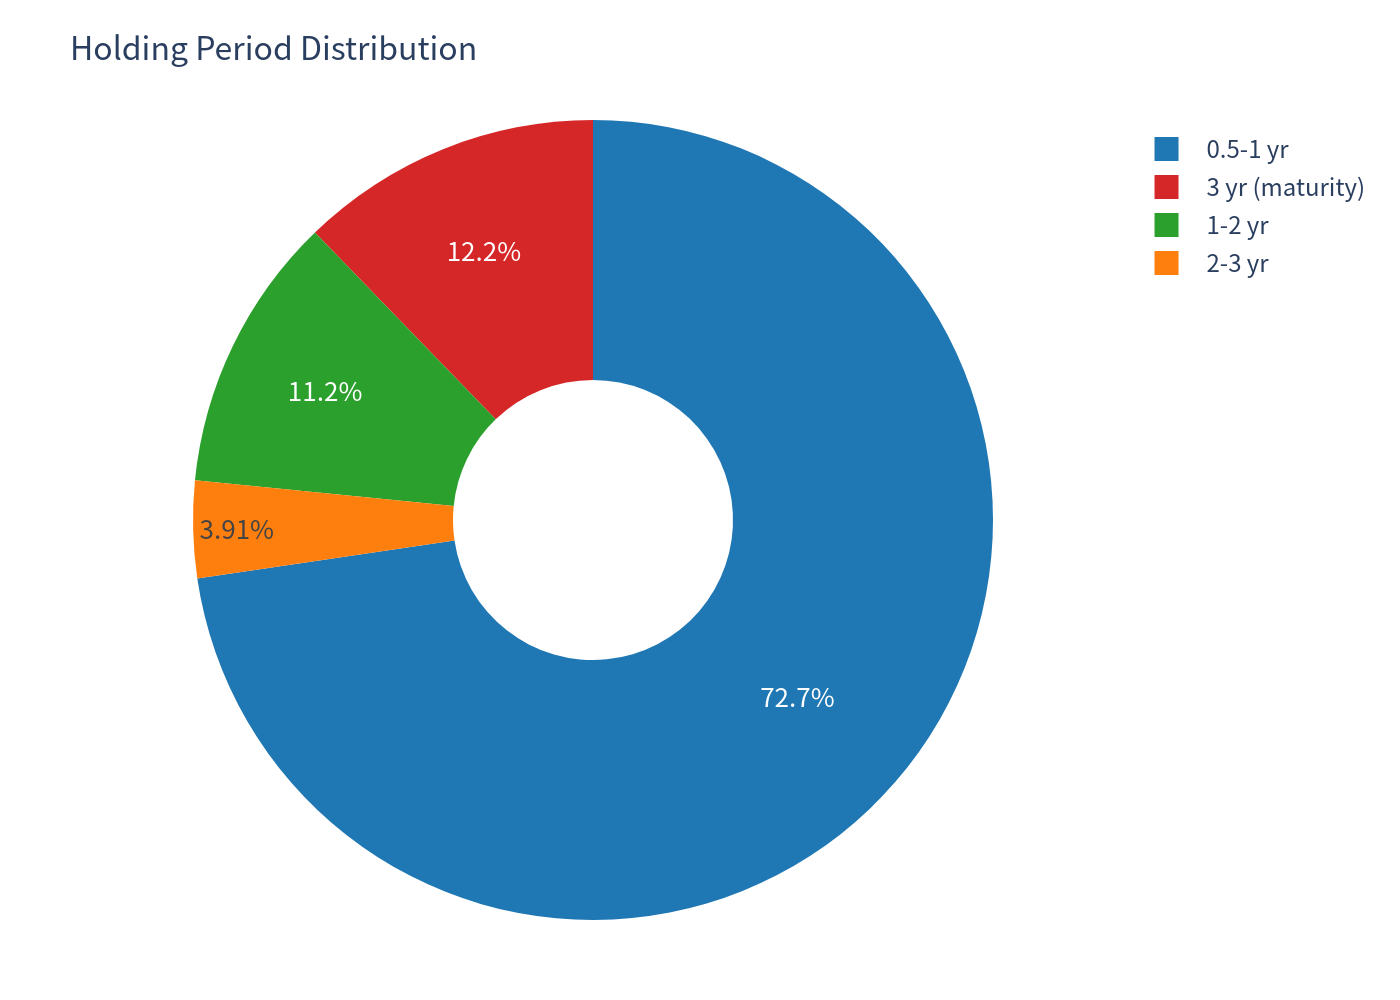
- Autocall probability: 87.77% (security redeemed early); 12.23% held to maturity.
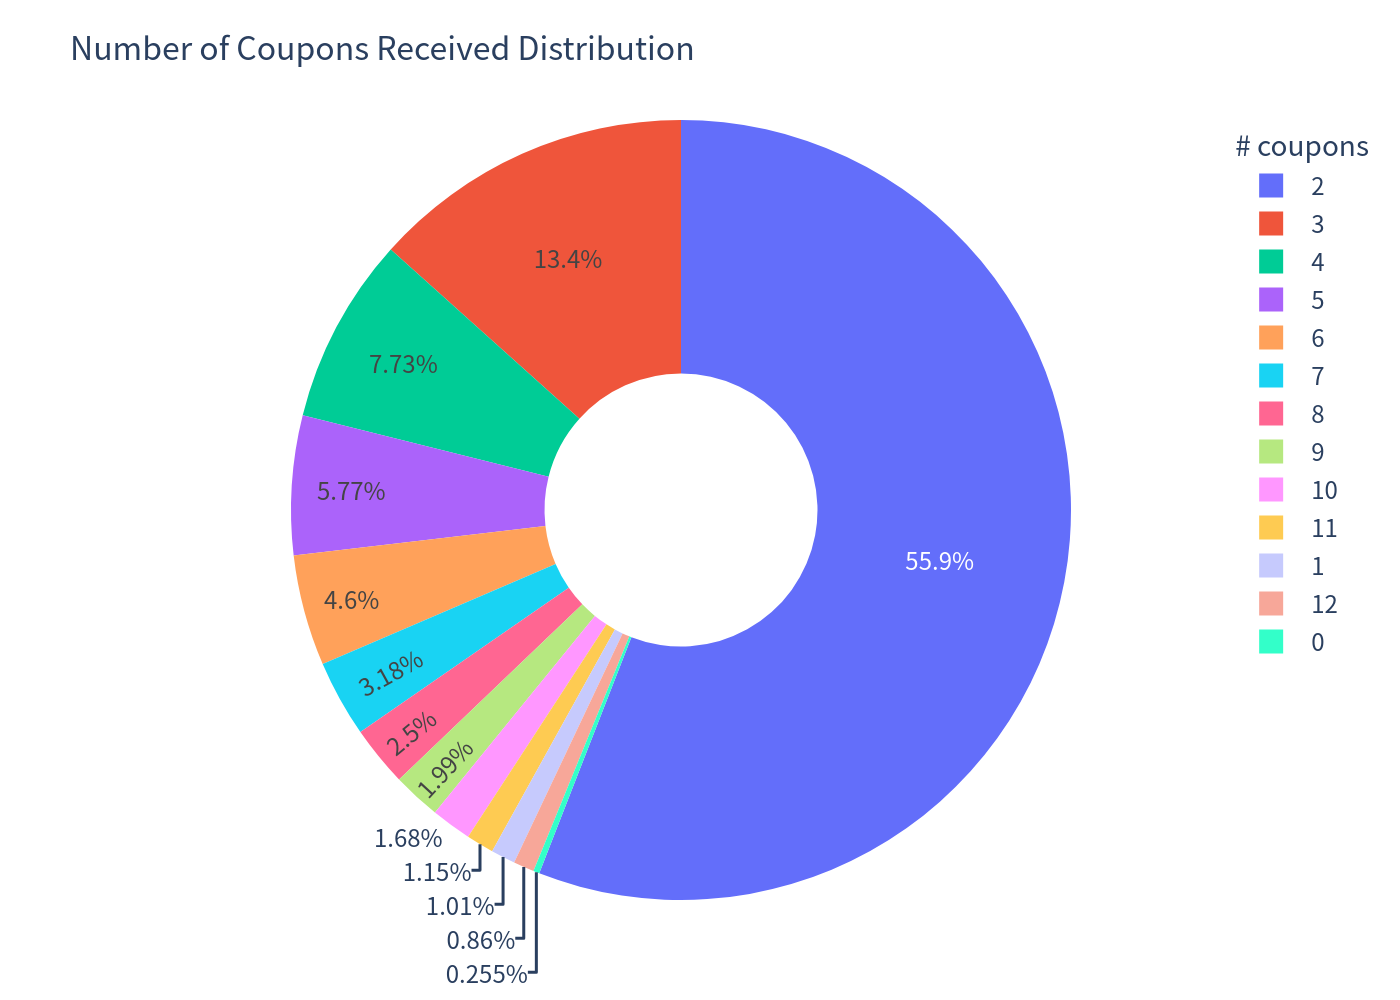
- Coupons received: average 3.40; median 2; probability of receiving at least one coupon ≈ 99.7%.
- Best case (≥10% annualized): 83.41% probability.
- Outperforming risk-free (3.70%): 93.83% probability.
- Underlying basket figures are an equal-weighted average of the three indices (dividends included, ~1.61% average yield), measured over the same holding period as the product.
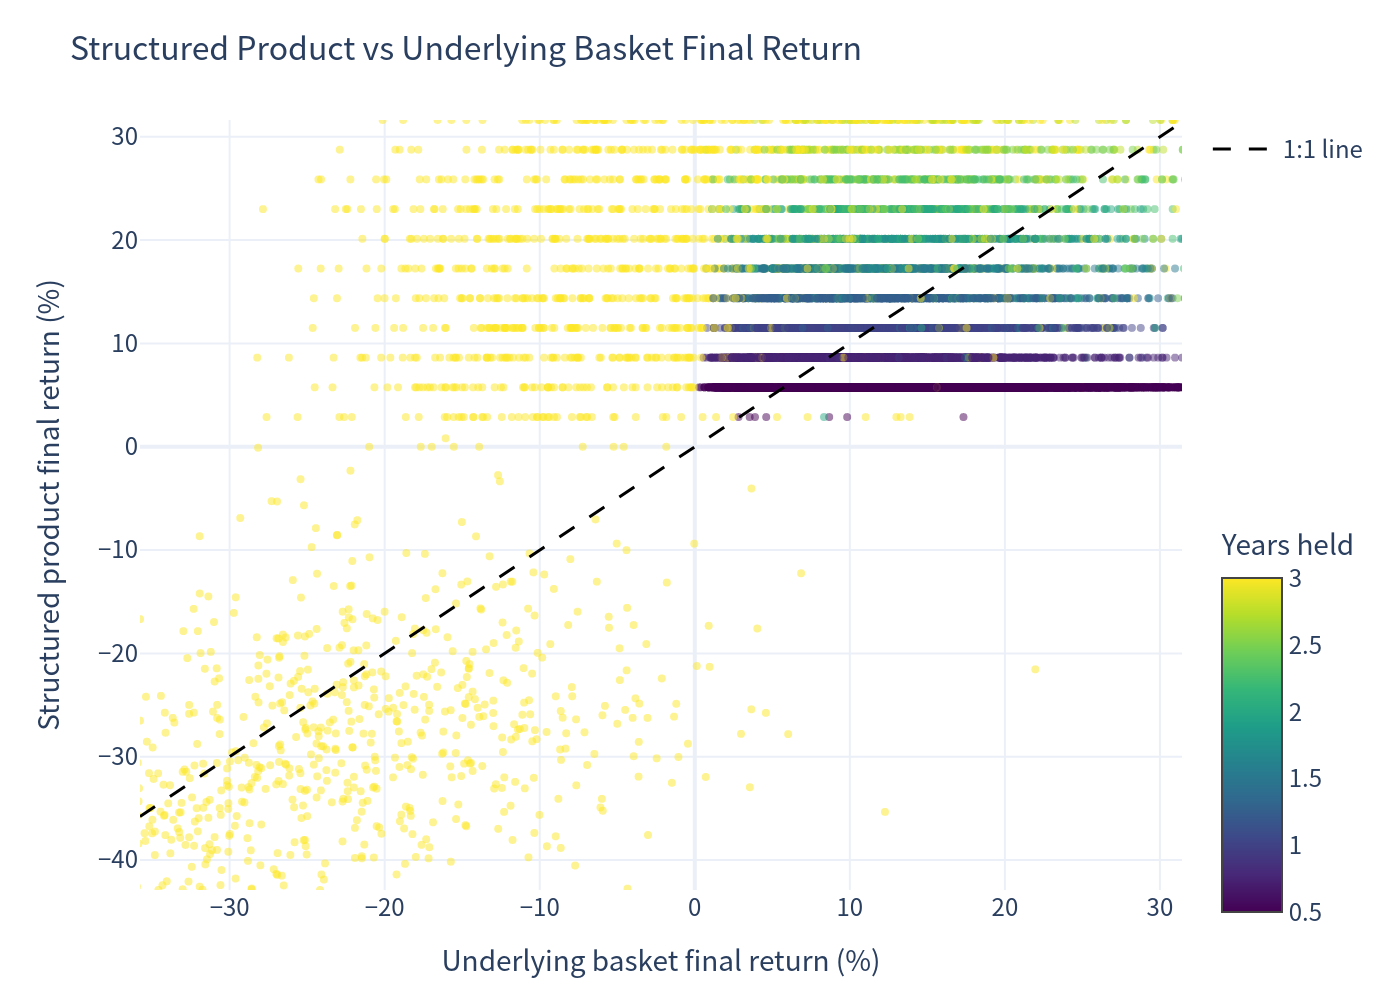
Simulation Outcomes (Product vs Underlying Final Return)
Scatter of simulated final returns for the structured product against the equal-weighted underlying basket.
Annualized Return Distributions
Distribution of annualized returns for the underlying basket (left) and the structured product (right).
Scenario Probabilities
Probability of each key scenario: early autocall, held to maturity with coupon, par-only, and principal loss.
Risk / Return Comparison
Annualized return versus annualized volatility for the product versus the underlying basket and risk-free benchmark.
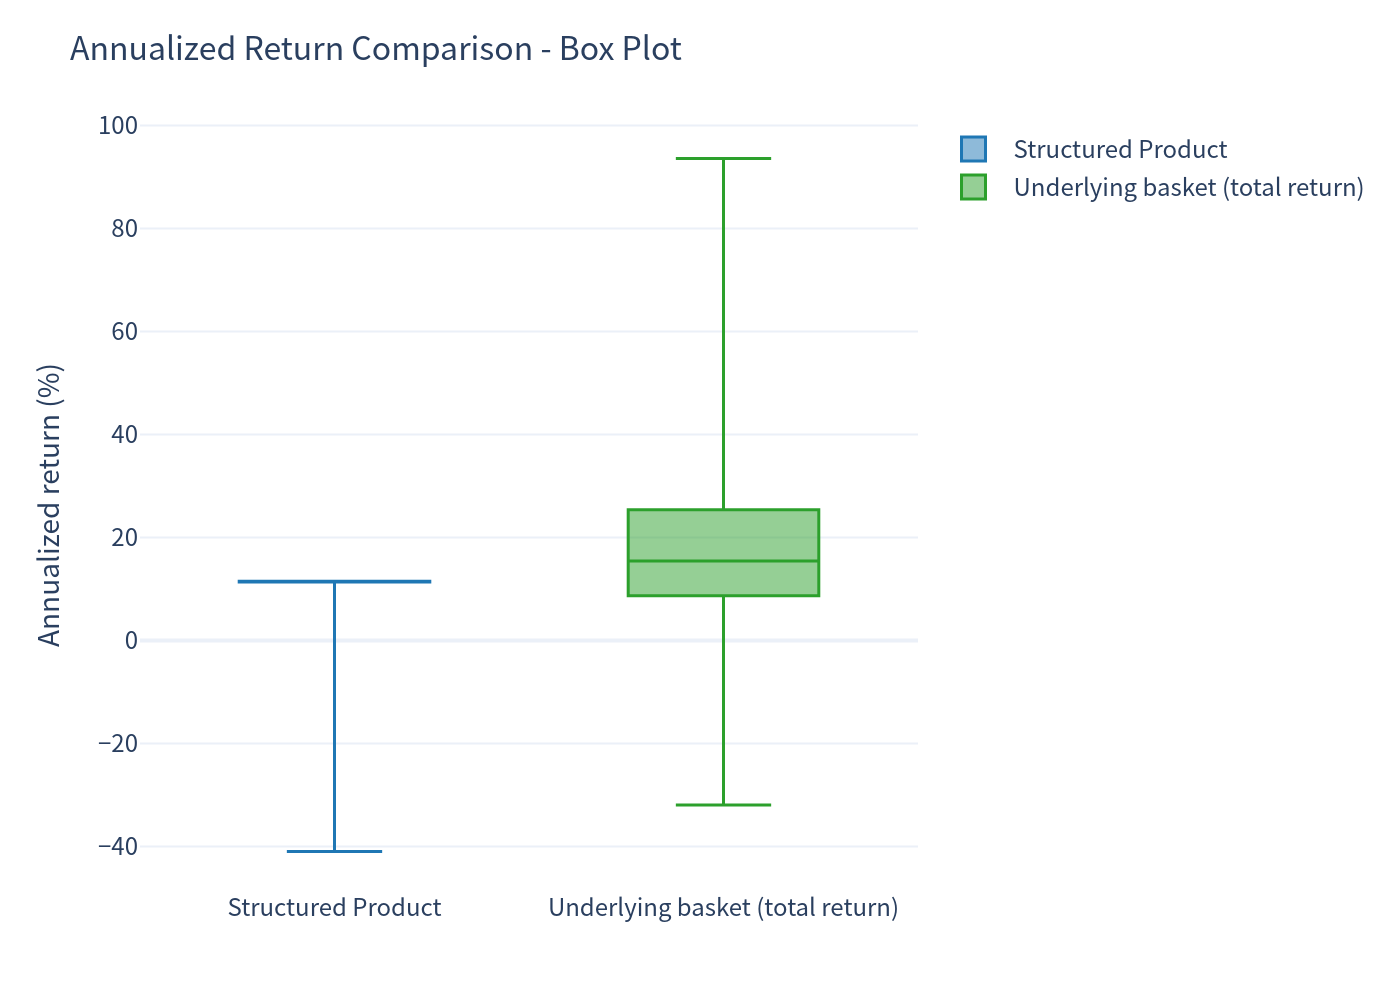
Annualized Return Box Plot
Distribution of annualized returns across simulated scenarios, highlighting median, interquartile range, and outliers.
Holding Period & Coupon Distributions
Breakdown of expected holding periods (left) and the number of coupons received (right).
Key strengths of this product:
- High probability of positive return — 95.7% of simulated scenarios end with a positive total return, and 93.8% outperform the risk-free rate.
- Attractive coupon income — an 11.50% p.a. contingent coupon with a relatively deep 80% coupon barrier produced coupons in nearly all scenarios (median 2 coupons over a ~1-year average holding period).
- Frequent early redemption — 87.8% of scenarios are auto-called, typically within 12 months, returning par plus coupon and reducing market exposure duration.
- Meaningful downside cushion — principal is protected unless the worst of the three indices falls by more than 30% at maturity.
- Favorable risk profile — annualized volatility of 5.34% is roughly one-third that of the underlying basket, with a positive expected return premium over the risk-free rate.
Points to be aware of:
- Capped upside — returns are limited to the coupon stream; the product never participates in index appreciation.
- Contingent coupons are not guaranteed — if any index is below 80% of initial on an observation date, that period's coupon is skipped.
- Worst-of structure — exposure is governed by the weakest of the three indices, which increases the probability of hitting barriers relative to a single-index product.
- Principal risk at maturity — if the worst index falls below 70% of initial at the final observation, losses are realized at 1:1.
- Early-redemption / reinvestment risk — the high autocall rate means funds are typically returned within about a year, exposing investors to reinvestment risk at prevailing rates.
This analysis is for informational purposes only and does not constitute investment advice or a suitability assessment.