
11.00% p.a. Multi Barrier Reverse Convertible (Callable) on AXA, ING & Munich Re
1. Headline Simulation Results
Based on a GJR-GARCH Monte-Carlo simulation (10,000 paths, monthly steps, ~21-month horizon) applied to the three underlyings and the product's exact payoff logic:
| Metric | Structured Product |
|---|---|
| Expected annualized return | 8.15% |
| Expected total return over the (variable) holding period | 7.39% |
| Expected holding period | 13.01 months |
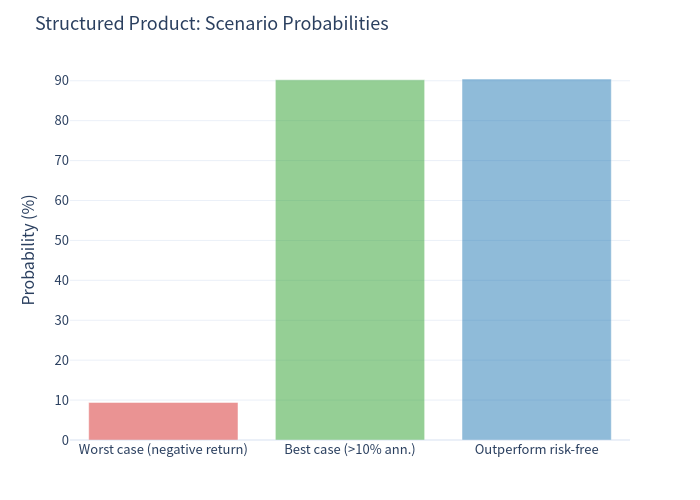
| Probability of a negative return | 9.42% |
| Probability of a capital loss (principal repaid < 100%) | 9.77% |
| 99% confidence VaR (1 year) | -27.07% |
| Probability of outperforming the risk-free rate (2.07%) | 90.44% |
The product delivers a stable ~11% p.a. coupon in the large majority of scenarios (90.23% of paths achieve an annualized return above 10%), but its downside is concentrated: in roughly one path in ten the worst-of basket breaches the 55% barrier and the investor suffers a double-digit capital loss.
2. Basic Product Information
- Type: Yield-enhancement product — Callable Multi Barrier Reverse Convertible (worst-of) with a continuous knock-in barrier.
- Underlyings: AXA SA, ING Groep NV and Münchener Rück (Munich Re) — a worst-of basket of three European financials.
- Coupon: 11.00% p.a., paid quarterly as EUR 27.50 per EUR 1,000 denomination (seven coupon dates over the term).
- Barrier: 55.00% of the initial level, monitored continuously on a worst-of basis (knock-in).
- Callable: the Issuer may redeem early (quarterly, from month 6); on a call the investor receives par plus the coupon of that date.
- Term: up to 21 months (issue 30/09/2026 → redemption 30/06/2028). Currency EUR.
How it works (plain language)
The investor receives an attractive fixed coupon (11% p.a.) for as long as the note is alive. At maturity:
- If none of the three shares ever touches 55% of its starting price, the investor gets the full denomination (100%) back.
- If any share touches 55% at any time (knock-in), the investor only keeps par if the worst-performing share has recovered back to at least its starting level at maturity. Otherwise the investor receives that worst-performing share (in effect a loss proportional to its decline).
- Because the note is callable, the Issuer can redeem it early (paying par + the current coupon) whenever it is economically advantageous — typically when all shares are at or above their starting levels, which truncates the coupon stream.
3. Key Statistics
| Metric (annualized) | Structured Product | Benchmark — equal-weight basket (total return, incl. dividends) |
|---|---|---|
| Expected return | 8.15% | 20.76% |
| Expected volatility | 8.63% | 23.59% |
| Probability of loss | 9.42% | 19.70% |
| 99% VaR (1 year) | -27.07% | -24.41% |
On a price-only basis the equal-weight basket has an expected annualized return of 16.18% and a 99% VaR of -28.99%; adding the ~4.58% average dividend yield lifts the basket's total return as shown above.
Note on annualization: annualized figures use the prescribed per-path method (CAGR for holding periods ≥ 12 months, linear scaling below 12 months). Because about half of the paths terminate before 12 months, annualizing their positive partial returns mechanically lifts the average. On a total (non-annualized) basis over the realised holding period, the basket's price return averages ~8.03% versus the product's 7.39% — i.e. the two are close over an equivalent horizon, and the wide gap between the two annualized means reflects the annualization convention as much as a genuine advantage.
Simulated frequency of outcomes (holding period and coupons)
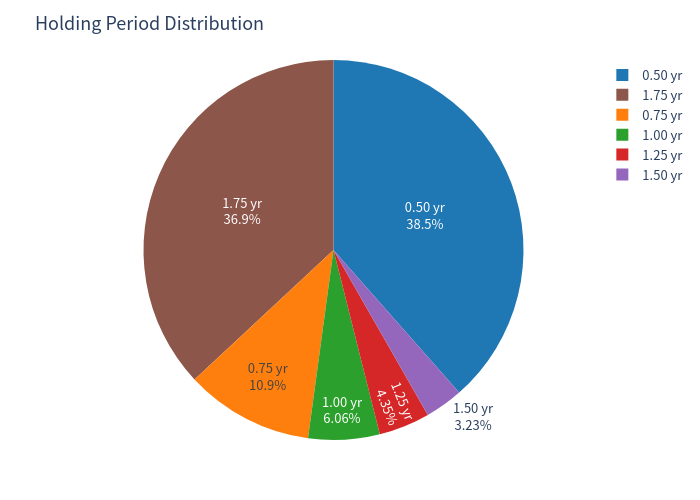
- Held to the 6-month first call: 38.50% of paths
- Held 9 / 12 / 15 / 18 months: 10.92% / 6.06% / 4.35% / 3.23%
- Held to maturity (21 months): 36.94%
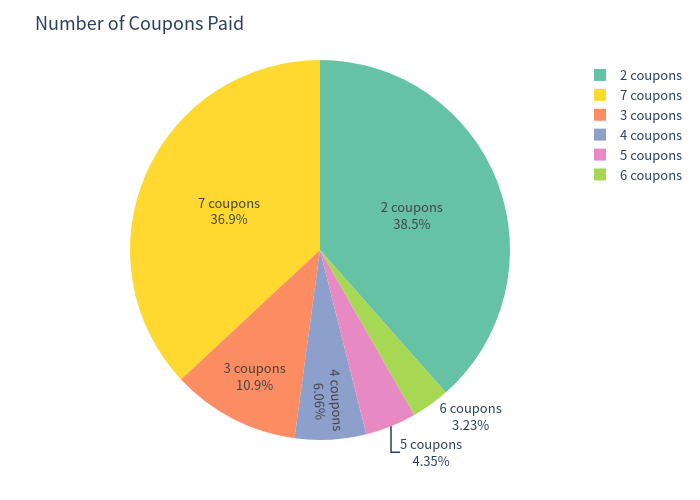
- Coupons received: 2 (38.50%), 3 (10.92%), 4 (6.06%), 5 (4.35%), 6 (3.23%), 7 (36.94%)
- Barrier (knock-in) event triggered in 11.55% of paths
4. Charts
Simulation outcomes — product vs underlying
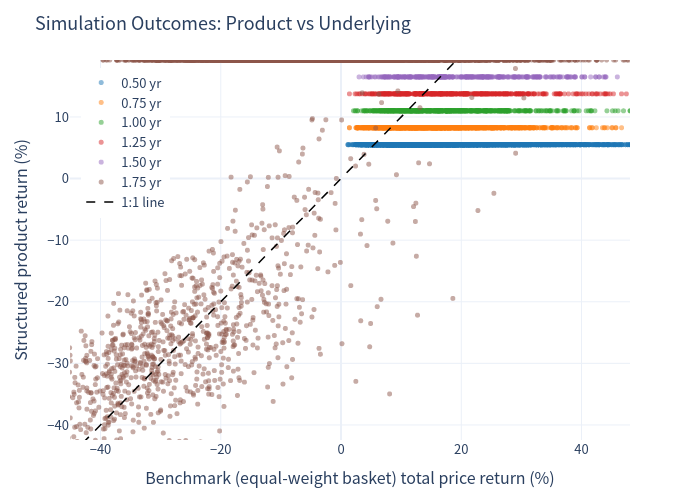
Each point is one simulation; the horizontal axis is the basket's price return at the realised holding date and the vertical axis is the product's return. The capped structure is visible: generous returns cluster around +5% to +19% while the downside tracks (and can underperform) the 1:1 line once the barrier breaks.
Annualized return distributions
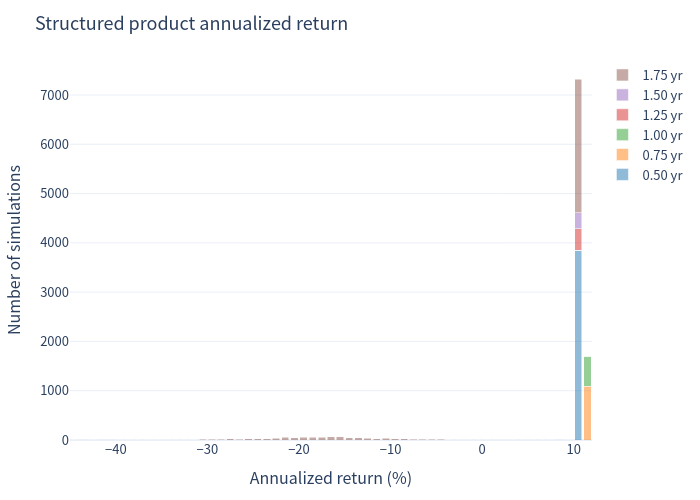
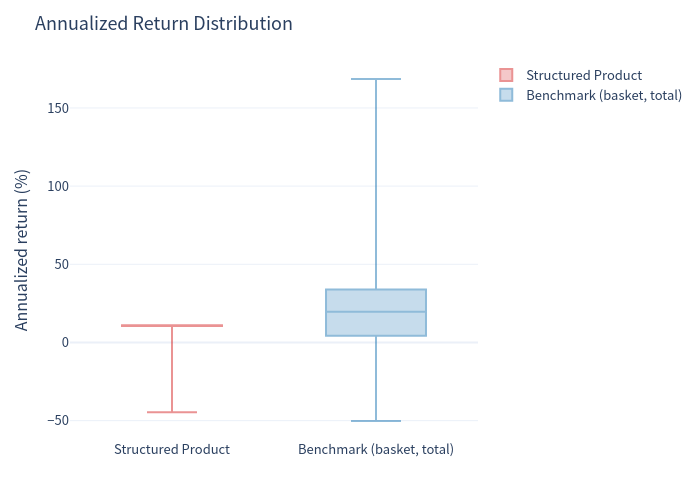
The product's distribution is tightly bunched at ~+10–11% (coupon-driven) with a thin left tail.
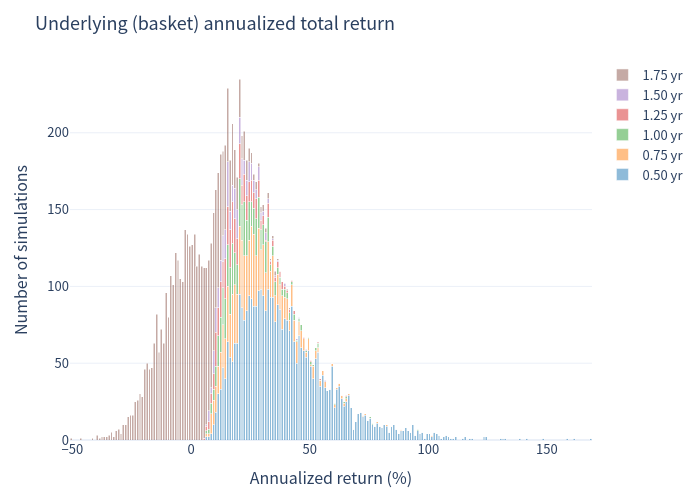
The underlying's distribution is far wider and more symmetric, reflecting full equity risk (the wide right tail reflects annualizing short holding periods).
Scenario probabilities
Risk / return comparison
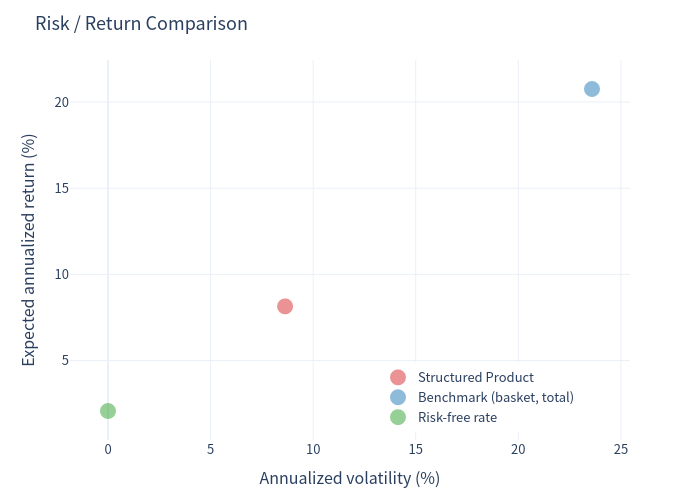
The product sits markedly to the left of the basket — materially lower volatility (8.63% vs 23.59%) but also materially lower expected return, and it carries a comparable-to-worse 99% VaR.
Annualized return box plot
Holding period & coupon count
5. Investment Commentary
Observations (not advice)
- The 11% p.a. coupon is high relative to a EUR risk-free rate of ~2.07% and is paid irrespective of the underlyings' performance while the note is alive.
- Volatility is low (8.63% annualized) versus the underlying basket (23.59%), and ~90% of paths earn more than the risk-free rate.
- The 55% continuous worst-of barrier is the key risk: it triggered in ~11.6% of paths, and because it is a worst-of continuous barrier across three correlated financials, knock-in is more likely than for a single-name barrier. When triggered and the worst share is below its strike at maturity, principal is lost proportionally (99% VaR of -27.07%).
- The callable feature truncates upside participation: with the assumed rational issuer call, ~63% of paths are redeemed early (most at the first call date), so the full 7-coupon stream is only captured about 37% of the time.
- Headline annualized figures are sensitive to the holding-period annualization when paths terminate early; the total return and holding period should be read together.
Material modelling assumptions
- The Issuer call is discretionary (no trigger is specified). It is modelled as "call at the first quarterly observation date on which all three underlyings are at or above 100% of their initial fixing level."
- The contract barrier is continuous; it is approximated by monthly monitoring, which may modestly understate knock-in frequency.
- Simulated drift uses risk-free rate + 6% equity risk premium; dividend yields are added to the benchmark only (no compounding). Fees and commissions are ignored.