
Morgan Stanley MSAMP5 Step-Up Jump Market-Linked CDs — Analysis
Headline Simulation Results
Because the note is principal protected at maturity, the simulated return can never fall below 0% (you always receive at least your $1,000 deposit back). The worst simulated outcome is a 0.00% return (deposit returned), which occurs when the note runs to maturity and the underlier is flat-to-down. There is therefore no negative-return tail and the 1-year 99% VaR is 0%.
How the Product Works (in plain terms)
You deposit $1,000 per CD. The note does not pay periodic interest — all of the return comes from how it terminates:
- Automatic early call (most likely path). Each year, on the annual determination date, the note is checked against a stepped-up call threshold that starts very low and rises over time (101%, 102%, …, 106% of the starting index level). If the underlier is at or above that year's threshold, the note is redeemed early and pays a fixed, pre-set amount that steps up each year — from $1,147.50 in year 1 up to $1,885.00 in year 6. This is equivalent to 14.75% per annum simple. Because the thresholds are only 1–6% above the starting level, the note is very likely to be called early — in the simulation, roughly 72% of the time in year 1 alone.
- Hold to maturity (uncommon path). If the underlier never reaches the low step-up thresholds, the note matures in 2033. At maturity: if the index is up, you receive 100% + the index gain (1:1); if the index is flat or down, you receive your $1,000 deposit back.
There is full principal protection — you do not lose your deposit if the market falls.
Key Statistics: Structured Product vs. Underlying
The underlier (Morgan Stanley Amplitude Index™) is a brand-new, multi-asset, volatility-controlled index (inception Jan 2026) with no usable live history. A broad-market equity index is used as a proxy for the underlier, and its returns are compared over the same horizon as the note in each simulation (i.e., the underlier is measured to the month the note terminates). Dividends are added back to the proxy's return for the total-return comparison.
| Metric | Structured Product | Underlying (total return) |
|---|---|---|
| Expected annualized return | 13.66% | 13.55% |
| Expected annualized volatility | 3.15% | 10.27% |
| Probability of loss | 0.00% | 3.16% |
| 99% confidence VaR (1 year) | 0.00% | −5.37% |
(The benchmark's expected annualized return is elevated because the note is checked against low call thresholds and tends to terminate precisely when the market has risen; measuring the proxy to the same early exit date therefore captures those up-moves. It is not a full-horizon buy-and-hold figure.)
Simulation Charts
Simulation Outcomes — Product vs. Underlying
Each point is one simulation. Dashed line is the 1:1 line; colour shows how long the note was held.
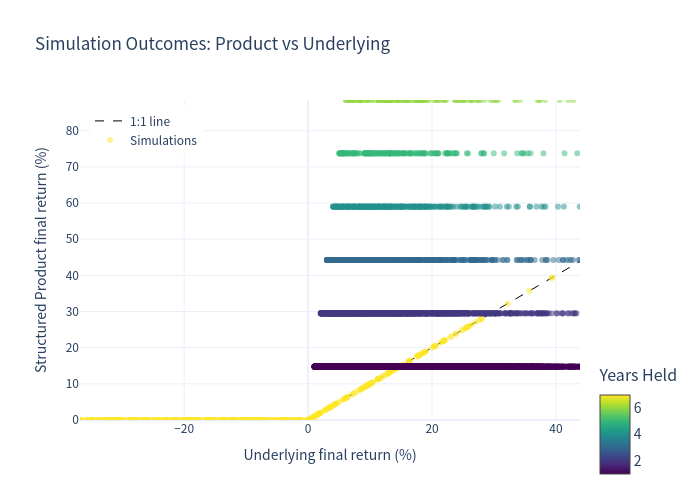
The note's outcomes form horizontal bands at the fixed step-up redemption levels. For underlier gains up to the relevant step-up return (e.g. 14.75% in year 1) the note sits above the 1:1 line; once the underlier rises beyond the call level the note's upside is capped and it sits below the 1:1 line. When the market falls, the note sits above the 1:1 line at a flat ~0% floor. This visually captures the trade-off of the capped, protected structure: enhanced relative outcomes for modest rises and flat markets, but forgone participation on large rallies.
Distribution of Annualized Returns
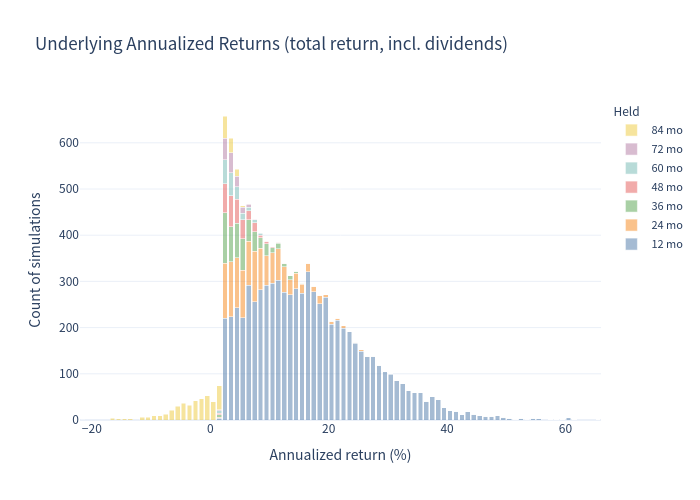
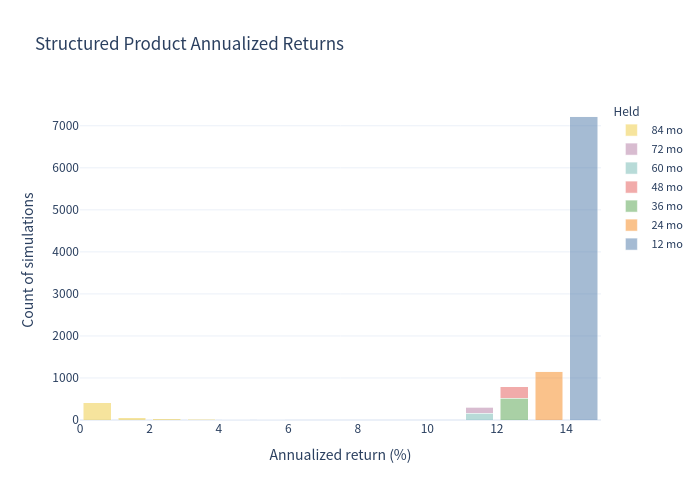
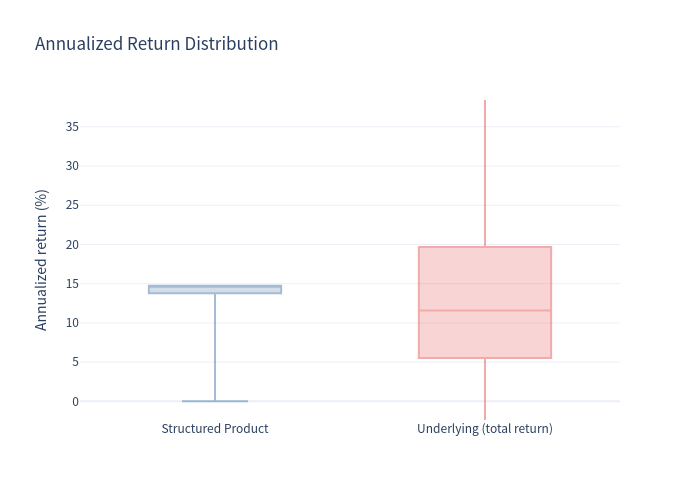
The product's return distribution is tightly concentrated near the year-1 call value (~14.75%), with a small mass at 0% (maturity with no gain). The underlier's distribution is wide (roughly −22% to +66% annualized).
Risk / Return Profile
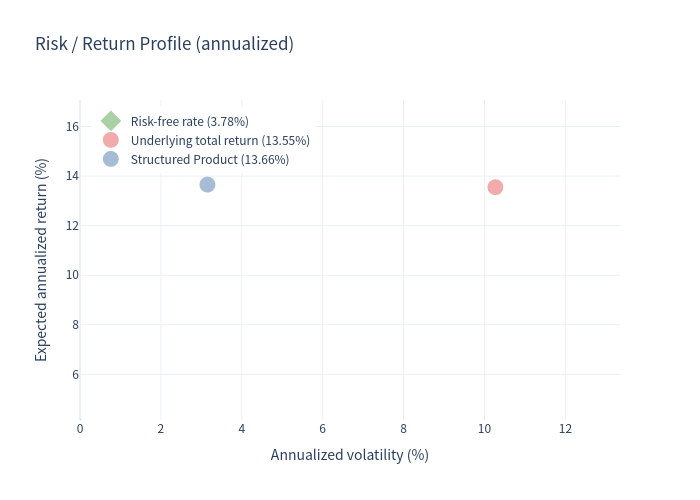
The note plots well to the left (much lower volatility) at a comparable expected return — a favourable risk-adjusted combination relative to the proxy, in the simulated environment.
Annualized Return Distribution (Box Plot)
Scenario Probabilities
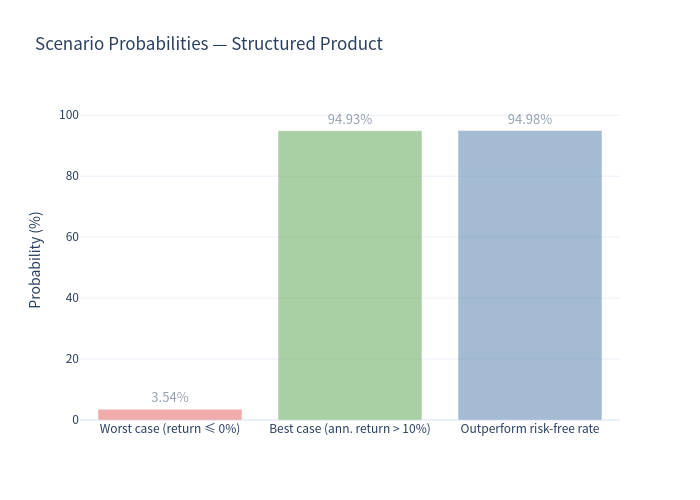
- Worst case (return ≤ 0%): 3.54% — the note simply returns the deposit.
- Best case (annualized return > 10%): 94.93%.
- Outperforms the risk-free rate (3.78%): 94.98%.
Holding Period
Because the note is frequently called early, the time invested varies:
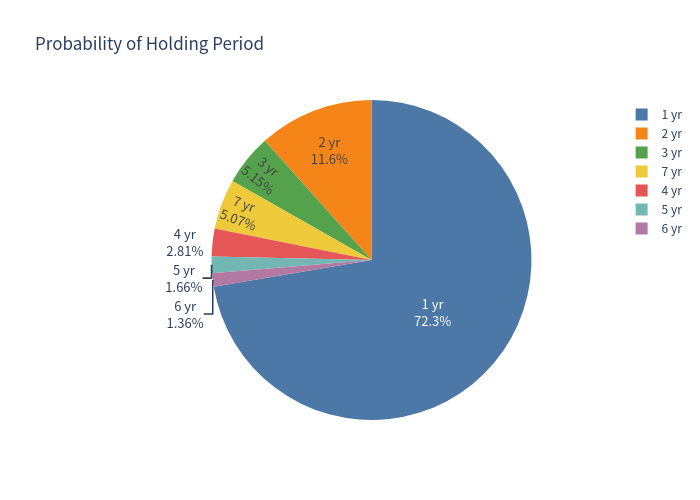
Roughly 72% of paths terminate after 1 year, ~12% after 2 years, and only ~5% run the full 7 years to maturity.
Investment Commentary
Points in favour
- Capital protection. At maturity the deposit is returned in full even if the underlier is down sharply; the simulated downside is floored at 0%.
- Attractive conditional yield. If called, the stepped-up redemption equates to a 14.75% per-annum return — high relative to cash/deposit rates — and the low call thresholds make early redemption the dominant outcome (≈95% called).
- Very low return volatility. Early redemption at pre-set levels produces a narrow distribution of outcomes (~3% annualized volatility), smoothing the ride versus a direct investment in the market.
- Frequent, rapid monetisation. Median outcome is a one-year holding period with a mid-teens return.
Points to weigh
- Effectively capped upside. Once the note is called, participation stops at the fixed step-up payment; a strongly rising market would leave money on the table because the thresholds are so low (just 1–6% above start).
- Reinvestment / call risk. With ~72% of paths redeemed after only one year, the investor faces early re-investment risk if rates or markets move.
- Path dependency. Reaching maturity requires the underlier to stay below the low annual thresholds and then finish positive to earn 1:1 upside; otherwise the maturity outcome is simply the deposit back.
- New, proprietary underlier. The Amplitude Index launched in early 2026 with essentially no live track record, and a broad-market proxy was required for this analysis.
- Issuer / credit risk and cost drag. The note carries the issuer's credit risk, and the issuer's own estimated value ($884.40 vs. the $1,000 deposit) is well below par, reflecting embedded costs.
- Not a liquid instrument. The note is designed to be held; there is no early withdrawal right (other than death/incompetence exceptions).
All figures are simulation-based estimates derived from historical proxy data and stated assumptions, are expressed in annualized percentage terms, and are not guarantees of future performance. This document is an analysis of the security's mechanics and simulated risk/return profile only; it is not investment advice or a suitability assessment.