
14.00% p.a. Multi Barrier Reverse Convertible — Investment Analysis
Underlyings: Allianz SE, Commerzbank AG, Münchener Rück (Munich Re), Société Générale · Currency: EUR · ISIN: CH1555868574
1. Headline Simulation Results
Based on 10,000 Monte-Carlo simulations over the note's life (Oct 2026 – Jul 2028):
| Metric | Result |
|---|---|
| Expected annualised return | 9.00% |
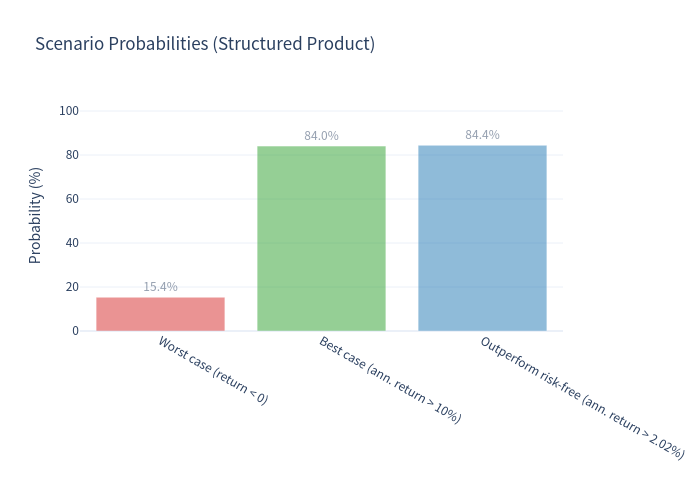
| Probability of a negative return | 15.37% |
| 99% confidence VaR (1 year) | –27.51% |
| Expected total return over the (variable) holding period | 9.31% |
| Expected holding period | 14.83 months (≈ 1.24 years) |
The note pays a 14.00% p.a. coupon (3.50% per quarter) and, in ~85% of simulated scenarios, delivers a positive (typically coupon-like) outcome. The expected return sits below the headline coupon because in the remaining scenarios investors can take a capital loss on the underlying shares.
2. Product at a Glance
| Feature | Detail |
|---|---|
| Type | Yield-enhancement Multi Barrier Reverse Convertible (SSPA 1230), issuer-callable |
| Coupon | 14.00% p.a., paid quarterly (EUR 35 per EUR 1,000 = 3.50 pts) |
| Barrier | 49% of initial level, continuously observed for the whole life |
| Strike / Initial level | 100% / 100% |
| Underlying linkage | Worst-of four European financial stocks |
| Term | ≈ 21 months (to 19/07/2028) |
| Issuer | Basler Kantonalbank (S&P AA+, Fitch AAA) |
How It Works (plain English)
- You are paid a high fixed coupon every quarter as long as you hold the note.
- If none of the four shares ever trades at or below 49% of its starting price, you receive your full EUR 1,000 back at maturity — on top of all coupons.
- If any share falls to 49% or below at any time the barrier is "knocked in". At maturity you then receive the worst-performing share (or its cash value) if it is at/below its starting level — i.e. you share in that share's losses. If the worst performer is still above its starting level, you get your full EUR 1,000.
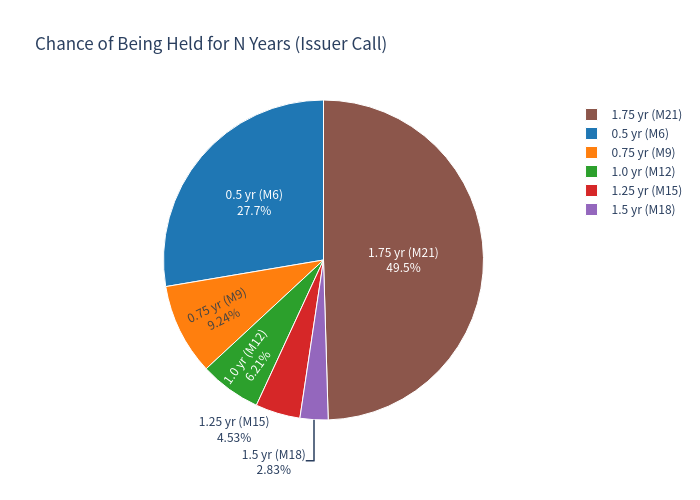
- The issuer may call the note early on any quarterly observation date, paying EUR 1,000 plus that quarter's coupon. Because the issuer calls when it suits them, the note is most likely to be redeemed early precisely when the shares are doing well.
3. Key Statistics — Structured Product vs Underlying Basket
The benchmark is an equal-weight basket of the four underlyings (total return, i.e. price return + dividend yield of 3.47%). Returns are annualised on each simulation's own holding period.
| Metric | Structured Product | Underlying Basket (total return) | EUR Risk-free |
|---|---|---|---|
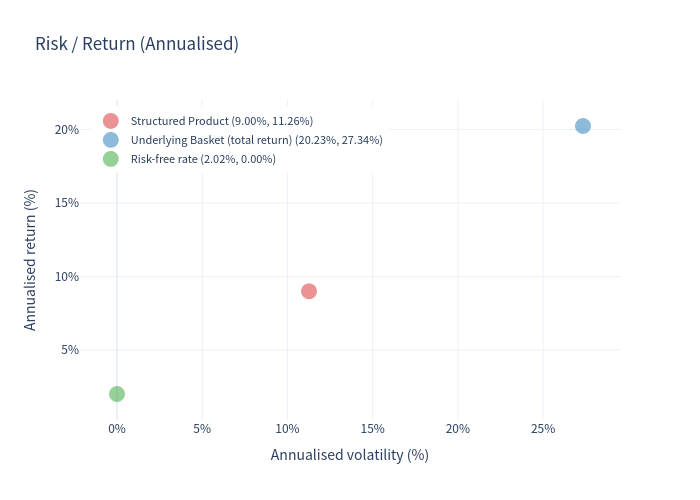
| Expected annualised return | 9.00% | 20.23% | 2.02% |
| Expected annualised volatility | 11.26% | 27.34% | 0.00% |
| Probability of loss (total return < 0) | 15.37% | 31.11% | – |
| 99% confidence VaR (1 year) | –27.51% | –26.78% | – |
Behaviour of the two return streams
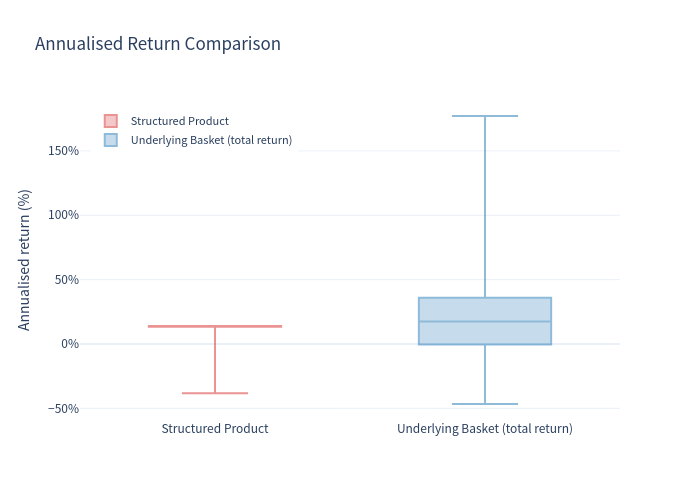
- The product returns roughly the coupon (≈ 13.5–14% annualised) in the large majority of paths, with a left tail of losses when the barrier is breached (worst simulated annualised return ≈ –38%; worst total return ≈ –57%). Its return distribution is therefore bimodal and capped.
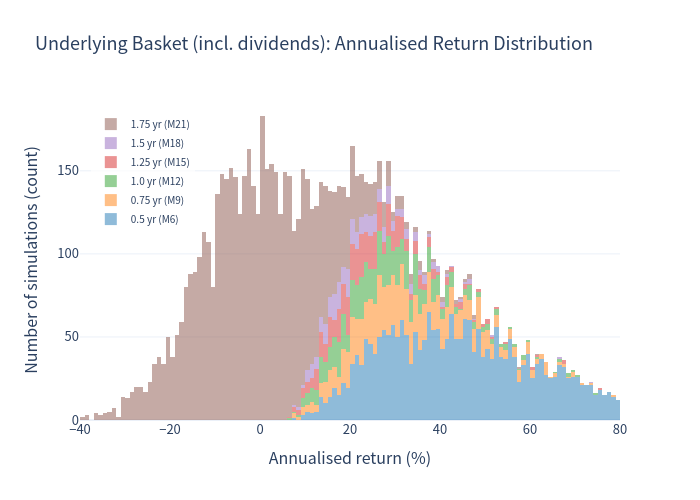
- The basket has a wide, roughly bell-shaped distribution (5th–95th percentile ≈ –16% to +70%) and captures full equity upside — but with ~2.5× the volatility and roughly double the probability of a loss.
4. Simulation Charts
Outcomes: product vs underlying (coloured by holding period)
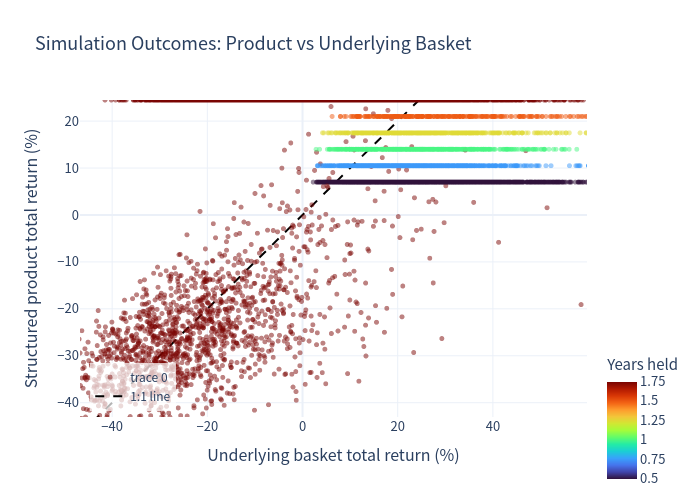
Points above the dashed 1:1 line are scenarios where the note beats the basket; the colour shows how long the note was held. Note the capped upside (+24.5% total) versus the basket's wide spread.
Annualised return distribution — underlying basket (incl. dividends)
Annualised return distribution — structured product
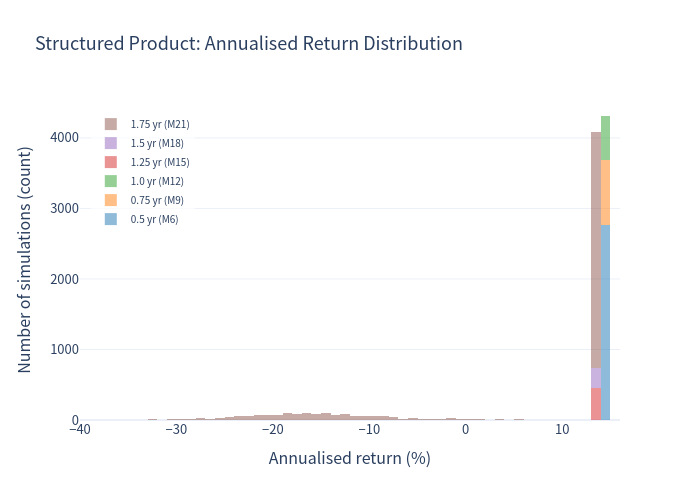
The product's distribution is concentrated near the coupon (≈ 13.5–14% annualised), with a separate loss tail.
Risk / return
Annualised return comparison (box plot)
Scenario probabilities
Likely holding period (issuer call)
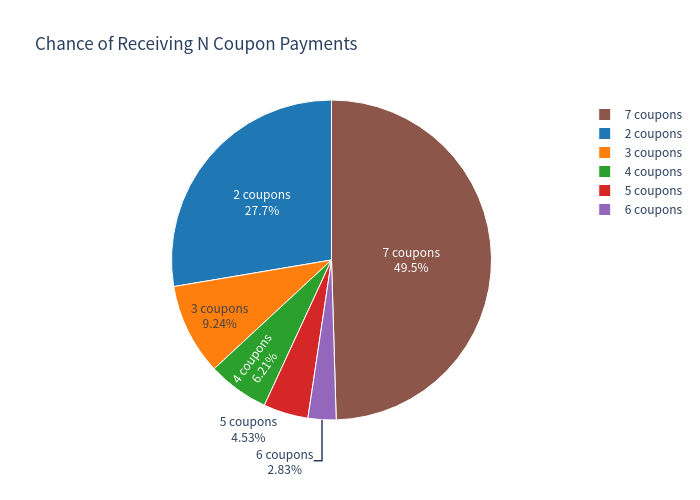
Number of coupons received
5. Investment Commentary
Positive points
- Attractive income: a 14.00% p.a. coupon versus a EUR cash/risk-free rate of ≈ 2% — a large yield pick-up.
- Deep protection level: the 49% barrier leaves a ~51% cushion before the downside kicks in; the barrier was breached in only ≈ 17% of simulated paths.
- High probability of a positive outcome: ~84% of simulations return a coupon-like positive result, and the expected volatility of the note (≈ 11%) is far below that of the shares (≈ 27%).
- No worse than the shares in a really bad scenario at the barrier: losses only materialise if the barrier is breached and the worst share finishes below its start.
Points to be aware of
- Worst-of structure: the payoff depends on the weakest of four financial names, so the effective risk is higher than for any single share — the four companies are also in the same (financials) sector and correlated.
- Capital at risk: if the barrier is breached and the worst share ends ≤ its start, you receive shares (or cash) worth less than EUR 1,000 — the worst simulated outcome lost ≈ 57% in total.
- Capped upside: you never participate in a rally beyond the fixed coupon.
- Issuer call / reinvestment risk: the note is likely to be redeemed early when the shares perform well (~50% of paths), truncating the coupon stream.
- Issuer credit risk: repayment depends on Basler Kantonalbank.
6. Key Assumptions
- The Issuer's discretionary call is modelled as being exercised at the first quarterly observation date on which the worst of the four shares is at/above its initial level (all four ≥ 100%). Removing the call changes the expected annualised return only marginally (≈ 8.3% vs 9.0%).
- The 49% barrier is continuously observed; a standard continuity adjustment is applied to the monthly simulation grid.
- Dividend yields are added to underlying returns without compounding; all figures assume no transaction costs, fees or taxes.
This is a quantitative simulation study for information purposes only and does not constitute investment advice or a suitability assessment.