
8.60% p.a. Multi Barrier Reverse Convertible on ABB, Novartis & Roche — Simulation Analysis
Headline Simulation Results
Basic Product Information
| Attribute | Detail |
|---|---|
| Product type | Yield-enhancement product (SSPA Type 1230) — Multi Barrier Reverse Convertible, issuer callable |
| Underlyings | ABB Ltd, Novartis AG, Roche Holding (three Swiss equities, CHF) |
| Currency / Denomination | CHF / CHF 1,000 (issue price 100%) |
| Coupon | 8.60% p.a., paid quarterly (CHF 21.50 per quarter per product; 2.15 index points) |
| Term | 2 years (issue 24/08/2026 → maturity 24/08/2028) |
| Barrier | 59% of initial fixing level, continuous observation over the full term |
| Strike | 100% of initial fixing level (maturity) |
| Early redemption | Issuer callable on four quarterly observation dates from month 12 onward |
How it works (layman explanation)
The investor receives a fixed quarterly coupon of CHF 21.50 per CHF 1,000 — regardless of how the three Swiss stocks perform. This coupon is paid in any case, including on an early redemption date.
The issuer has the right to call the product early on quarterly observation dates starting one year after issue. If called, the investor receives the CHF 1,000 denomination back plus the coupon for that date, and the product ends.
If the product runs to maturity and no barrier event has occurred (i.e., none of the three stocks ever traded at or below 59% of its initial level), the investor receives the full CHF 1,000 back plus the final coupon — a fully positive outcome.
If a barrier event did occur (any stock fell to/below 59% of its initial level at any point during the term), the repayment at maturity depends on the worst-performing stock:
- If the worst stock finishes at or above its initial level (100%), the investor receives the full CHF 1,000 back plus the final coupon.
- If the worst stock finishes below its initial level, the investor receives that stock's shares instead of cash (physical delivery), so the principal is exposed to the downside of the worst performer — this is the main loss scenario.
In short: the investor sells a deep out-of-the-money "worst-of" put option on the three stocks in exchange for a high fixed coupon, with the issuer holding the right to redeem early.
Key Statistics — Structured Product vs Underlying
| Metric (annualized) | Structured Product | Underlying Basket* |
|---|---|---|
| Expected annualized return | 4.87% | 8.35% |
| Expected annualized volatility | 8.41% | 13.13% |
| Probability of loss | 15.92% | 34.83% |
| VaR 99% (1-year) | -23.60% | -16.83% |
Simulation Outcome Charts
Scatter Plot — Product vs Underlying Return per Simulation
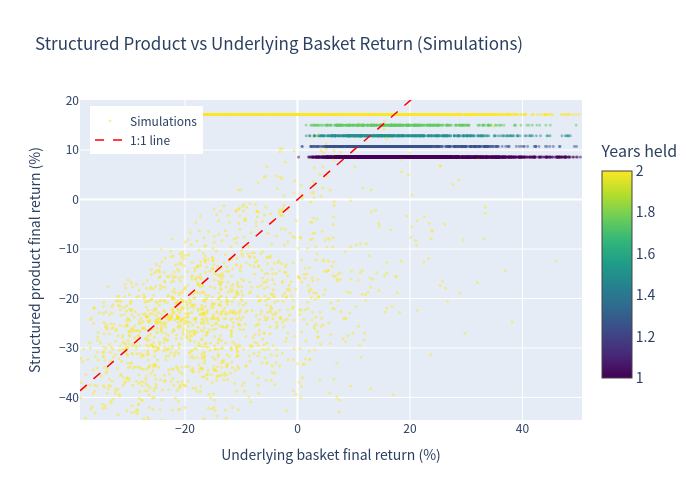
Each dot is one simulated path. The horizontal axis shows the final return of the equal-weight underlying basket (price index), the vertical axis the final return of the structured product. The dashed 1:1 line marks where both returns are equal; points to the left of it represent paths where the structured product cushioned the downside, while points clustered on the upper band reflect the capped (coupon-only) upside. Color indicates how many years the product was held.
Histograms of Annualized Returns
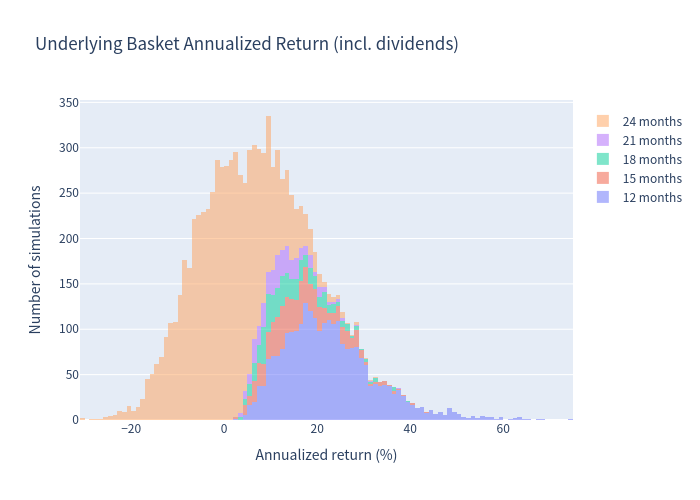
Underlying basket — annualized total returns.
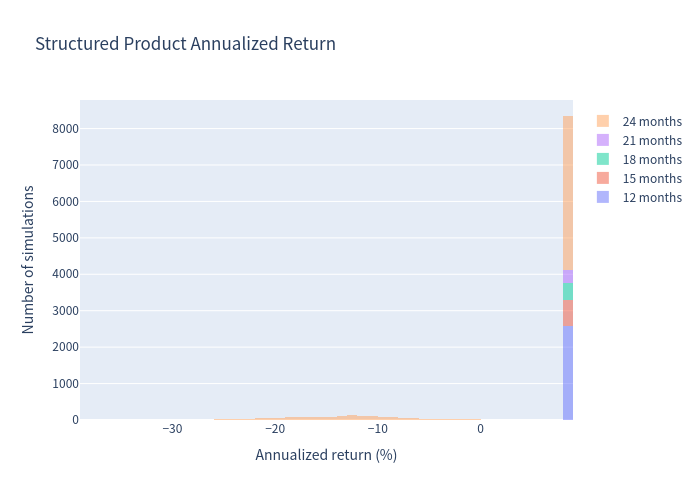
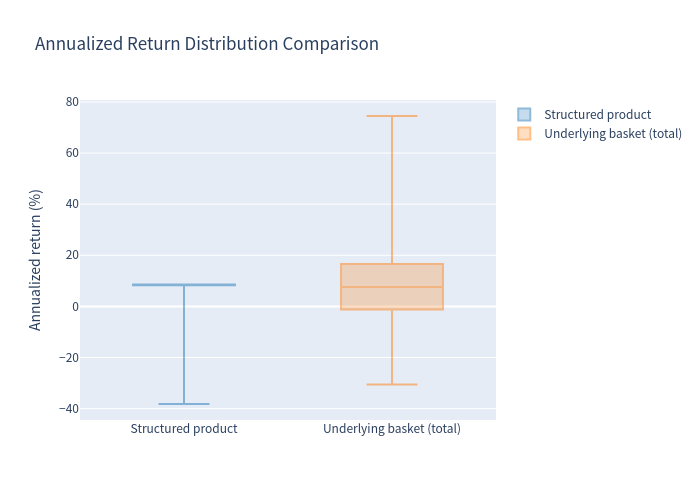
The underlying basket's returns are spread widely (roughly -30% to +45% across the central range), whereas the structured product's returns are concentrated in a narrow band around +8% with a left tail representing the barrier/physical-delivery scenarios. Bar colors indicate the holding period in months.
Scenario Probabilities
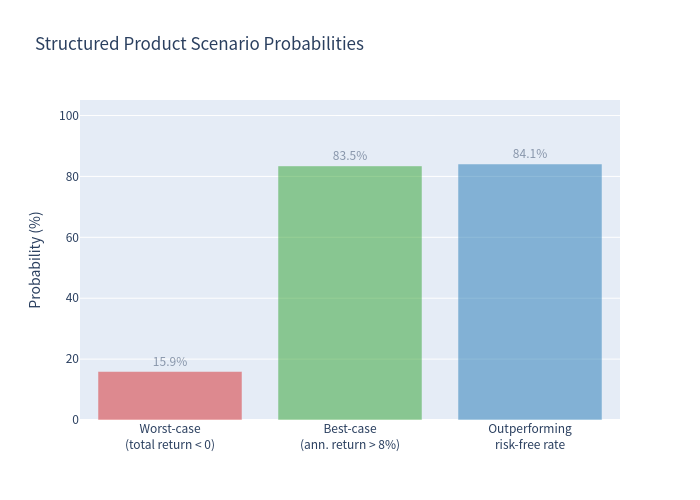
- 15.92% chance of a negative total return (worst case)
- 83.45% chance of an annualized return above 8% (near the maximum achievable coupon return; the product caps upside at ~8.60% annualized)
- 84.08% chance of outperforming the CHF risk-free rate
Risk / Return Profile
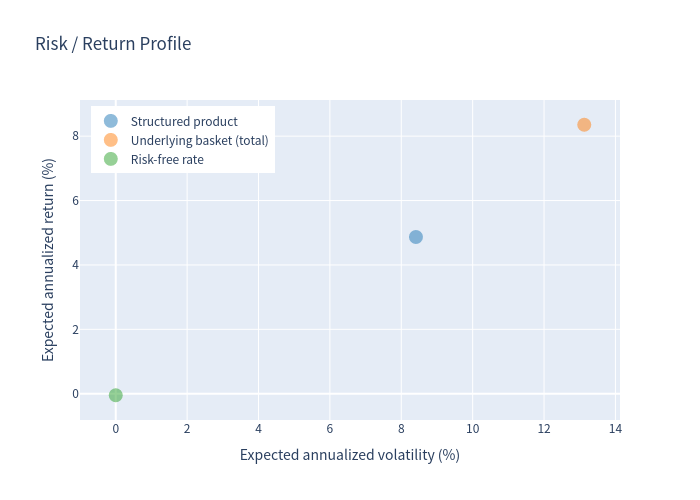
The structured product sits between the risk-free rate and the full equity basket: higher expected return than cash, but lower expected return and volatility than a direct equity investment.
Return Distribution Comparison
Holding Period & Coupon Outcomes
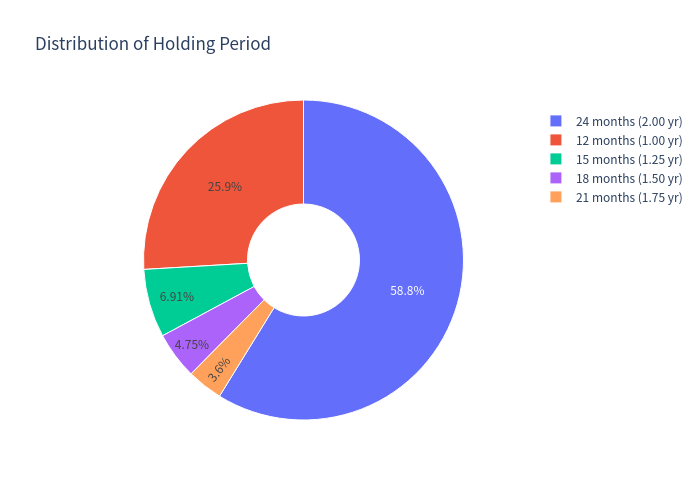
Distribution of realized holding periods across simulated paths.
- The product is called early by the issuer in 41.20% of simulated paths (25.94% at month 12, 6.91% at month 15, 4.75% at month 18, 3.60% at month 21); it runs to full 24-month maturity in 58.80% of paths.
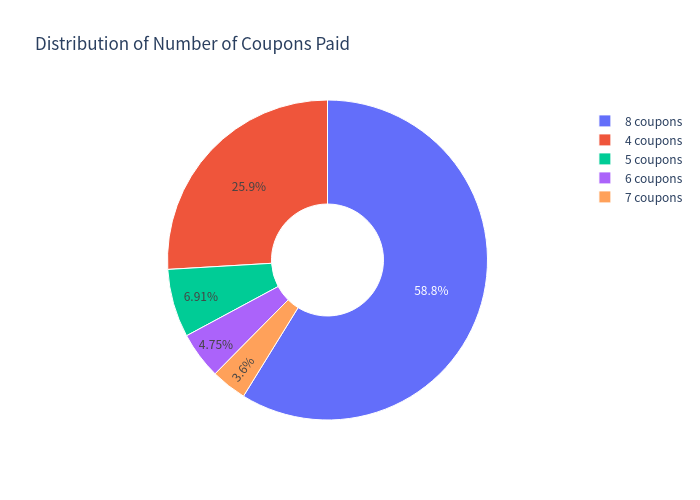
- Investors receive between 4 and 8 quarterly coupons: 4 coupons in 25.94% of paths, 5 in 6.91%, 6 in 4.75%, 7 in 3.60%, and all 8 coupons in 58.80% of paths.
- Expected number of coupons received: 6.62 (≈14.24 index points of coupon income).
Investment Commentary
Positive features worth highlighting
- High running income: 8.60% p.a. coupon (2.15% per quarter), paid regardless of underlying performance and even when the product is called early.
- Deep conditional protection: the barrier is set at 59% of initial fixing — a stock must fall more than 41% before the principal-protection feature is removed; a barrier event occurs in only ~17% of simulated scenarios.
- Reduced volatility and loss frequency relative to a direct equity investment: probability of loss is cut roughly in half (15.92% vs 34.83%), with much lower return volatility (8.41% vs 13.13%).
- Frequent, certain cash flows with a high probability (83–84%) of achieving near-maximum returns or beating the CHF cash rate.
Key risk characteristics (factual)
- Upside is capped at the coupon; the investor does not participate in stock appreciation.
- In the barrier/physical-delivery scenario the investor receives the worst-performing stock, which can produce significant capital losses (the 1% tail is below -23% annualized).
- The issuer call feature means the product may be redeemed early (41.20% of paths), shortening the period over which the high coupon is received.