
Investment Analysis — 15.60% p.a. Callable Multi Barrier Reverse Convertible
1) Headline Simulation Results
| Metric | Result |
|---|---|
| Expected annualized return | 10.20% |
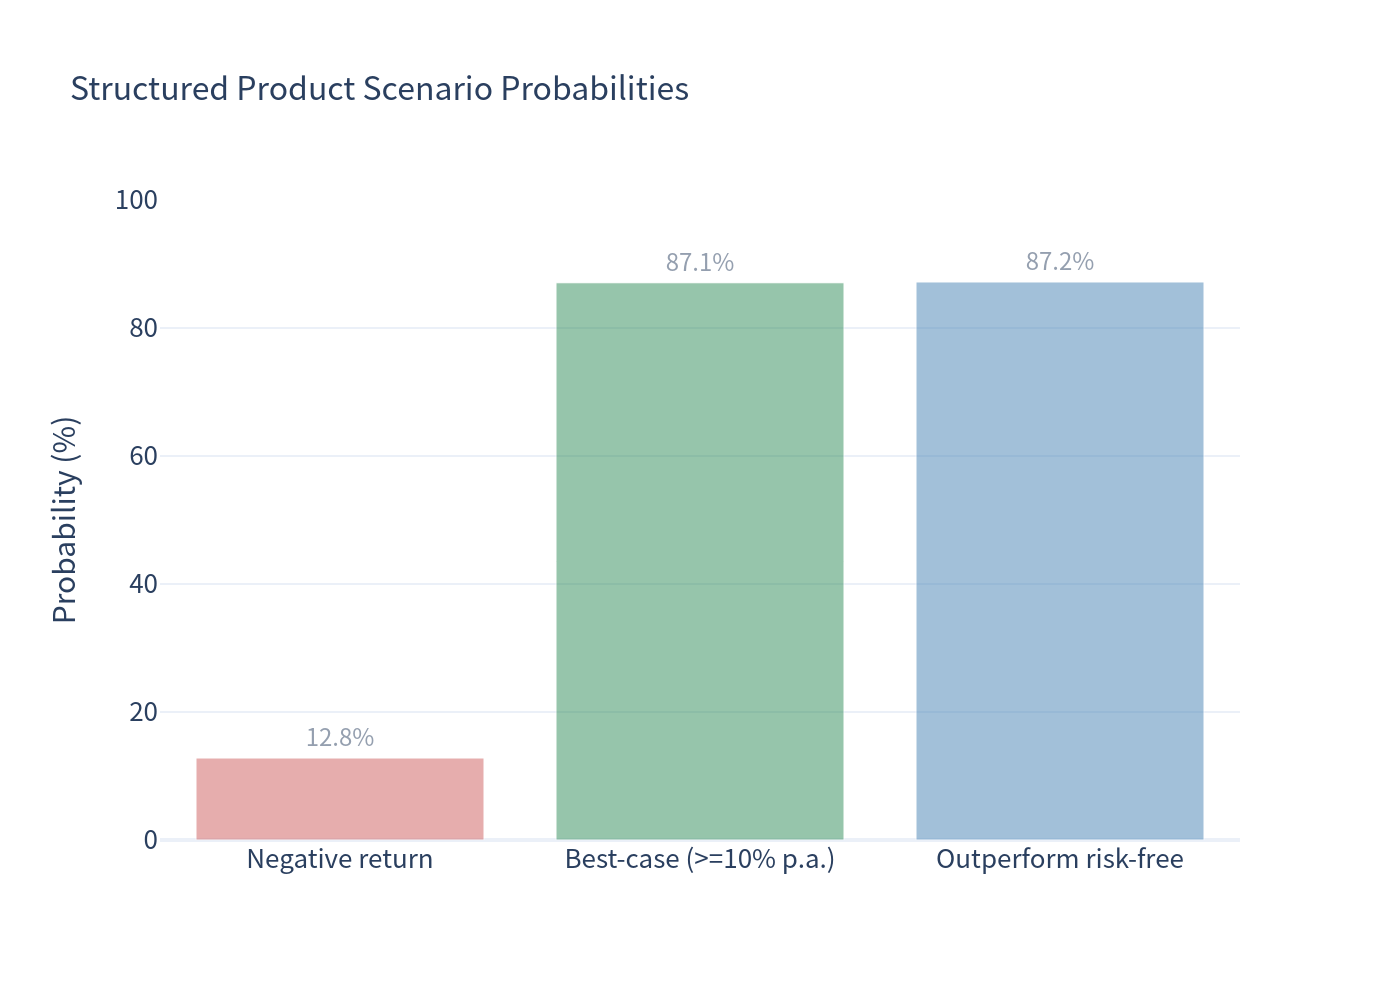
| Probability of a negative return | 12.81% |
| 99% confidence VaR (1 year) | −39.49% |
| Expected holding period | 10.6 months |
| Expected total return over the realized holding period | 8.39% |
| Probability of outperforming the risk-free rate (~0%) | 87.19% |
A 10,000-path simulation of the product mechanics shows a high probability (≈87%) that the investor collects the full coupon stream and par, offset by a ≈13% chance of a barrier breach that can produce a double-digit capital loss. Because coupons and adverse worst-of outcomes are both concentrated at maturity, the return distribution is strongly bimodal — most outcomes cluster near the maximum 15.60% annualized (coupon only), with a thin but severe left tail.
2) Product Overview — How It Works
This is a yield-enhancement note (SSPA 1230). In plain terms:
- You invest CHF 1,000 (par = 100%) for a maximum of one year and receive a 15.60% p.a. coupon paid quarterly (CHF 39.00 every quarter, four times: 28-Jan-2027, 28-Apr-2027, 28-Jul-2027, 27-Oct-2027). The coupons are paid unconditionally at each coupon date (subject only to the note not being called early) — they are paid even if the barrier is breached and capital is lost.
- The three shares (Burkhalter, Implenia, R&S Group) only matter if things go wrong. As long as none of them ever trades at or below 59% of its starting price (monitored continuously), you get your CHF 1,000 back at maturity plus all coupons.
- If any one share breaches its 59% barrier and finishes below its starting level, you take the loss on that worst-performing share — you receive that share (or its cash value ≈ its final level as a % of start), so your capital return is reduced proportionally.
- The issuer can call the note early on 28-Apr-2027 or 28-Jul-2027; if it does, you receive par plus that quarter's coupon and the note ends.
- Upside is capped at par — you do not benefit from any share rally beyond the coupons.
3) Key Statistics
| Metric | Structured Product | Underlying (equal-weight basket, incl. dividends) |
|---|---|---|
| Expected annualized return | 10.20% | 12.14% |
| Expected annualized volatility | 14.43% | 24.11% |
| Probability of loss | 12.81% | 34.37% |
| 99% confidence VaR (1 year) | −39.49% | −28.70% |
| Risk-free rate (CHF, ≈0%) | 0.00% | 0.00% |
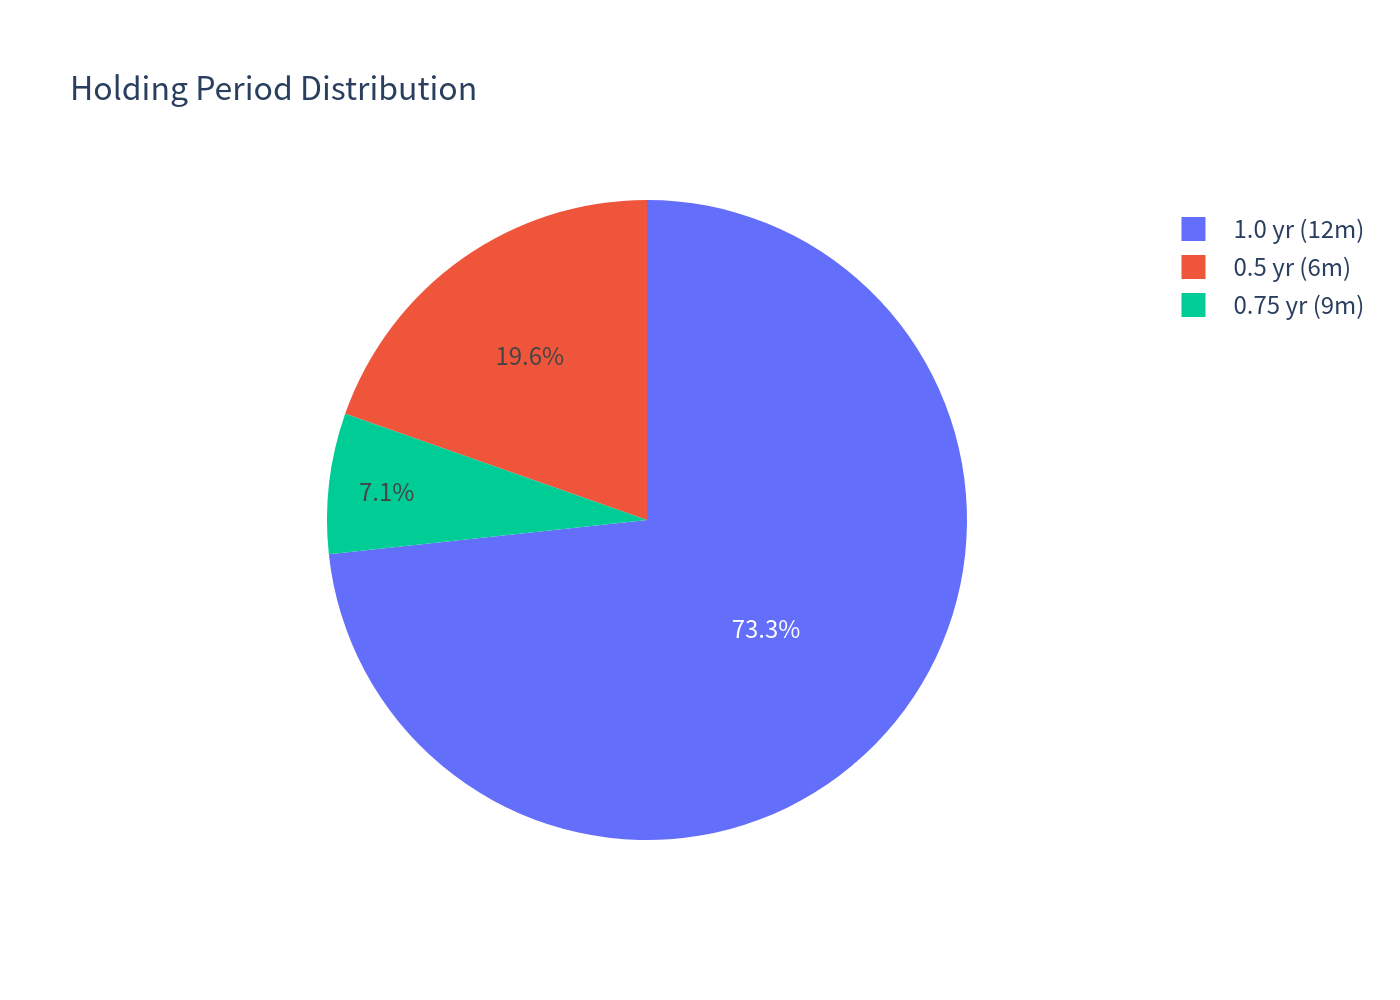
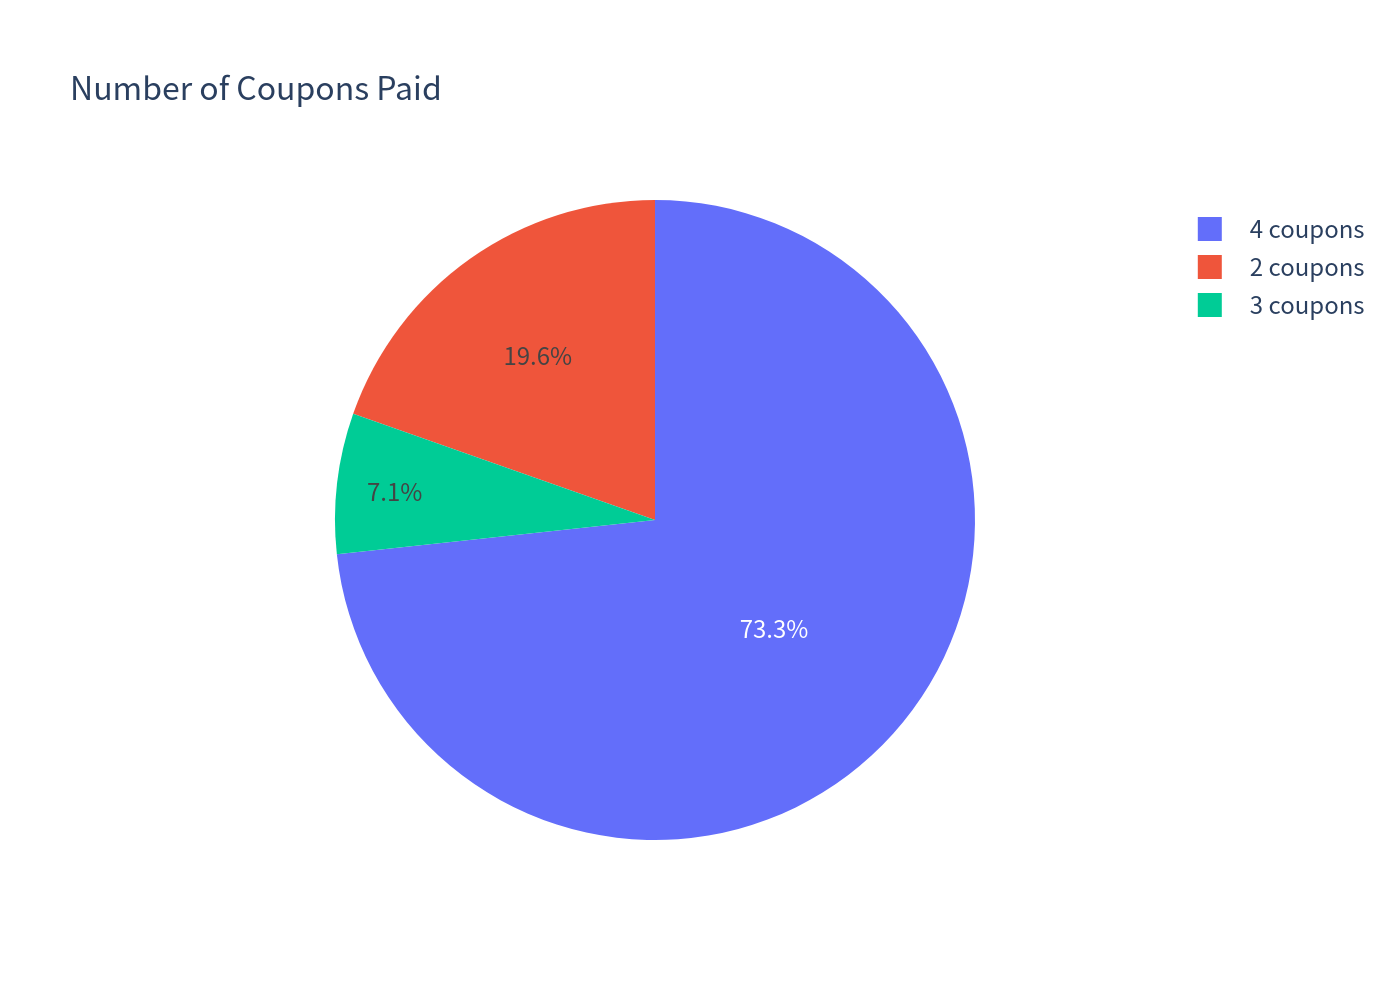
Simulation composition: the note reaches maturity in ~73% of paths, is called at month 9 in ~7%, and at month 6 in ~20%. The barrier is breached in ≈13% of paths. Coupons paid: 4 coupons in ~73% of paths, 3 in ~7%, 2 in ~20%.
4) Charts
4.1 Simulation Outcomes (Product vs Underlying)
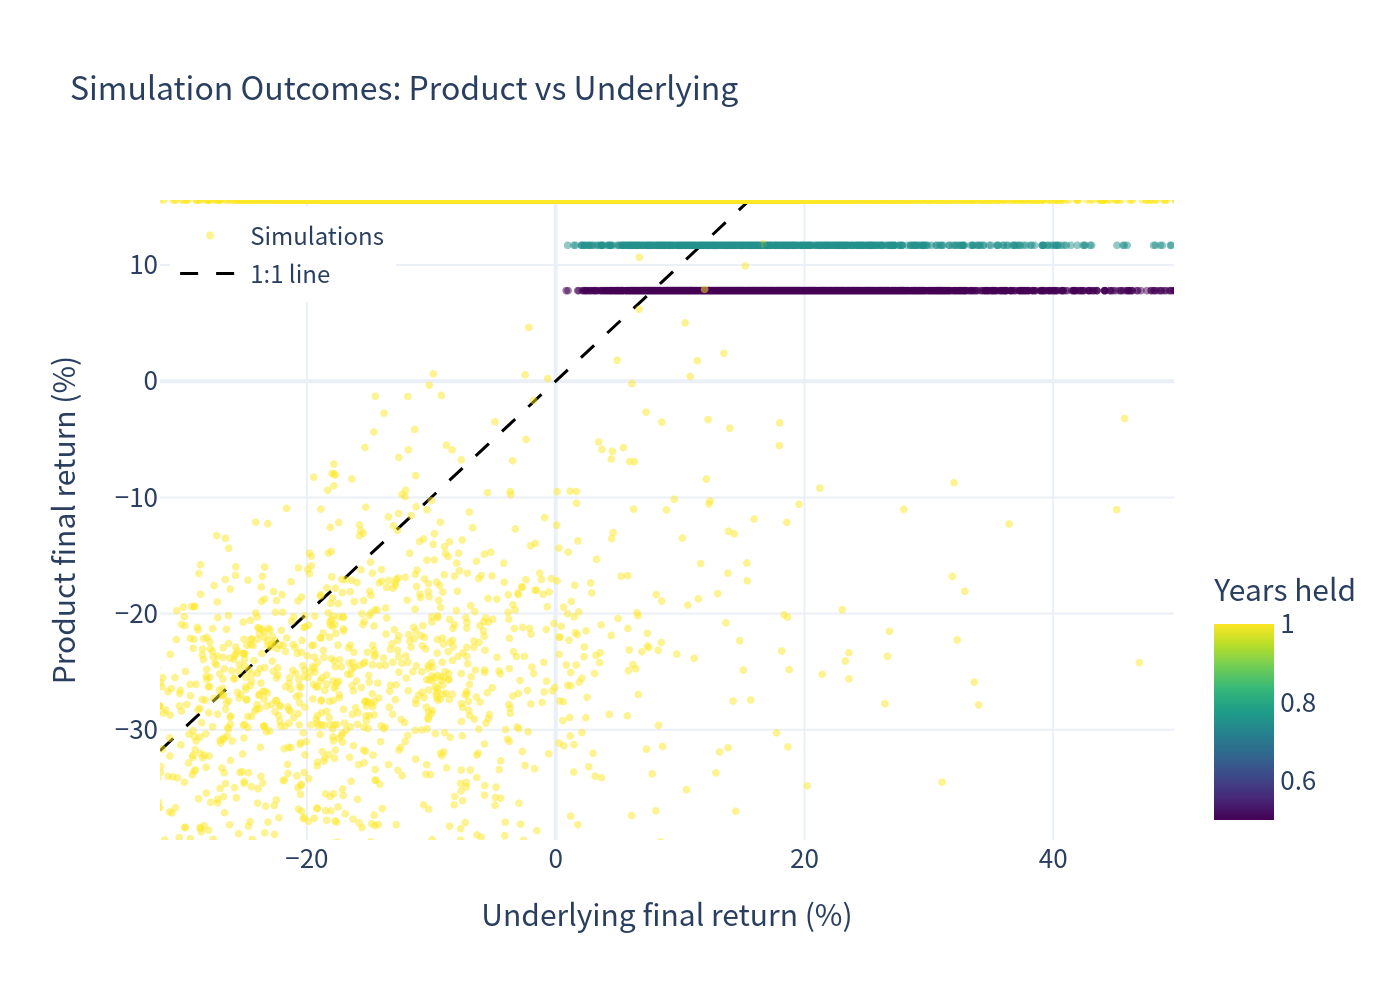
Each point is one simulation (colour = years held). The product's returns are capped at +15.6% on the upside (flat ceiling in the plot), yet follow the underlying one-for-one on large down moves once the barrier is breached — the classic capped-upside / worst-of-downside reverse-convertible profile. The 1:1 line shows the underlying; points below the ceiling and to the right of the line highlight scenarios where the underlying rose but the product was capped.
4.2 Annualized Return Histograms
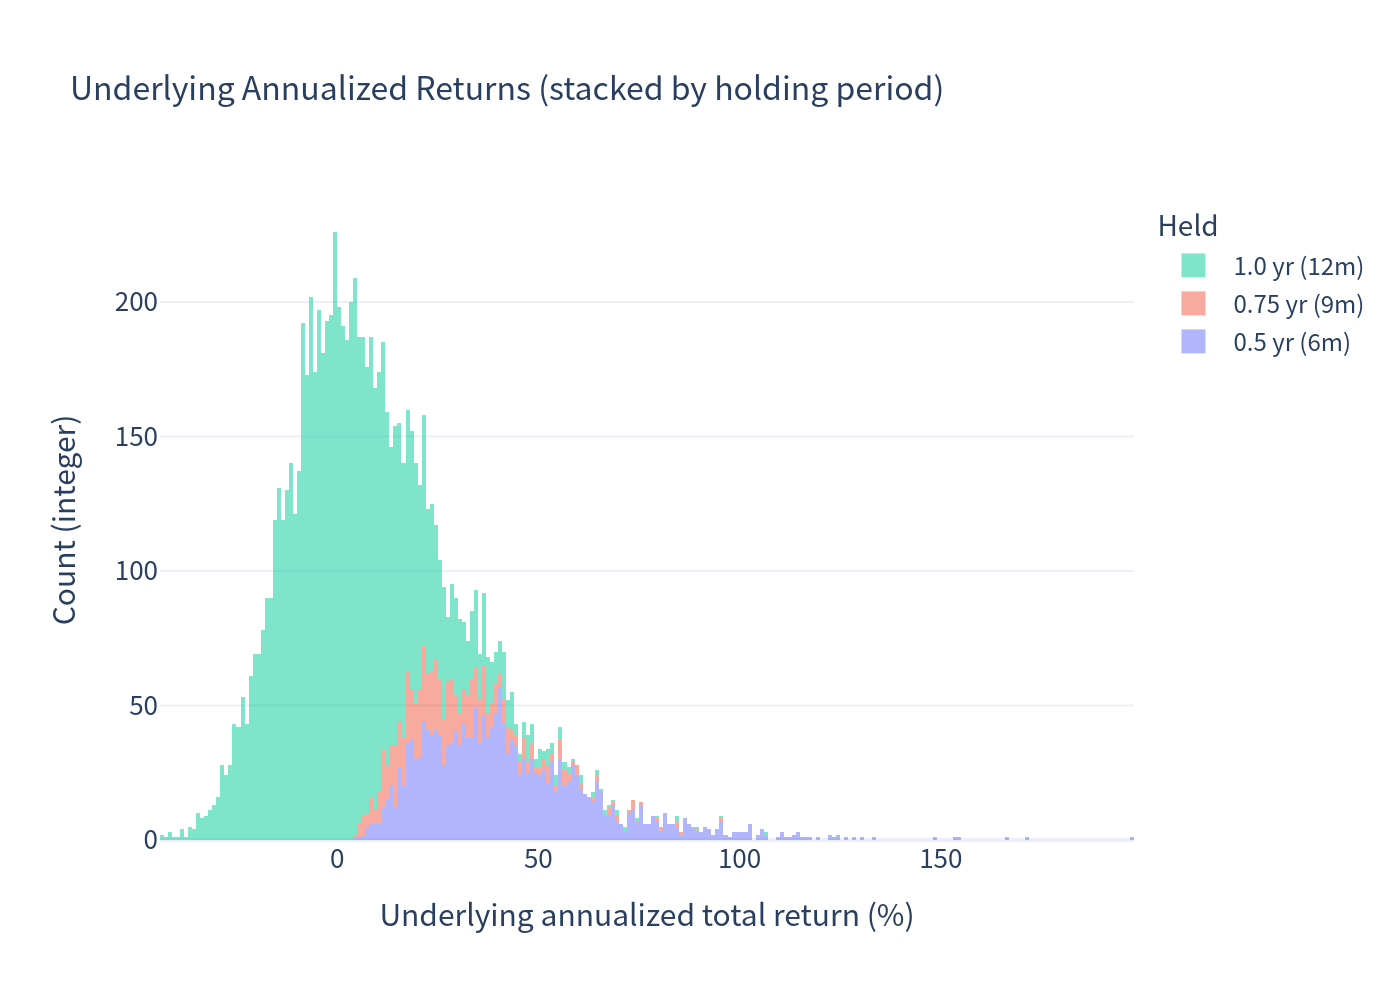
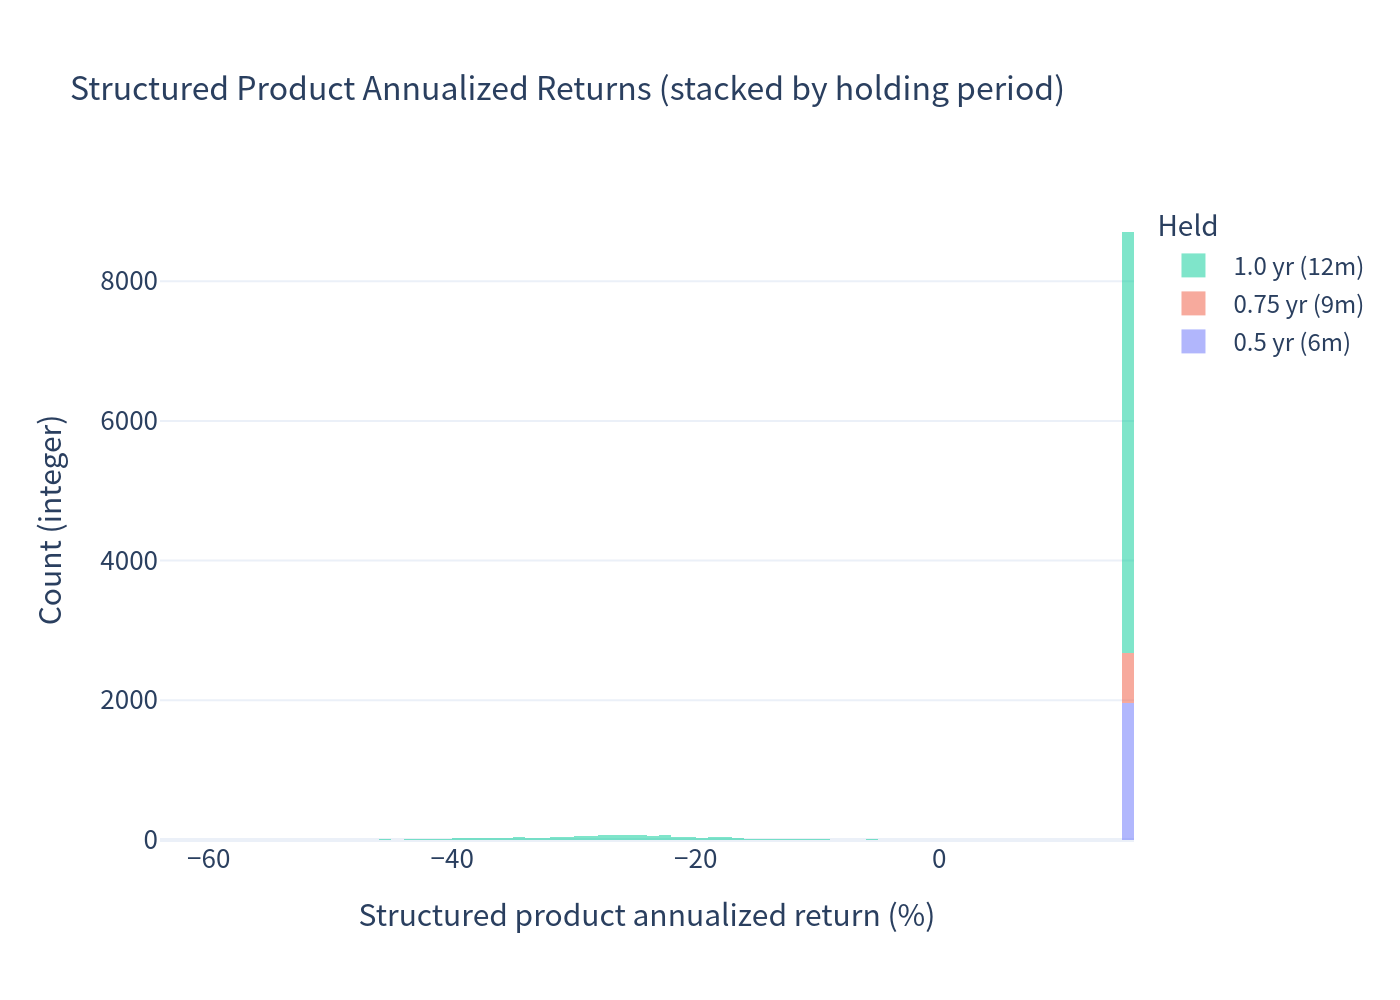
The product's distribution is a sharp spike at the 15.6% coupon plus a left tail of losses, whereas the underlying basket's distribution is wide and roughly centred, with a long right tail driven by the linear annualization of strong short-horizon moves. Stacked colours show the holding period: the tall coupon spike mixes 6-month, 9-month and 12-month redemptions that all land at the same 15.6% annualized coupon.
4.3 Risk / Return Profile
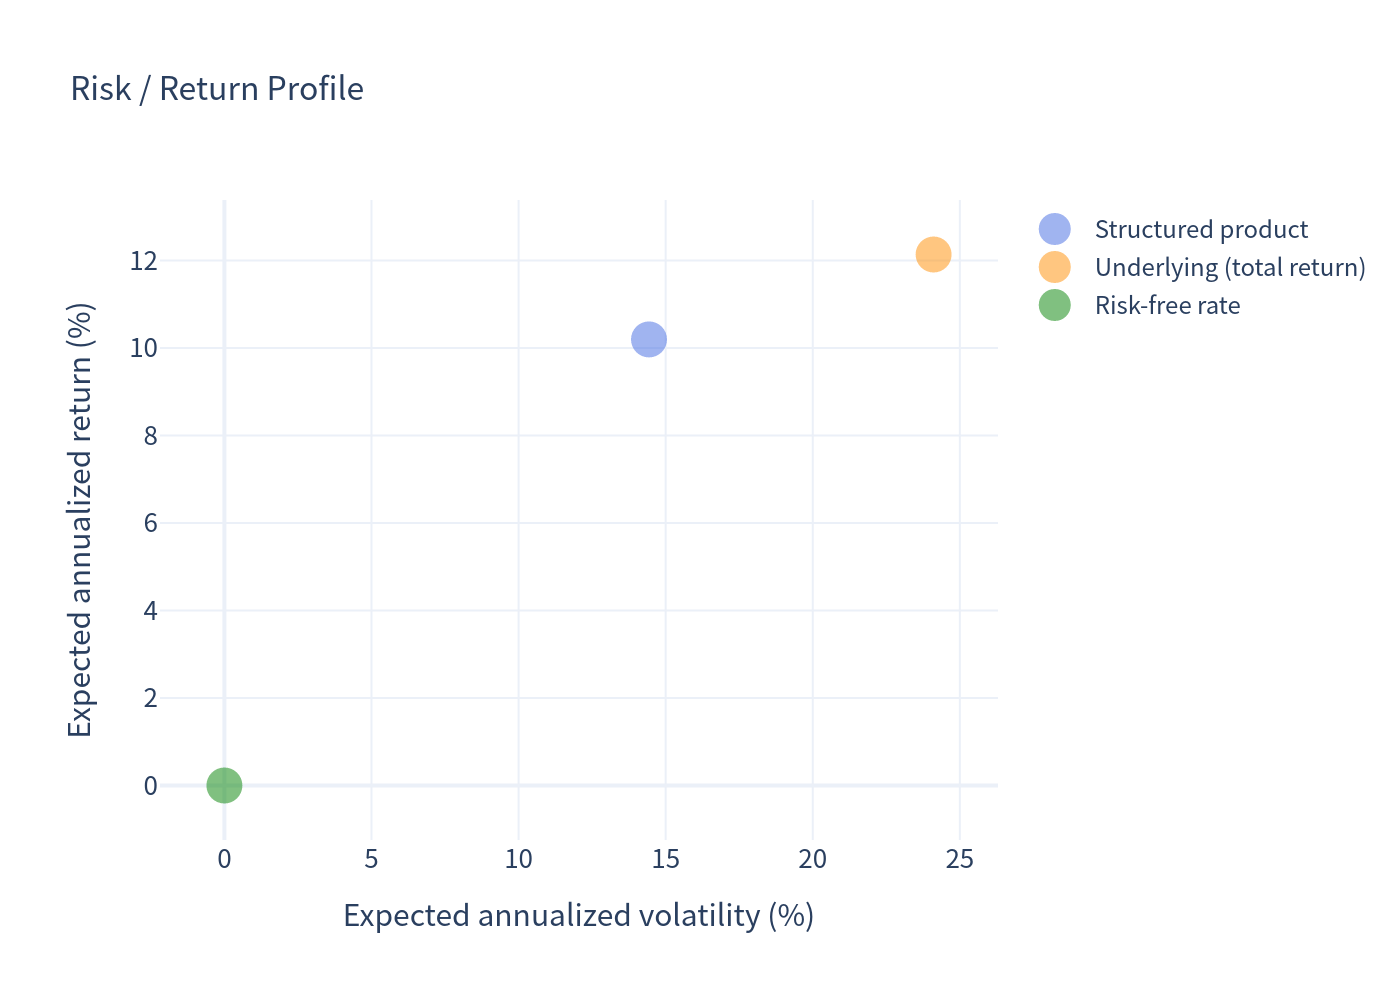
The product sits below and to the left of the underlying basket: lower expected return but materially lower volatility. It sits well above the risk-free rate.
4.4 Annualized Return Distribution (Box Plot)
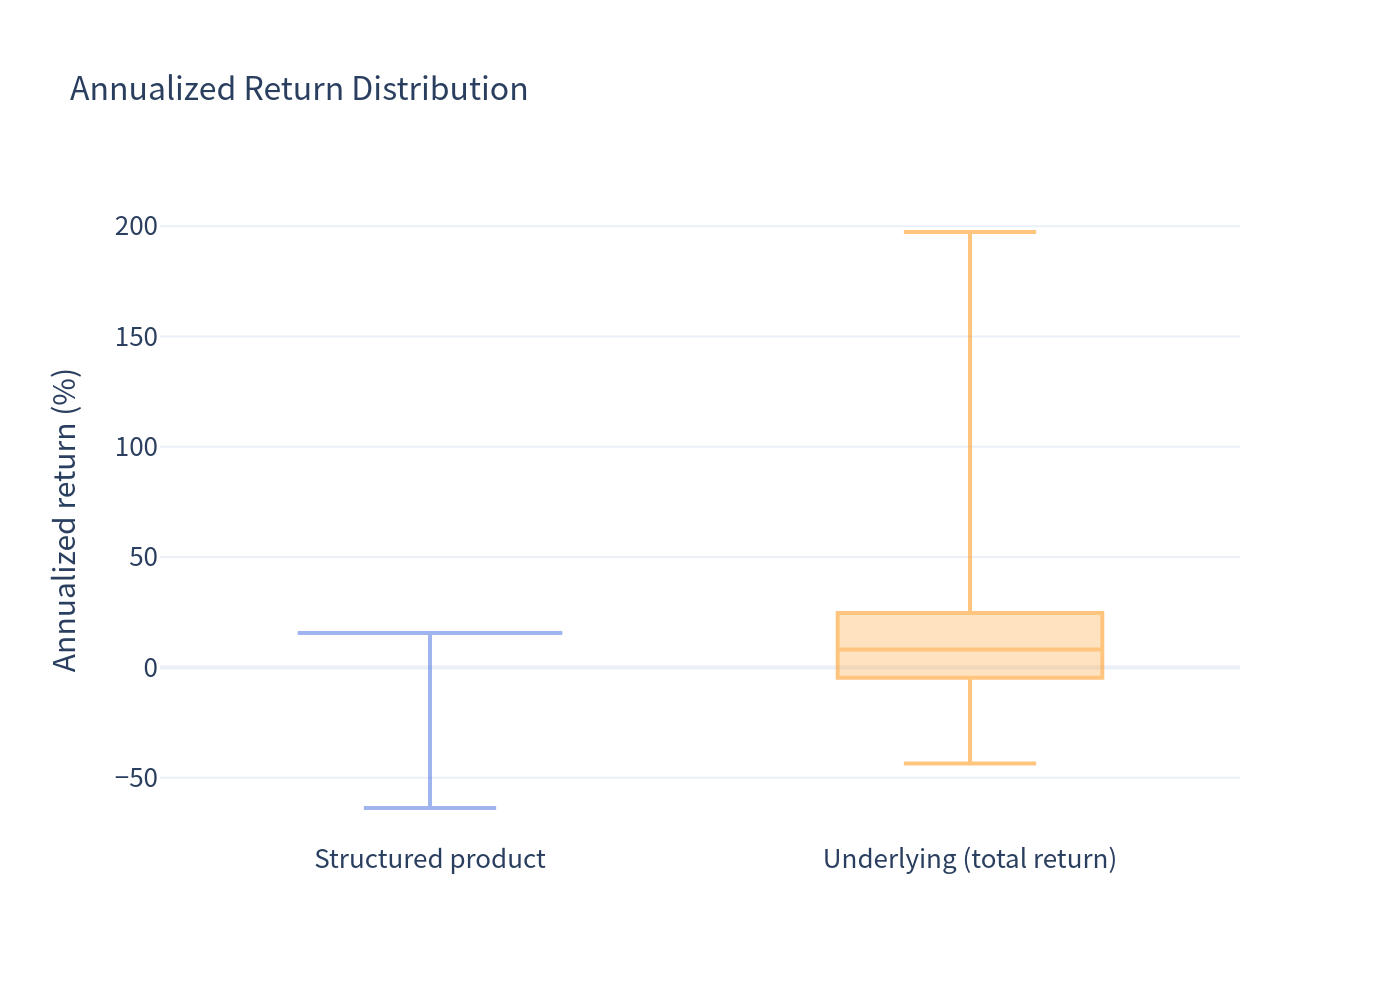
The box plot makes the asymmetry obvious: the product's box is compressed near the coupon (limited upside) while the underlying basket has a wide interquartile range.
4.5 Scenario Probabilities
4.6 Holding Period & Coupon Distributions
5) Investment Commentary
Potential advantages
- High headline coupon (15.60% p.a.) in a currency (CHF) where the risk-free rate is roughly 0% — a very large yield pickup.
- Deep barrier at 59% that must be breached by the worst of three shares on a continuous basis, i.e. the shares can fall up to 41% before the protection is lost.
- Conditional capital protection: in the majority of simulated paths (≈87%) the investor receives par plus all coupons.
- Short maximum tenor (1 year) and collateralised structure (TCM).
- Lower realized volatility and a lower probability of loss than holding the underlying basket directly (12.8% vs 34.4%).
Risks to weigh
- Worst-of exposure with a knock-in: downside references the weakest of the three shares, and once the barrier is breached the payoff is not floored — the 99% 1-year VaR (−39.5%) is worse than the diversified basket's (−28.7%). Tail risk is concentrated.
- Upside is fully capped at the coupon; you give up all share appreciation.
- Issuer call: the issuer is assumed to call when the trade is "safe" (worst-of ≥ 100%), so in strong markets the note is redeemed early and the streaming of high coupons stops — this limits the effective upside of the coupon itself.
- Issuer/credit risk (Leonteq, rated BBB−).
- The three names are volatile Swiss mid-caps (annualized vol roughly 26%–38%), and R&S Group has a short trading history.
Bottom line: the note trades a very high certain-looking coupon against capped upside and a thin, severe tail. On the simulated data it offers an expected annualized return of ~10.2% with ~14% volatility — below the basket's expected return (~12.1%) but with far less day-to-day volatility and a higher chance of a positive outcome; the price of that "smoothing" is a worse worst-case loss.
6) Disclaimer
This analysis is for information purposes only, is based on simulated paths and simplifying assumptions (notably the issuer-call rule and continuous-barrier approximation), and does not constitute investment advice, a recommendation, or a suitability assessment. Actual results will differ.