
Morgan Stanley — SPUMP40 Contingent Income Memory Buffered Auto-Callable Securities due May 1, 2031
Term: ~5 years (pricing 27-Apr-2026, final observation 28-Apr-2031, maturity 01-May-2031)
1. Headline Simulation Results
| Metric | Value |
|---|---|
| Expected annualized return | 10.19% |
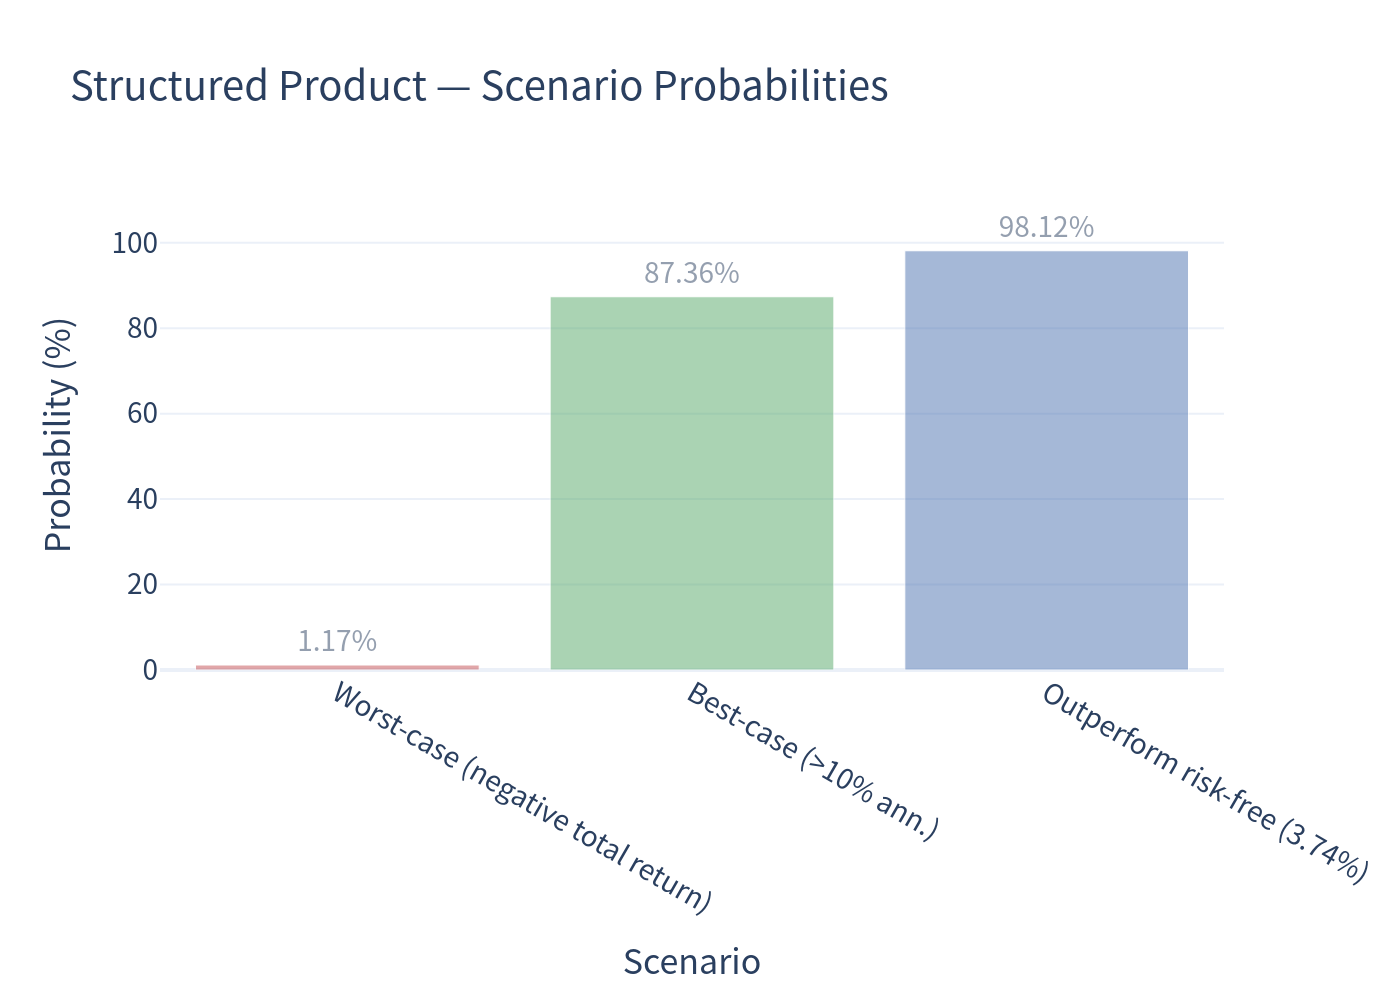
| Probability of a negative return (over the realized holding period) | 1.17% |
| 99% confidence 1-year VaR | −0.97% |
| Probability of outperforming the risk-free rate (3.74%) | 98.12% |
| Expected holding period | ~17.5 months |
| Probability of early (auto-call) redemption | 94.83% |
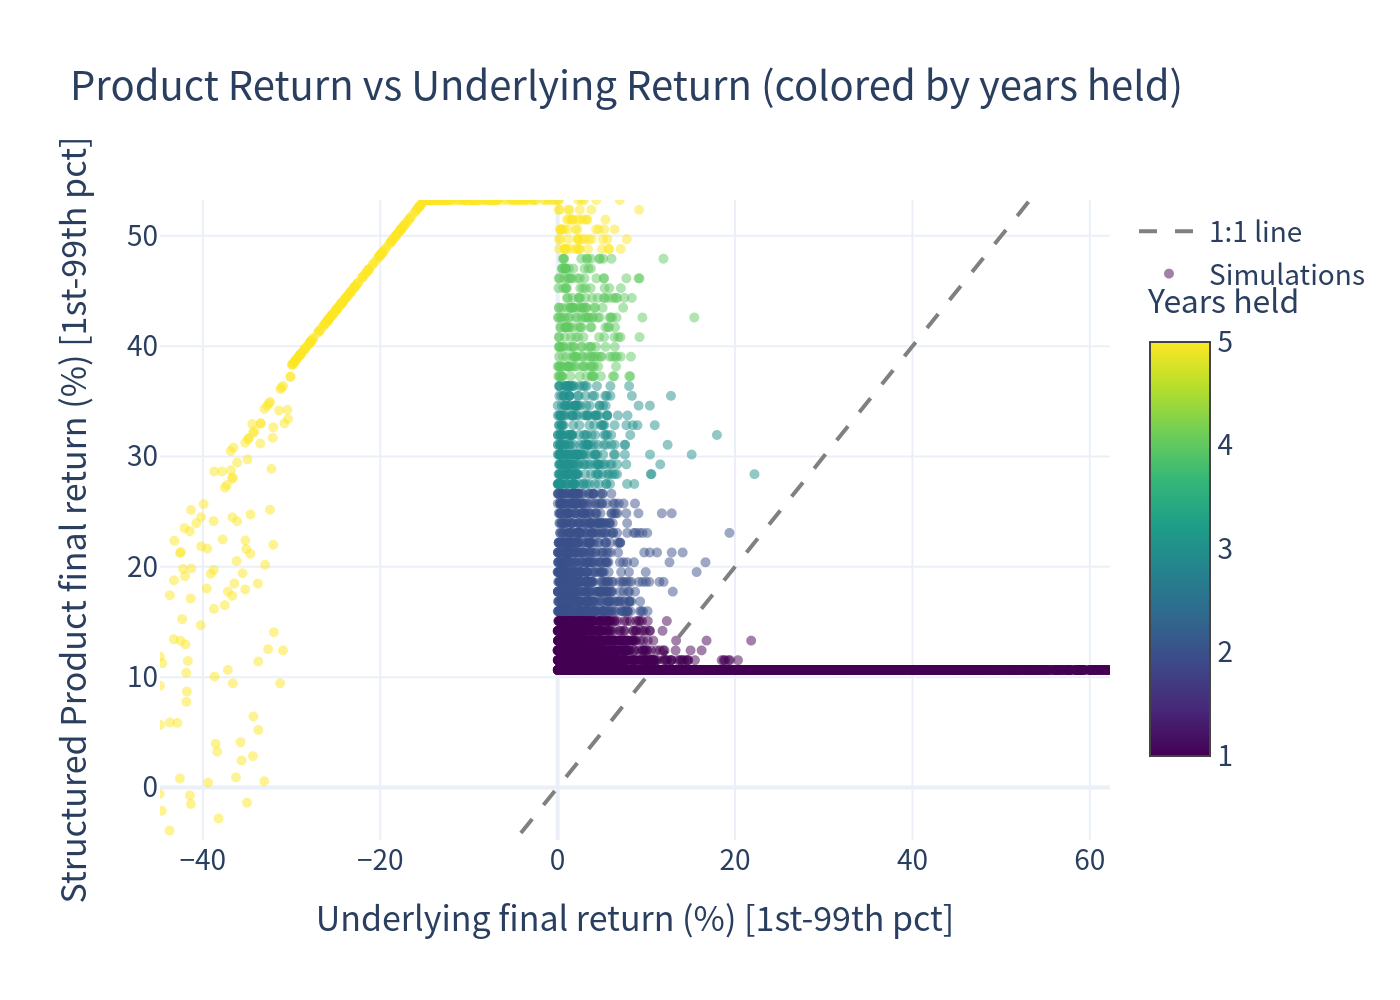
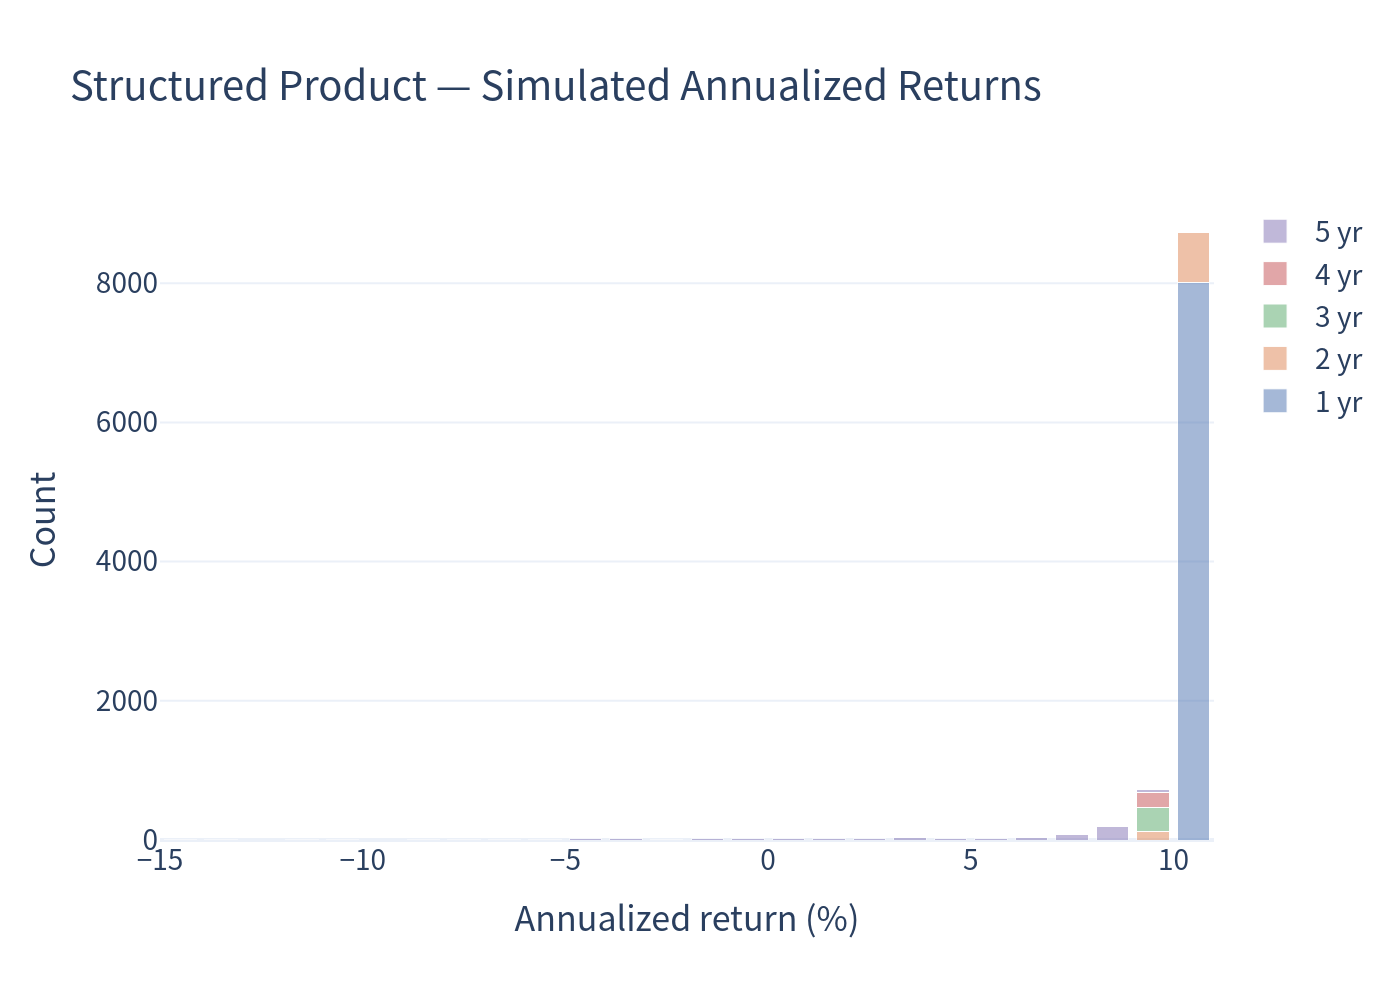
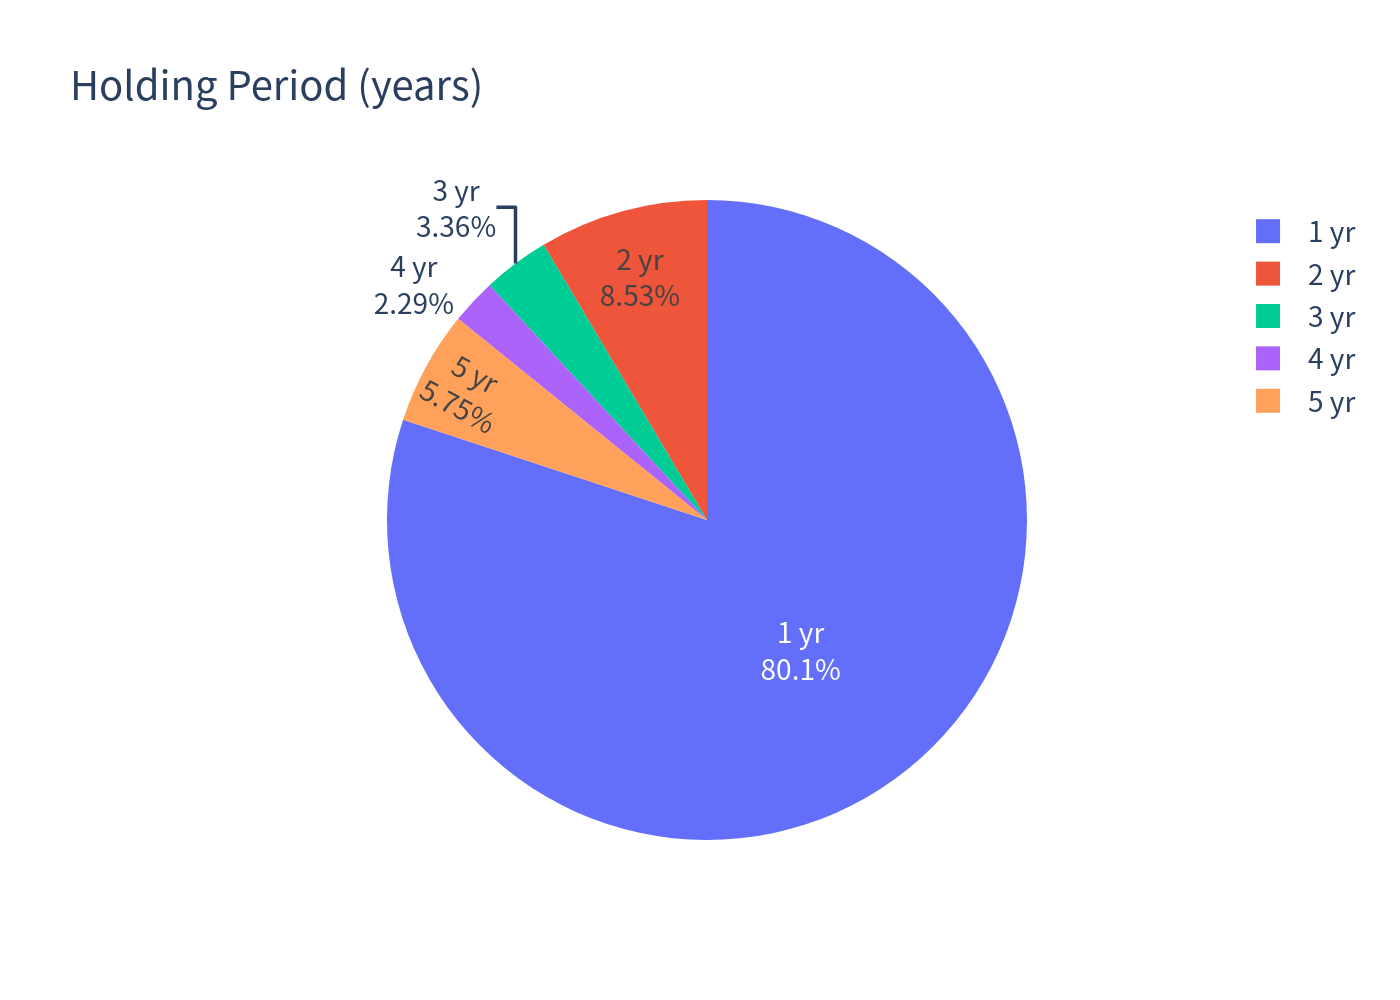
The note is a classic "high-coupon, most-likely-called-early" autocallable. Because it is auto-called as soon as the underlier is back at or above its starting level (from month 12 onward), the vast majority of outcomes resolve within roughly one year, delivering the coupon and par back. As a result the annualized return distribution is very tight (expected annualized volatility of only ~1.9%) and the headline downside is small — but the numbers are dominated by short holding periods and should be read together with the total-return and holding-period figures below.
- Expected total return over the realized (variable) holding period: 14.12% (average ~17.5 months).
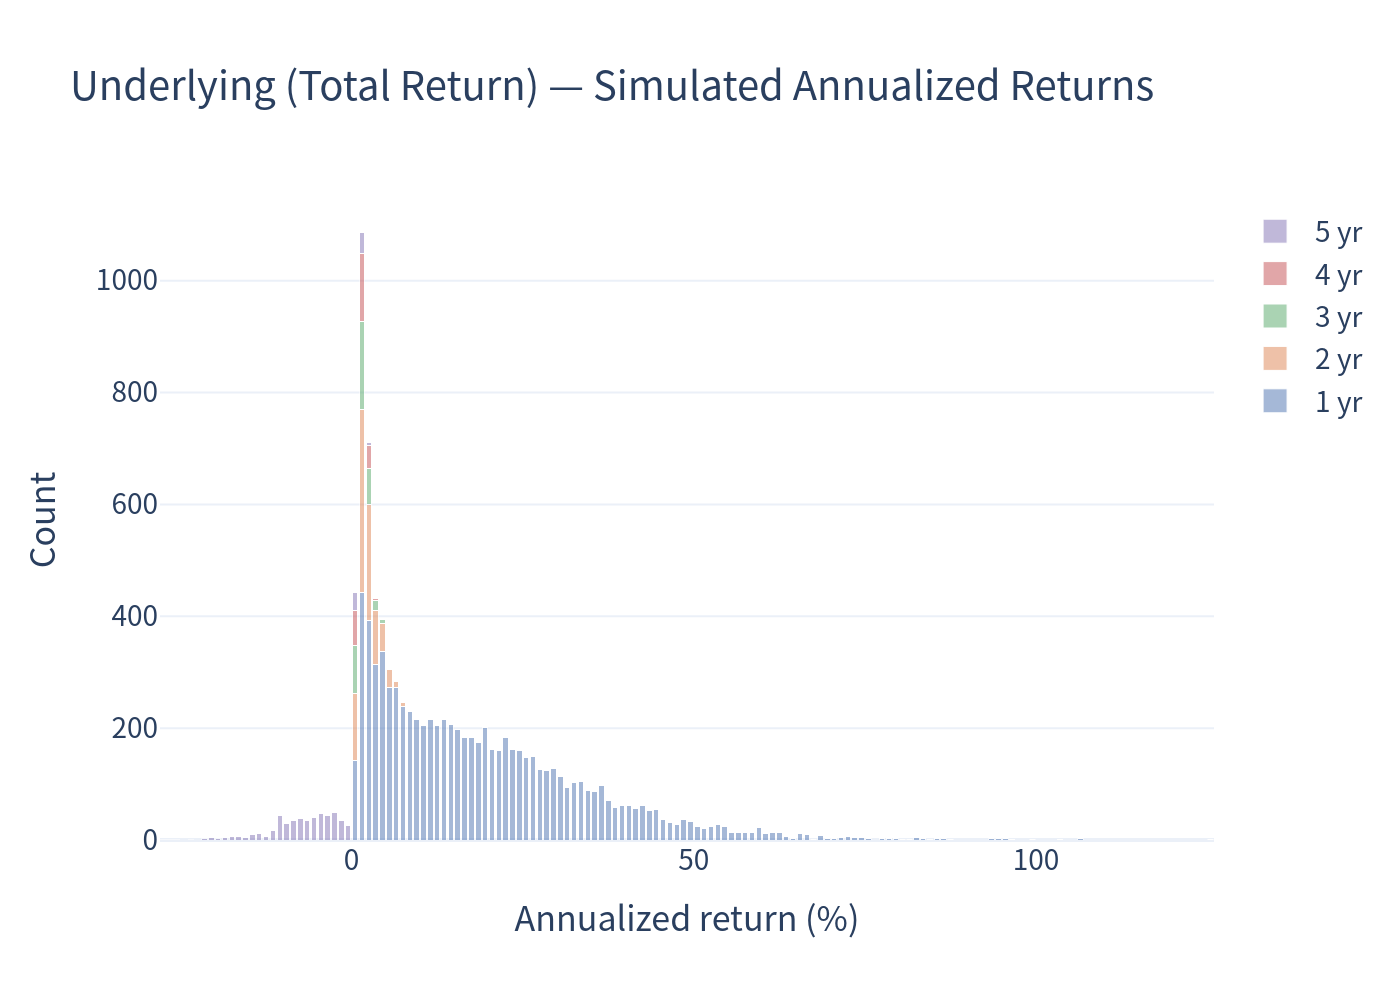
- Because ~80% of simulations finish at the first call opportunity (year 1), annualized figures are mechanically inflated; interpret them alongside the ~14% expected total return and ~1.5-year expected holding period.
2. Product Overview & How It Works
This is a 5-year contingent-income, memory-coupon, buffered auto-callable note linked to a single custom index, the S&P U.S. Equity Momentum 40% VT 4% Decrement Index (SPUMP40). The index targets a 40% volatility level (using leverage) on a US equity momentum strategy and applies a 4% per-annum decrement (a permanent performance drag). It is not principal-protected.
Mechanics in plain language
- Monthly contingent coupon (10.15%–11.15% p.a., memory). Each month the note may pay a coupon, but only if the index closes at or above 70% of its starting level on that month's observation date. The memory feature means any coupons skipped while the index was below 70% are banked and paid later, in a lump, the first time the 70% test is passed again.
- Automatic early redemption (auto-call). Starting one year after issue and then monthly, if the index closes at or above 100% of its starting level, the note is redeemed early at par ($1,000) plus any coupons then due, and it terminates. This caps the investor's upside: once the index is back to flat, the note is taken away.
- Buffered maturity payoff (if never called). At maturity only, the investor's principal is protected against the first 15% of decline. If the index is down 0% to −15%, the investor receives par ($1,000). If it is down more than 15%, losses beyond the buffer pass through 1:1 (so a −50% index move returns $650; a −100% move returns $150 — the stated "85% maximum loss").
- No upside participation. Even if the index rises 50% or 100%, the maturity payment is capped at par ($1,000); the investor earns only the coupons.
In short: the investor is selling upside and accepting a limited buffer in exchange for a high conditional coupon, and is very likely to be cashed out early whenever the market simply returns to its starting point.
3. Key Statistics — Structured Product vs. Underlying
| Metric | Structured Product | Underlying (total return, index + dividend) | Risk-free |
|---|---|---|---|
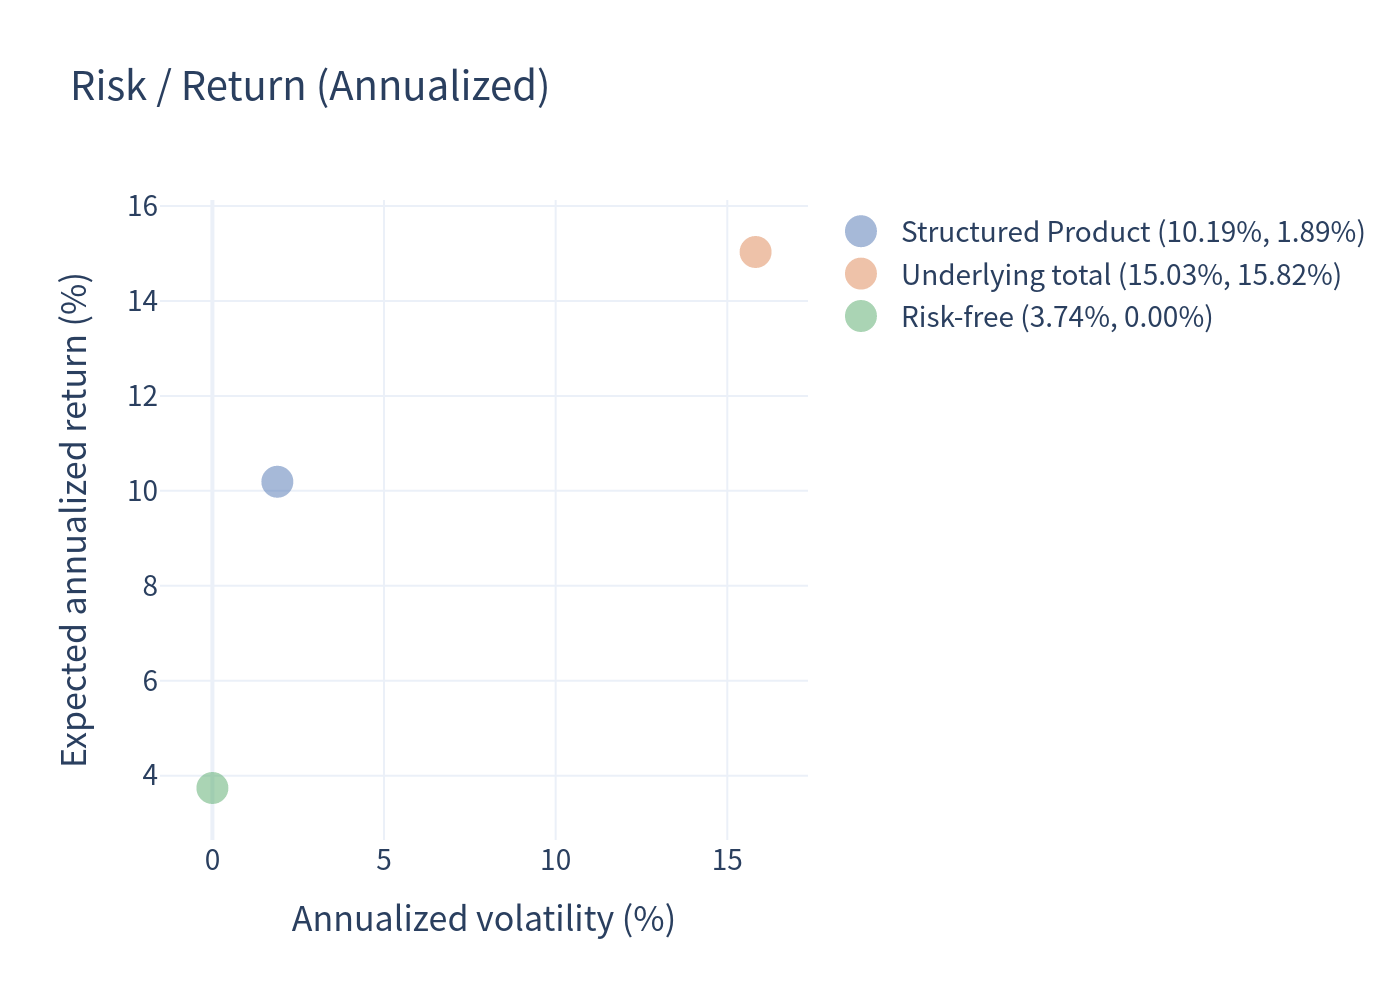
| Expected annualized return | 10.19% | 15.03% | 3.74% |
| Expected annualized volatility | 1.89% | 15.82% | 0.00% |
| Probability of loss | 1.17% | 4.99% | — |
| 99% confidence VaR (1 yr) | −0.97% | −10.50% | — |
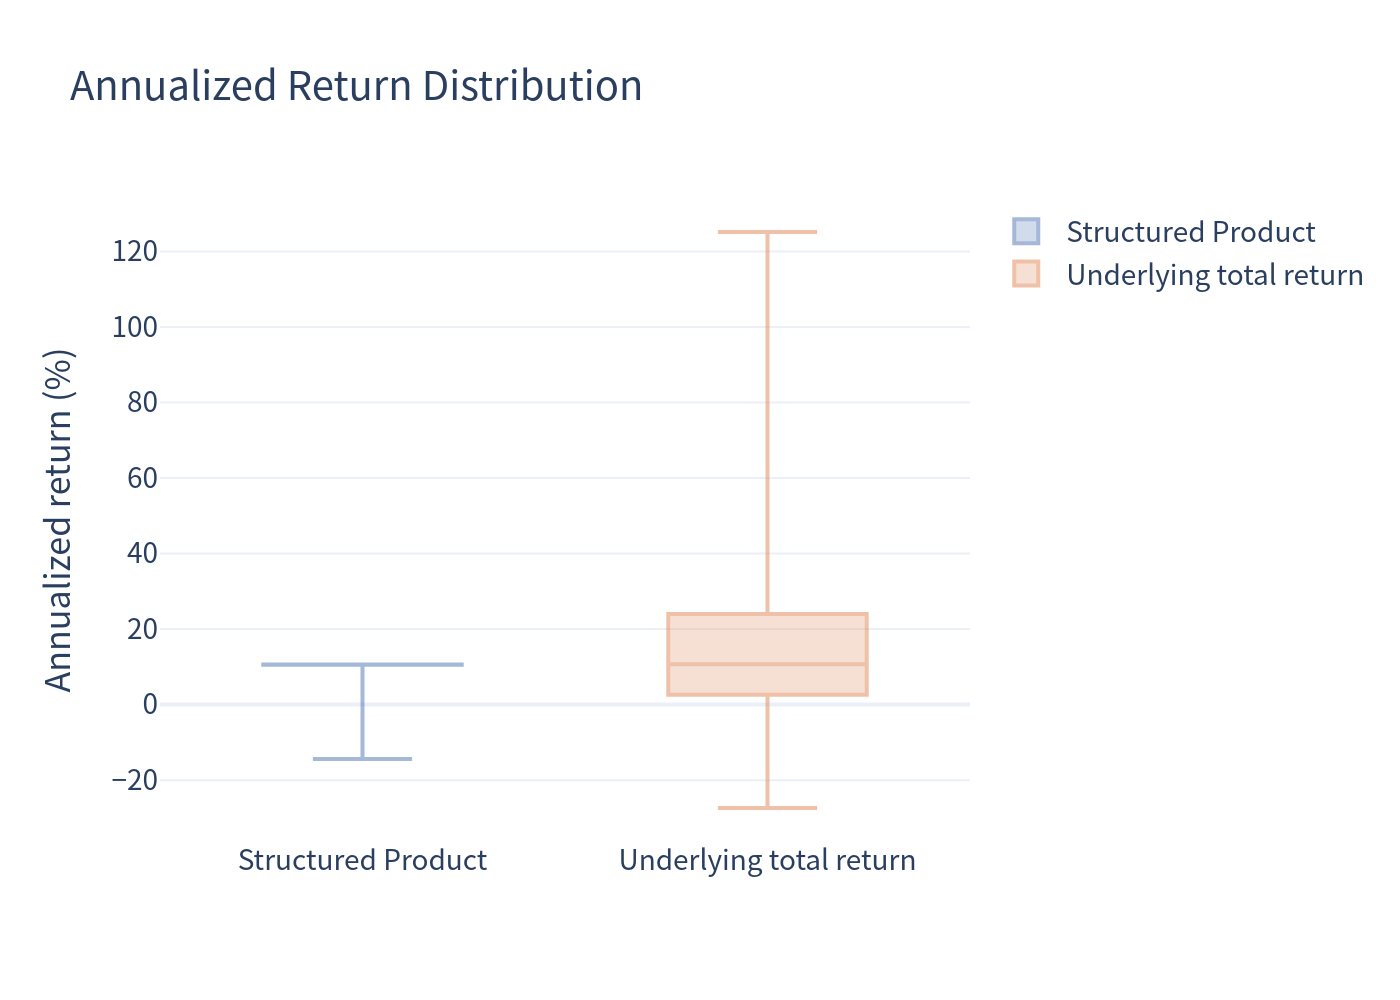
The product offers a much smoother return profile than the raw index (far lower volatility and a far smaller 99% VaR), while giving up the index's large upside — consistent with the "no participation, high coupon, buffered" design.
4. Charts
Simulation outcomes — product return vs. underlying return (color = years held)
Simulated annualized returns — underlying total return
Simulated annualized returns — structured product
Scenario probabilities (structured product)
Risk / return comparison
Annualized return distribution (box plot)
Holding-period distribution
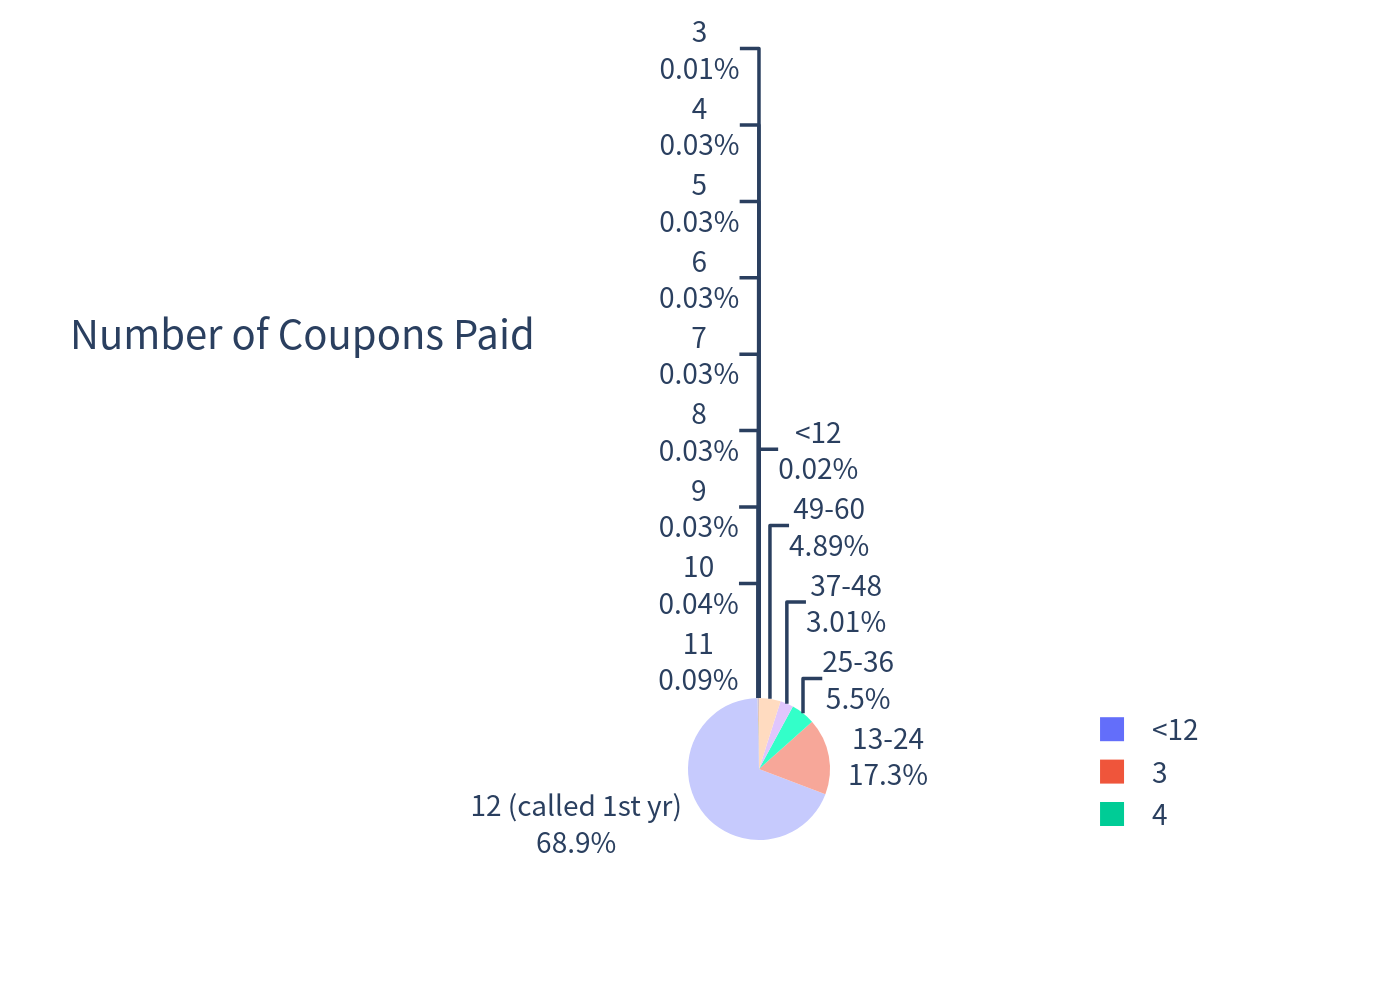
Coupon-count distribution
5. Investment Commentary
Potential positives
- High headline coupon. A conditional coupon of ~10.15%–11.15% p.a. is well above the ~3.74% one-year risk-free rate, and the memory feature materially reduces "coupon leakage" — missed coupons are later recaptured as long as the index recovers above 70%.
- Low-touch, low-volatility profile in benign markets. The 100% auto-call threshold means the note tends to be redeemed and recycled within about a year in normal/rising markets, and the 15% maturity buffer plus coupons limits losses in mild downturns. In the simulation the product shows a ~98% chance of beating cash and only a ~1.2% chance of a negative outcome.
- Defined, capped tail. Unlike an unbuffered index exposure, the worst-case principal loss is limited to 85% (index −100% ⇒ $150), and the maximum loss observed in the simulation was about −54%.
- Downside cushion vs. the raw index. In the simulated tail the product's 99% VaR (−0.97% annualized) is far smaller than the underlying's (−10.50%), reflecting the buffer plus accumulated coupons.
Things to be aware of
- No upside participation + early-call feature. The investor forfeits essentially all index appreciation above the starting level and is routinely called away once the index returns to flat — the notes are most likely to be redeemed precisely when re-investment risk is highest.
- The 4% decrement is a permanent headwind. The index applies a guaranteed 4% per-annum decrement (and pays no dividends), which lowers its expected return in all states of the world. The proxy used here (a US large-cap momentum benchmark) does not include this drag, so the underlier's true net expected return — and therefore the realistic benefit of the coupons — would be roughly 4 percentage points per year lower. Medium-/longer-dated outcomes (and the buffer) would look less favourable on a decrement-adjusted basis.
- High index volatility / leverage risk. The index targets a 40% volatility level using leverage; momentum strategies and leveraged/futures-based indices can suffer sharp reversals and "whipsaw" drawdowns, which is exactly the environment where the 70% coupon barrier and the maturity buffer are tested. (The proxy's ~16% volatility likely understates the index's true risk.)
- Short history. The index was launched in March 2022 and has very limited operating history, so model-based results carry more uncertainty than usual.
- Concentration and credit risk. The return depends on a single custom index, and the note is an unsecured obligation of Morgan Stanley Finance LLC (guaranteed by Morgan Stanley).
- Pricing / secondary-market frictions. The estimated value (~$898 per $1,000) is below the issue price, costs are embedded, and the notes are not exchange-listed.