
tokenengine.ai
Structured Product Evaluator
Morgan Stanley Market-Linked Notes due February 4, 2031
Linked to the S&P 500® Futures Excess Return Index — Simulation Analysis
Headline Simulation Results
Product at a Glance
| Feature | Detail |
|---|---|
| Type | Market-Linked Note, principal-protected |
| Term | 5 years (fixed) |
| Underlying | S&P 500® Futures Excess Return Index (single index) |
| Coupon | None |
| Upside participation | 125% (base case; range 125%–135%) |
| Cap | None (uncapped upside) |
| Downside | Principal fully protected at maturity |
How it works (in plain terms)
- You invest $1,000 for five years and collect no interest along the way.
- At maturity, look at the index. If the index is higher, you receive your $1,000 plus 125% of the index gain (e.g., a +10% index move pays $1,125).
- If the index is flat or lower, you simply receive your $1,000 back.
- Because the participation rate exceeds 100% and there is no cap, strong equity markets are amplified — while the investor does not participate in any index decline.
Key Statistics (Annualized over the 5-year term)
| Metric | Structured Product | Underlying (index) | Underlying total return* | Risk-free rate |
|---|---|---|---|---|
| Expected annualized return | 6.40% | 3.86% | 7.63% | 3.76% |
| Expected annualized volatility | 6.20% | 7.35% | 7.35% | 0.00% |
| Probability of loss | 0.00% | 28.18% | 14.79% | 0.00% |
| 99% confidence VaR (1 year) | 0.00% | -15.43% | -11.66% | +3.76% |
*Underlying total return = the excess-return index plus the cash (risk-free) return — the equivalent of a fully-collateralised "total return" equity position.
Conventions
All return statistics are computed on each path's annualized 5-year return, so "annualized volatility" is the dispersion of that annualized figure (which is smaller than a single year's volatility), and the "99% VaR" is the 1st percentile of the annualized return distribution. On the note, a 0.00% return and "loss" are the same event as the underlying ending below its initial level, because the note floors at par — this is why the index's 28.18% loss probability equals the note's 28.18% chance of returning only principal.
Reading the numbers
The structured note sits between the raw index and the total-return equity benchmark. It beats the raw index (6.40% vs 3.86%) because principal protection removes the downside and it captures more than 100% of the gains. It gives up some return relative to a fully-invested total-return position (7.63%) — the price of the downside protection and the absence of income. Its volatility (6.20%) is the lowest of any equity-linked alternative, and VaR is zero.
Simulation Charts
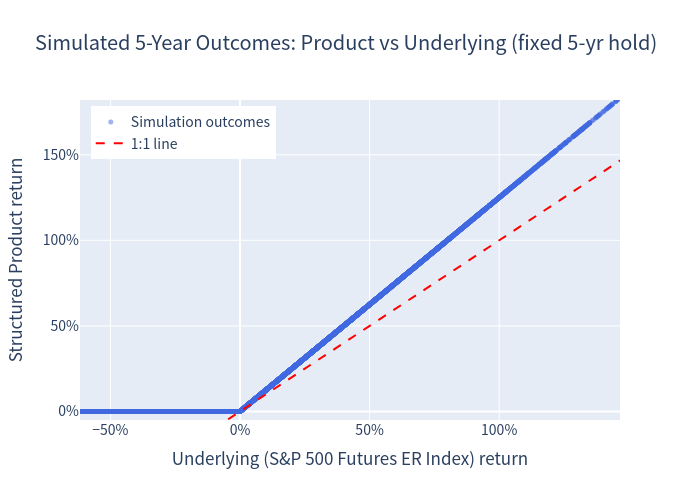
Outcome Map — Product vs Underlying (5-year, fixed hold)
Every point is one of 10,000 simulated scenarios. Points hugging the 1:1 line in the positive region show the participation uplift; the flat band at 0% on the product axis is the principal-protection floor absorbing all index declines.
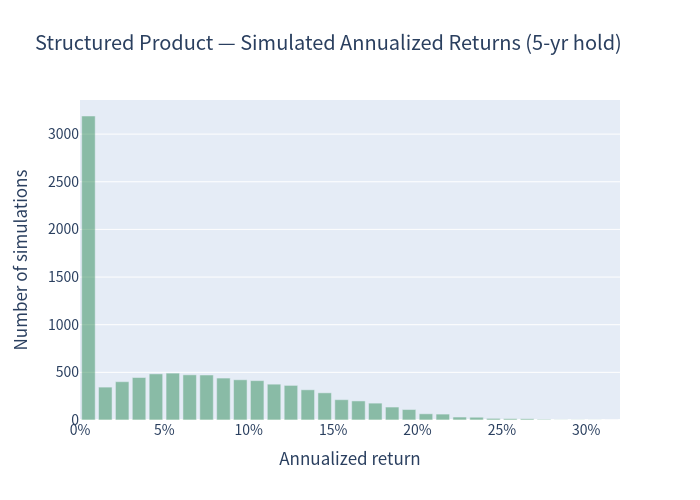
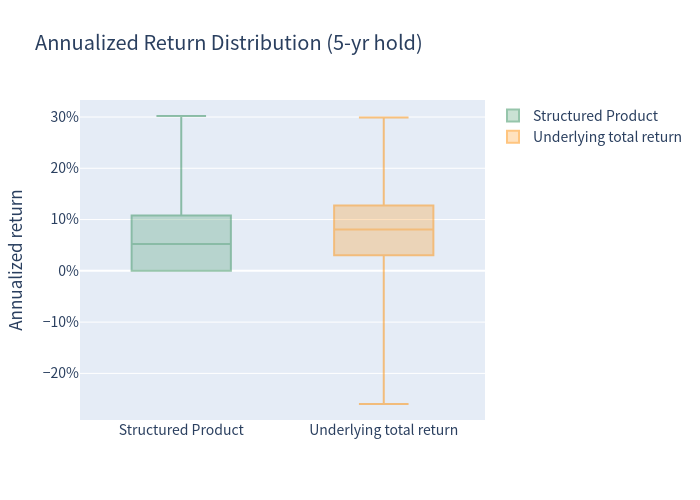
Distribution of Annualized Returns
Structured product — a large spike at 0.00% (all scenarios where the index ends flat or down → par returned) and a right-skewed tail of positive outcomes.
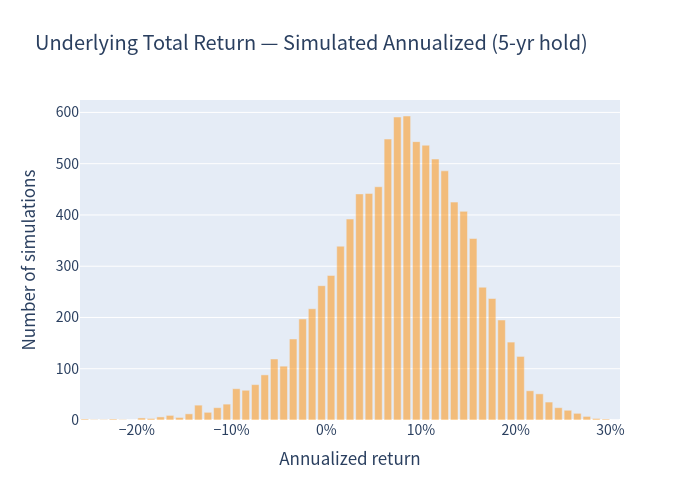
Underlying total return — a roughly symmetric distribution with a meaningful left tail into losses.
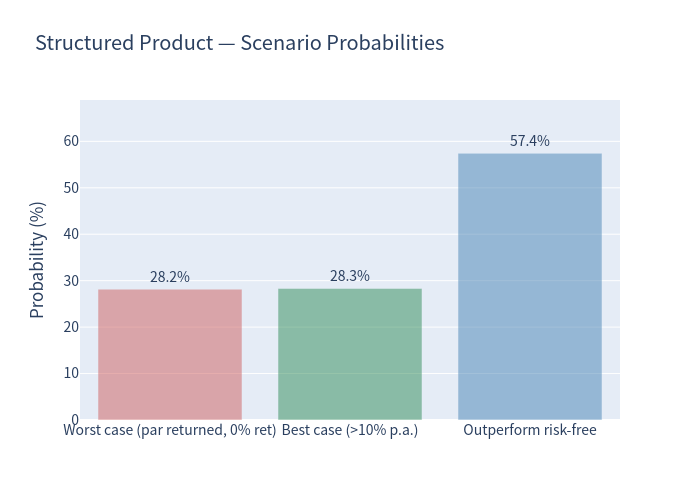
Scenario Probabilities
Worst case (par returned, 0.00% return): 28.18%
Best case (>10% p.a.): 28.33%
Outperform risk-free (3.76%): 57.42%
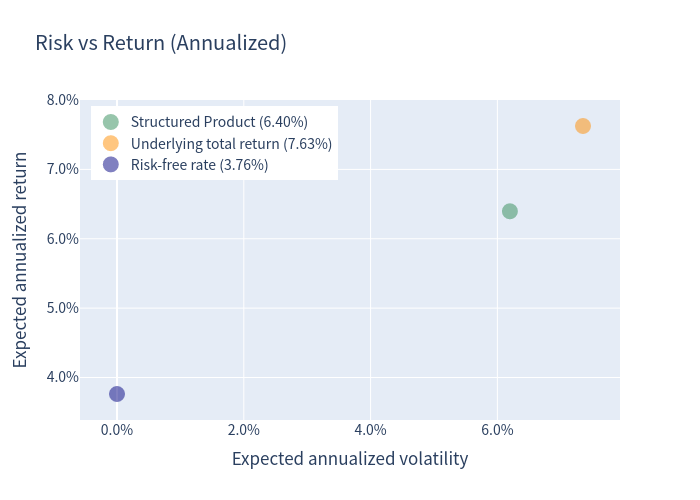
Risk vs Return
The note offers a higher expected return than the underlying index at lower volatility, and clearly out-returns cash — the classic "protected equity upside" profile.
Annualized Return Distribution — Box Plot
The product's distribution is truncated at 0% (no losses) and skewed upward, versus the symmetric, wider spread of the underlying total return.
Participation-Rate Sensitivity
| Participation rate | Expected annualized return | Expected 5-year total return | P(beat risk-free) | P(>10% p.a.) |
|---|---|---|---|---|
| 125% (base) | 6.40% | 41.19% | 57.42% | 28.33% |
| 130% | 6.60% | 42.84% | 57.99% | 29.60% |
| 135% | 6.80% | 44.48% | 58.62% | 30.80% |
The economics improve modestly as the participation rate rises across the 125%–135% range.
Investment Commentary
Strengths
- Hard principal protection. Across all 10,000 simulations the note never returns less than par; there is no adverse path that produces a capital loss (99% VaR = 0.00%). This is a genuinely defensive equity exposure.
- Leveraged, uncapped upside. A participation rate above 100% with no cap means bull-market participation is magnified rather than clipped.
- High hit rate versus cash. The note beats the risk-free rate in ~57% of scenarios, and roughly 28% of paths deliver a strong result (>10% p.a.).
- Favourable asymmetry. Because the investor does not participate in declines, the return profile is positively skewed — you keep the equity upside while truncating the downside.
Considerations (factual, not advice)
- Opportunity cost / no income. With no coupons, if the index is flat or down the note returns exactly par, i.e. a 0.00% nominal return over five years — less than a cash deposit over the same period.
- ~28% "dead" outcomes. Roughly one in four scenarios returns only the principal, producing zero nominal return despite locking up capital for five years.
- Issuer credit risk. All payments depend on Morgan Stanley / MSFL; the protection is only as good as the issuer.
- Embedded cost. The estimated value at pricing (~$969.90 vs $1,000 issue price) reflects an upfront structuring cost borne by the investor.