
Morgan Stanley SPUMP40 Jump Market-Linked CD — Simulation Analysis Report
Type: FDIC-insured, market-linked Certificate of Deposit with an auto-callable ("Jump") feature, due June 30, 2033 (approximately 7 years from the June 25, 2026 pricing date). Notional: $1,000 per CD.
Underlying: S&P U.S. Equity Momentum 40% VT 4% Decrement Index (SPUMP40) — a single, rules-based momentum index over U.S. equities that targets 40% annualized volatility and deducts a fixed 4% per annum decrement.
How it works (in plain terms)
- Early redemption check (each year, starting year 1): If the SPUMP40 index closes at or above its initial level on any annual determination date, the CD is automatically redeemed and pays a fixed amount equal to 7.25% simple interest per year held (e.g., $1,145.00 per CD if redeemed in year 2, $1,435.00 if redeemed in year 6). The CD then ends.
- If never auto-redeemed (held to maturity): The CD pays 100% of the deposit amount plus 100% of any positive index performance (e.g., +50% index → $1,500 per CD). If the index is flat or down at maturity, the investor still receives the full $1,000 deposit — no downside loss.
- The CD pays no periodic interest/coupons; all value is delivered through the redemption payments.
| Metric | Structured Product | Underlying (SPUMP40 proxy) |
|---|---|---|
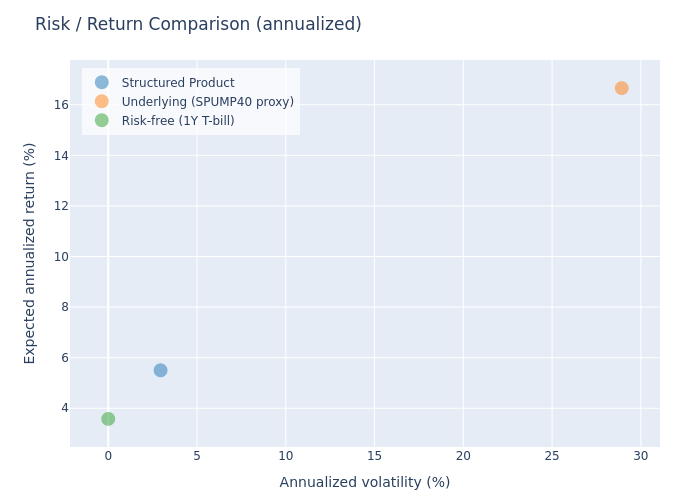
| Expected annualized return | 5.50% | 16.66% |
| Expected annualized volatility | 2.95% | 28.92% |
| Probability of loss | 0.00% | 21.47% |
| 99% confidence VaR (1 year) | 0.00% | −25.19% |
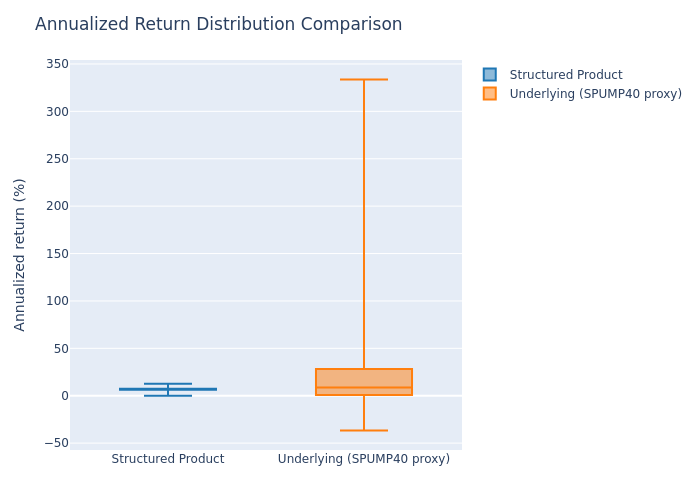
| Median annualized return | 7.00% | 8.63% |
Holding-period profile
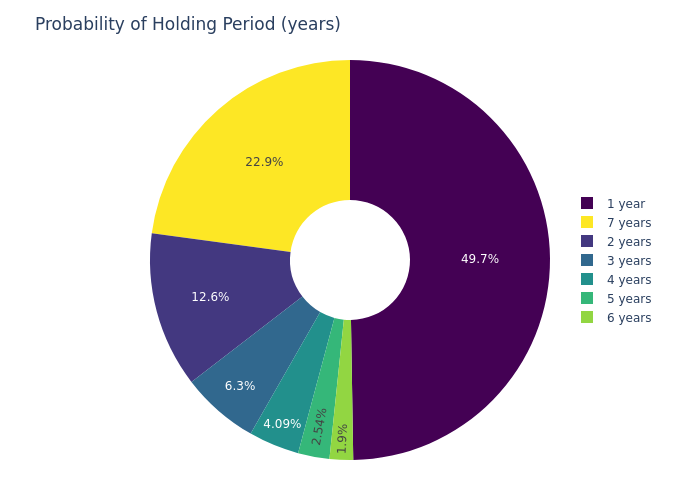
The product redeems early in most scenarios — year 1 (49.74%), year 2 (12.56%), year 3 (6.30%), year 4 (4.09%), year 5 (2.54%), year 6 (1.90%), and maturity year 7 (22.87%). Because the large majority of simulations end within the first year or two at a 7.25% simple annual return, the expected total return (10.05%), the expected holding period (2.94 years) and the expected annualized return (5.50%) should be read together. The annualized return also declines with longer holding because the 7.25% per annum is simple interest — ~7.25% p.a. (year 1) → ~7.00% p.a. (year 2) → ~6.20% p.a. (year 6).
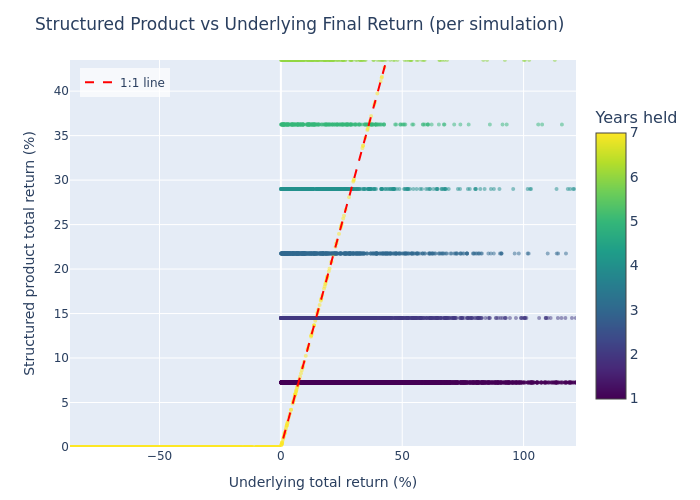
Simulation Outcomes — Structured Product vs Underlying
Scatter of simulated scenario outcomes comparing the structured product's payoff with the underlying index performance.
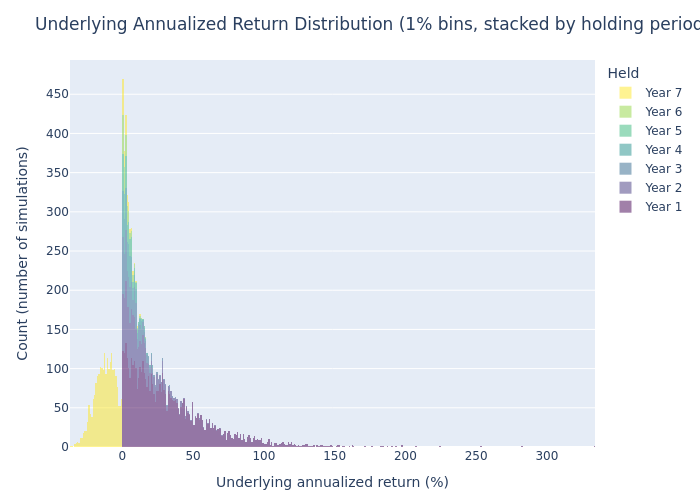
Underlying Annualized Return Distribution
1% bins, colored by holding period.
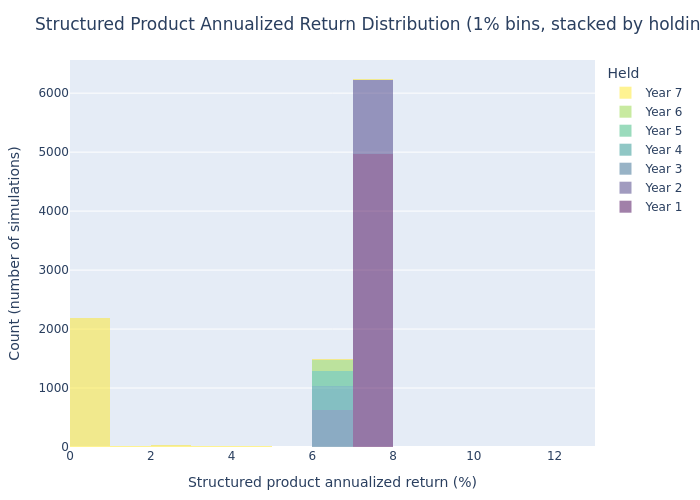
Structured Product Annualized Return Distribution
1% bins, colored by holding period.
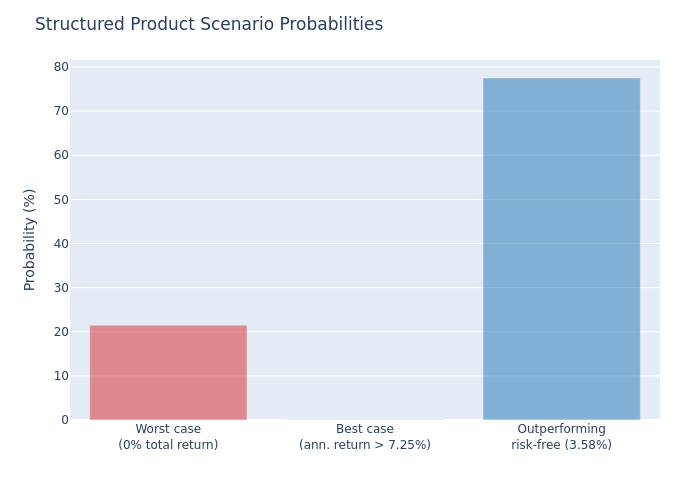
Scenario Probabilities
Bar chart of redemption and outcome probabilities.
Risk / Return Comparison
Risk-return positioning of the structured product versus the underlying index proxy.
Annualized Return Distribution Comparison (Box Plot)
Box plot comparison of the annualized return distributions.
Probability of Holding Period
Pie chart of holding-period probabilities across all simulation scenarios.
| Scenario | Probability |
|---|---|
| Worst case — 0% total return (held to maturity, index flat/down) | 21.47% |
| Best case — annualized return above 7.25% (strong maturity upside) | 0.10% |
| Outperforming the risk-free rate (3.58% p.a.) | 77.51% |
Key strengths
- Full principal protection at maturity: the payoff table confirms a $1,000 floor even for a −100% index move, and the 99% VaR of 0.00% confirms no loss scenario in simulation.
- High early-redemption frequency: a 77.13% probability of being auto-called, with roughly half of all simulations redeeming after just one year at a 7.25% simple annual return — well above the 3.58% risk-free rate.
- Attractive fixed redemption ladder: payments step up each year (107.25 → 143.50 index points), rewarding longer survival.
- Uncapped upside participation (100%) if held to maturity in a strongly rising market, with zero downside.
Points to weigh
- Opportunity cost of early redemption: because most simulations auto-call in years 1–2, the investor typically earns a modest fixed return (7.25% simple) and forfeits subsequent market upside; the expected annualized return (5.50%) sits only modestly above the risk-free rate while the simulated underlying carries much higher expected return (16.66% p.a.) but also much higher volatility and tail risk.
- High-volatility underlying: the 40% volatility-target index produces a wide dispersion of outcomes (underlying 99% VaR of −25.19% p.a. and 21.47% probability of a loss); the "no-loss" CD effectively converts this volatile index into a bond-like, capped-return stream.
- No periodic income: the CD pays no interest until a redemption event occurs.
- Concentration of outcomes: the return profile is largely bimodal — roughly 7.25% p.a. (early auto-call) or ~0% (maturity with a flat/down index); only 0.10% of simulations exceed a 7.25% annualized return.