
info@tokenengine.ai
Morgan Stanley MSAMP5 Jump Market-Linked CDs with Auto-Callable Feature
Headline Simulation Results
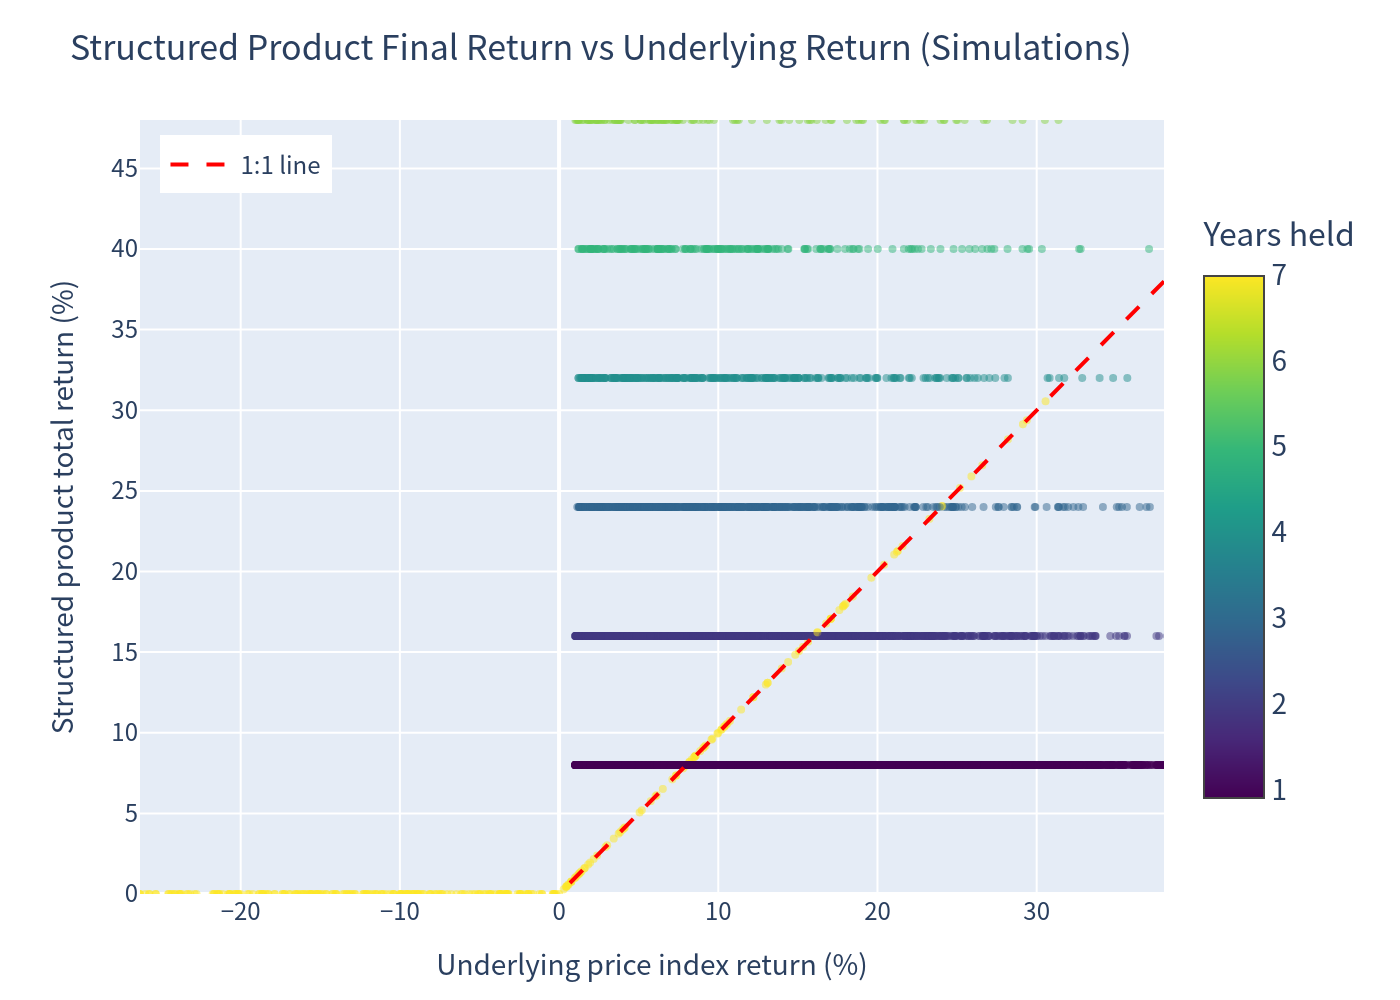
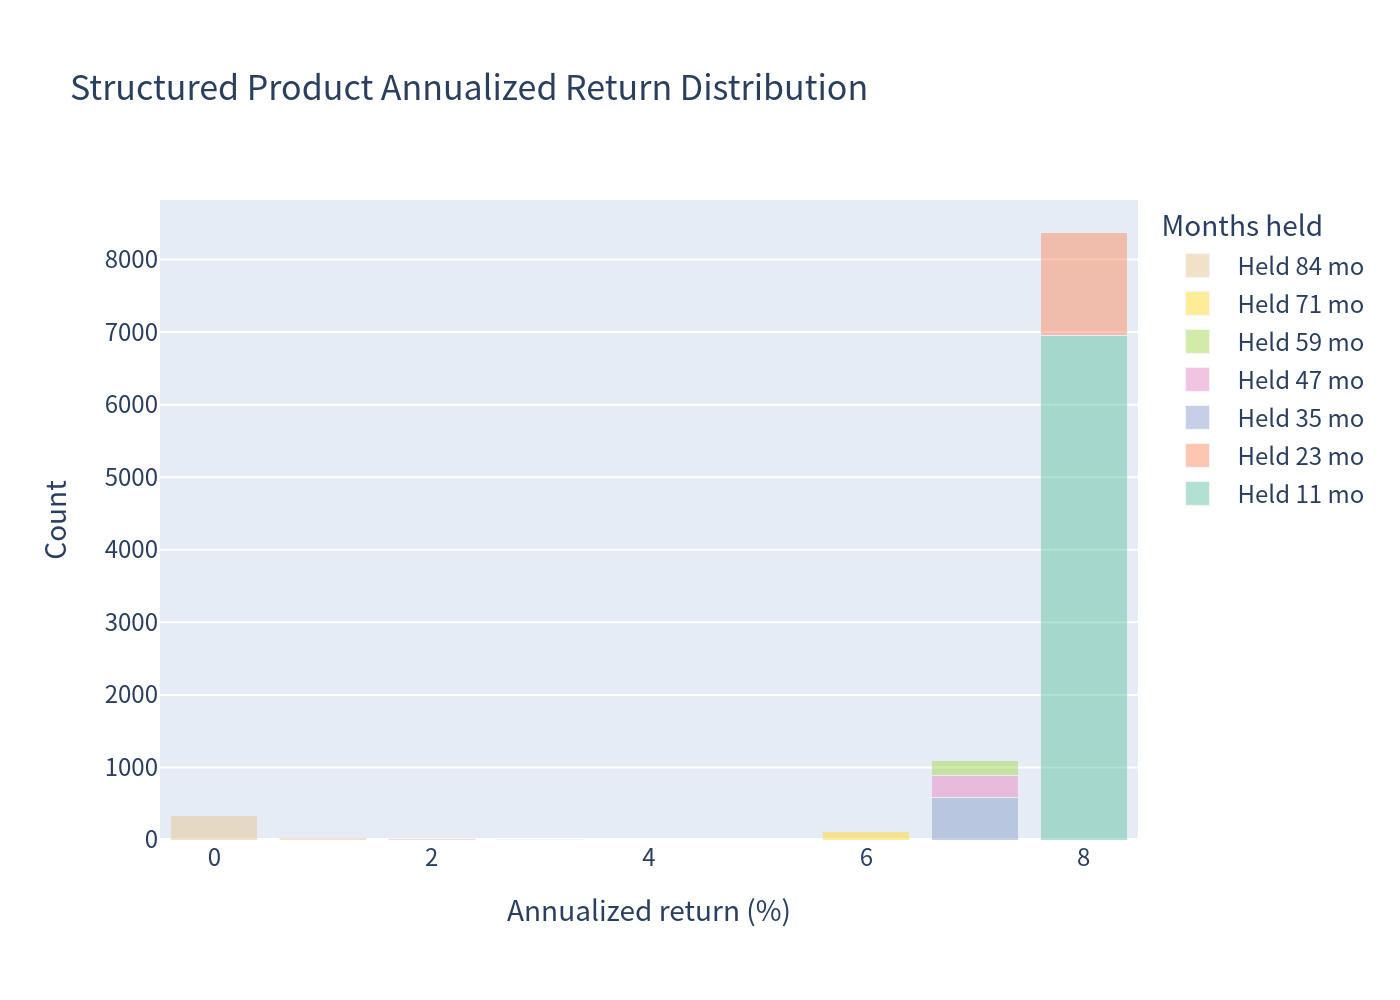
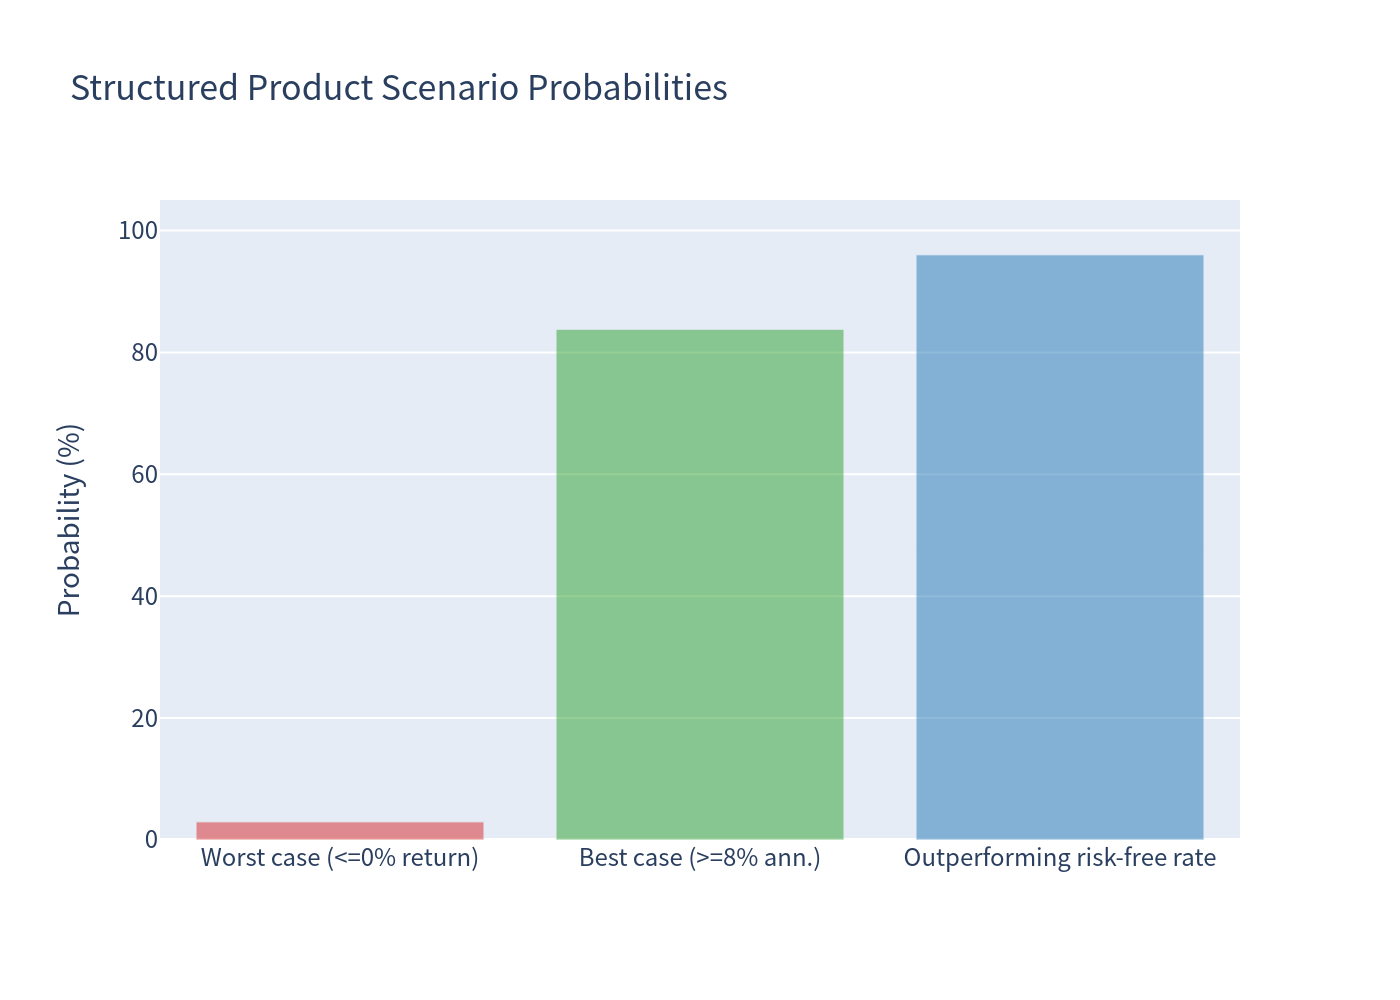
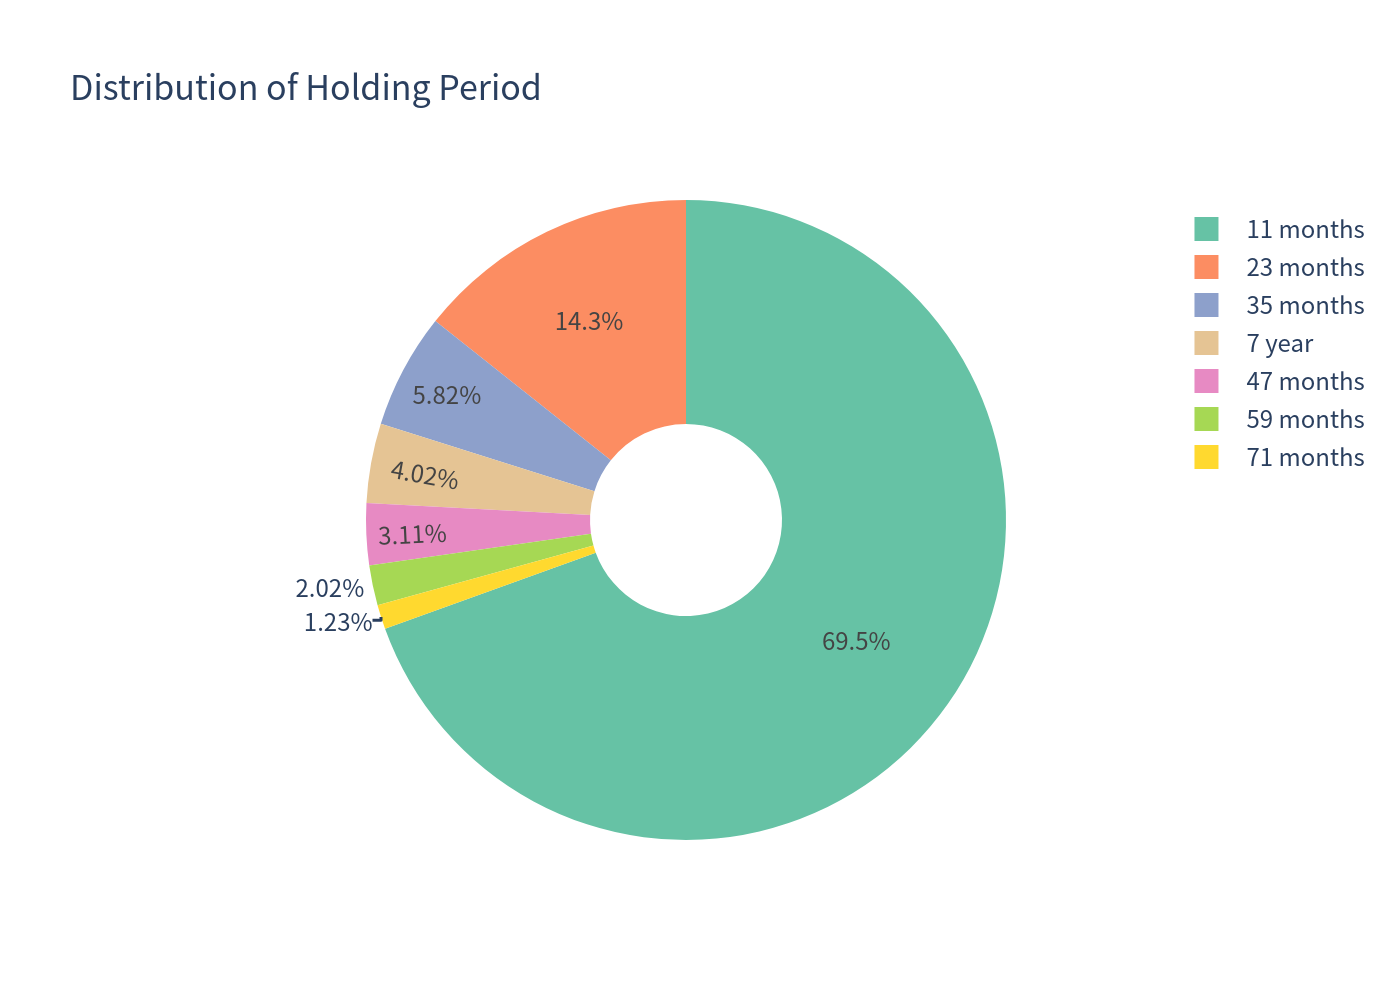
The product is auto-called in 95.98% of simulated scenarios — most (69.48%) at the first determination date (11 months) — paying a fixed 8.00% p.a. call return. In the remaining ~4% of scenarios (held to maturity), the investor receives 100% participation in any index upside, with full principal protection.
No simulated scenario produced a negative return; however, ~3.0% of scenarios (held to maturity with a flat/declining index) returned 0% over the full 7-year term — i.e., principal returned with no growth.
Basic Product Information
How it works (layman's explanation)
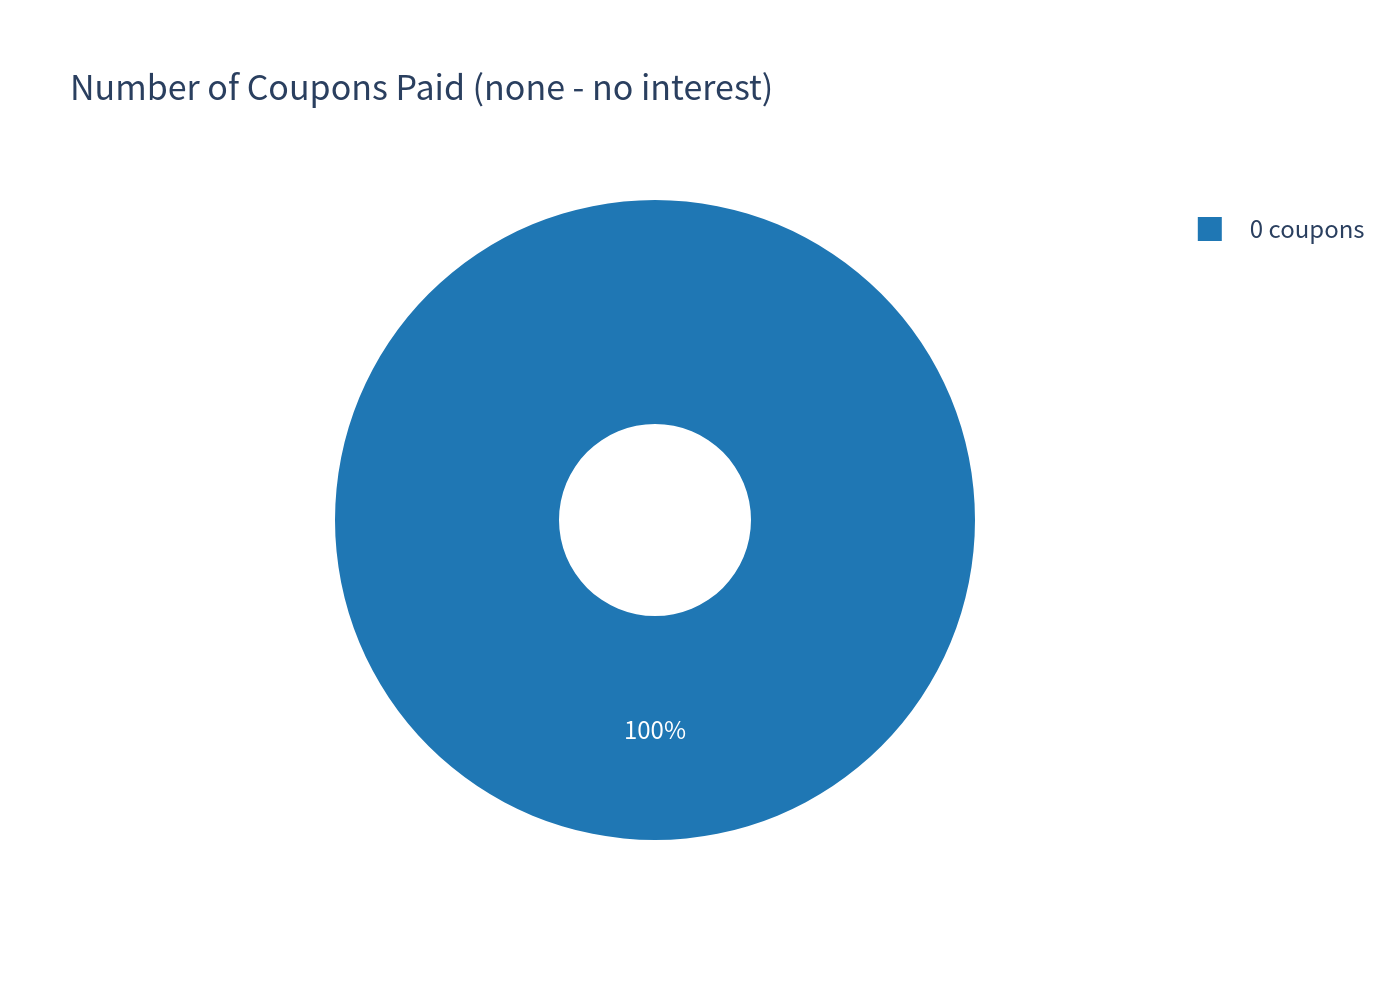
- You deposit $1,000 per CD with Morgan Stanley Bank, N.A. The CD pays no periodic interest.
- Your return is linked to the Morgan Stanley Amplitude Index™ (MSAMP5) — a proprietary, rules-based multi-asset index that dynamically allocates across global equities, bonds, commodities, currencies and credit using momentum and volatility-management techniques. Because this index has no public trading history (established Jan 2026), a multi-asset volatility-managed fund was used as a market proxy in the simulation.
- Auto-call feature: On each of 6 annual determination dates (July 2027 – July 2032), if the index closes at or above 101% of its initial level, the CD is automatically redeemed for a fixed cash amount equal to an 8.00% per annum simple return: $1,080 (yr 1) up to $1,480 (yr 6) per CD.
- Maturity (if never called): At maturity (Aug 2033) you receive $1,000 plus 100% of any positive index return, with no upside cap. If the index is flat or lower than its initial level, you receive $1,000 — your principal is fully protected (subject to issuer credit standing).
| Determination | Date | Month | Early Redemption Payment |
|---|---|---|---|
| #1 | Jul 28, 2027 | 11 | $1,080 |
| #2 | Jul 28, 2028 | 23 | $1,160 |
| #3 | Jul 30, 2029 | 35 | $1,240 |
| #4 | Jul 29, 2030 | 47 | $1,320 |
| #5 | Jul 28, 2031 | 59 | $1,400 |
| #6 | Jul 28, 2032 | 71 | $1,480 |
| Maturity | Aug 26, 2033 | 84 | $1,000 + 100% × upside (uncapped), min $1,000 |
Key Statistics (annualized)
| Metric | Structured Product | Underlying / Benchmark* |
|---|---|---|
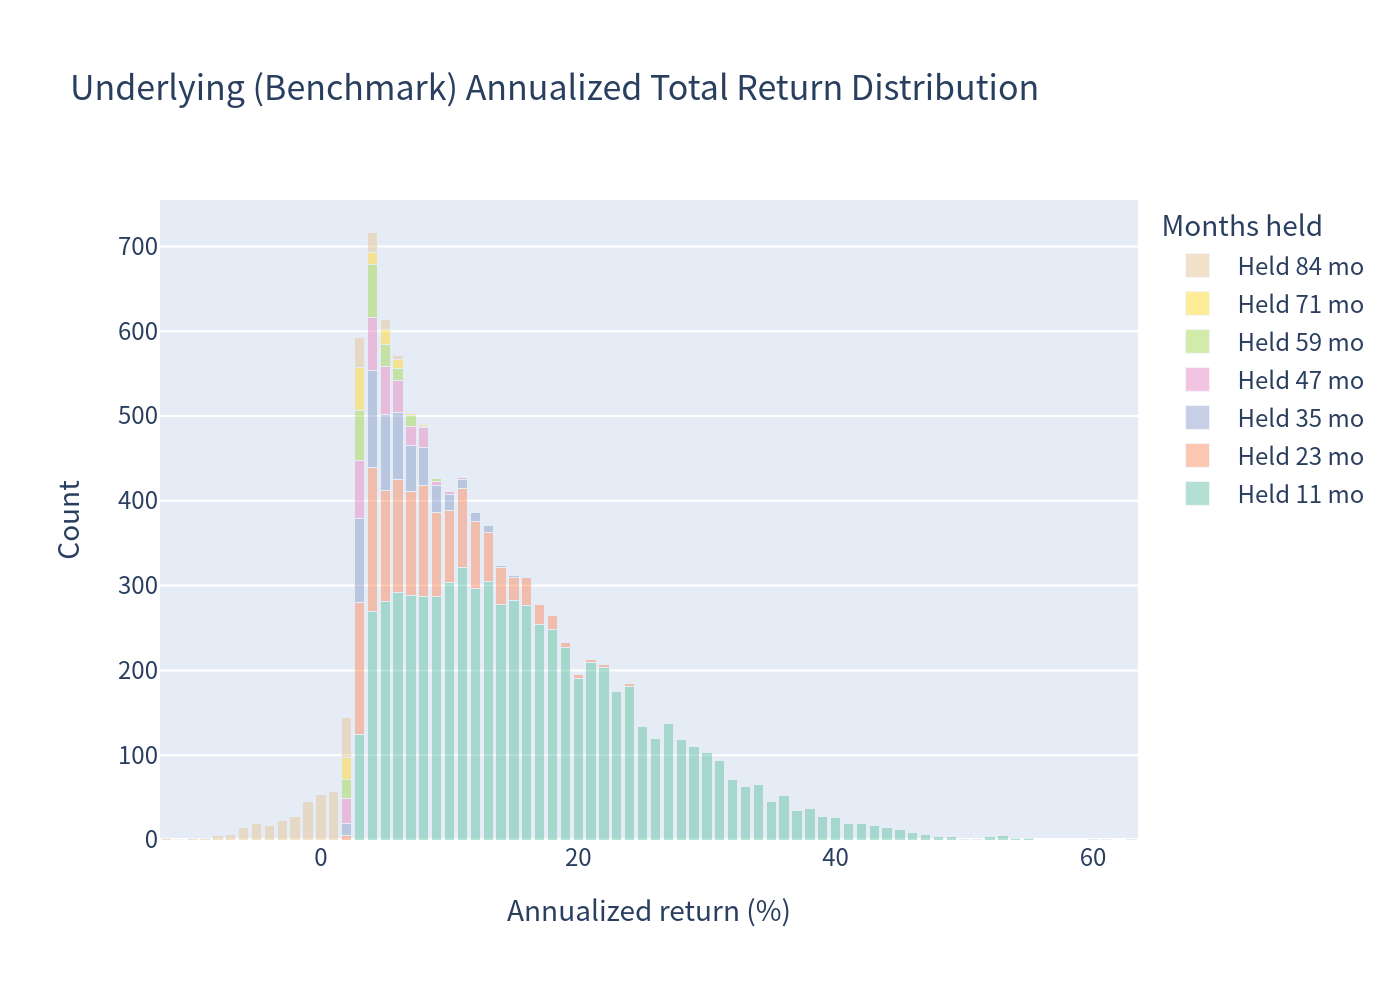
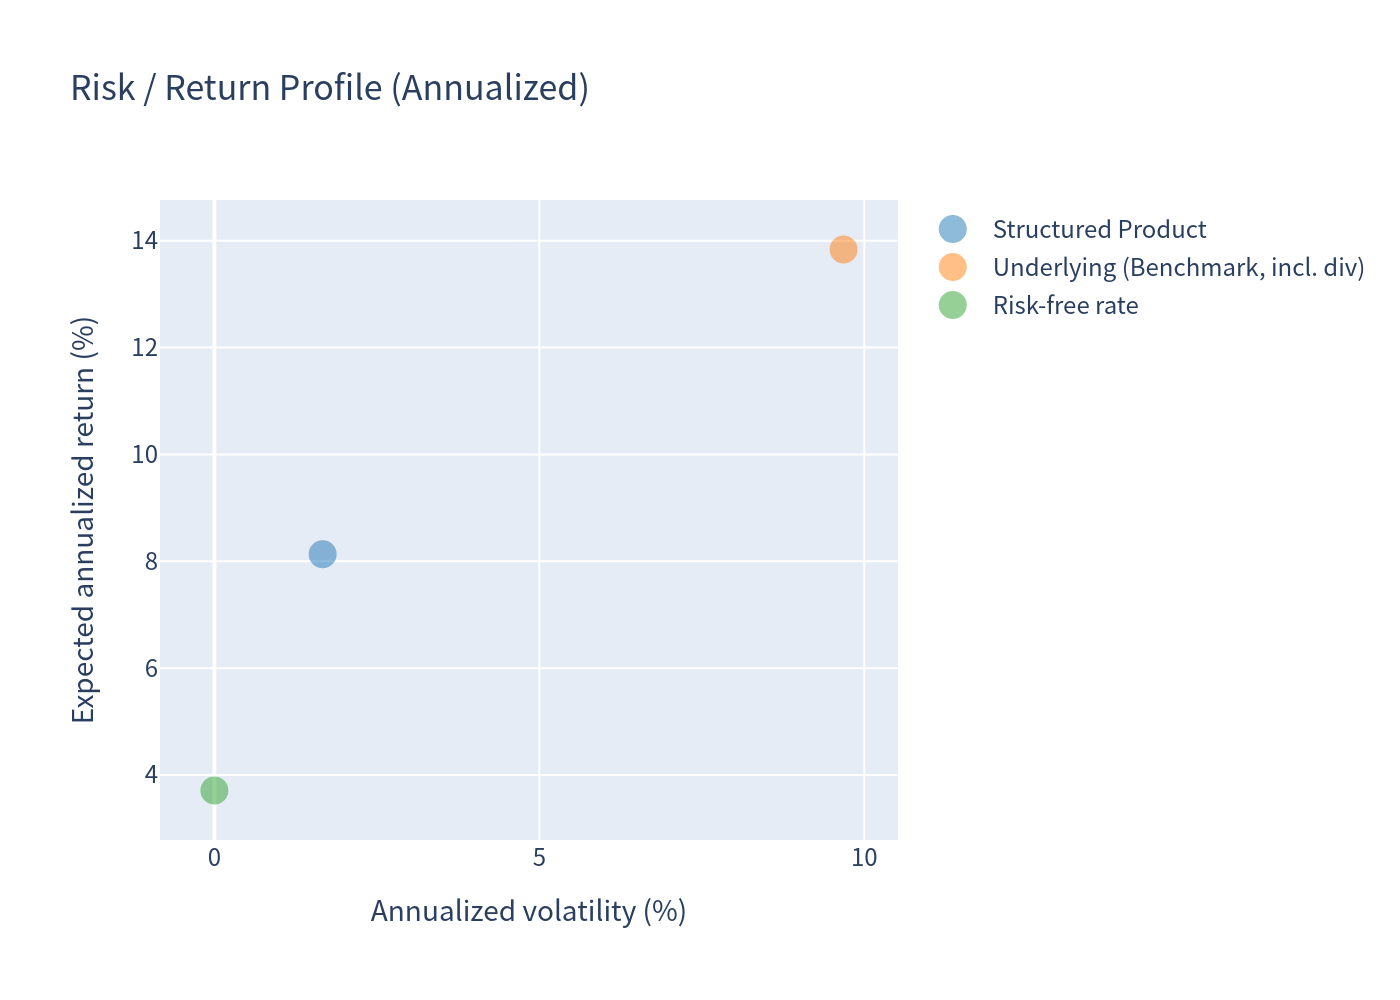
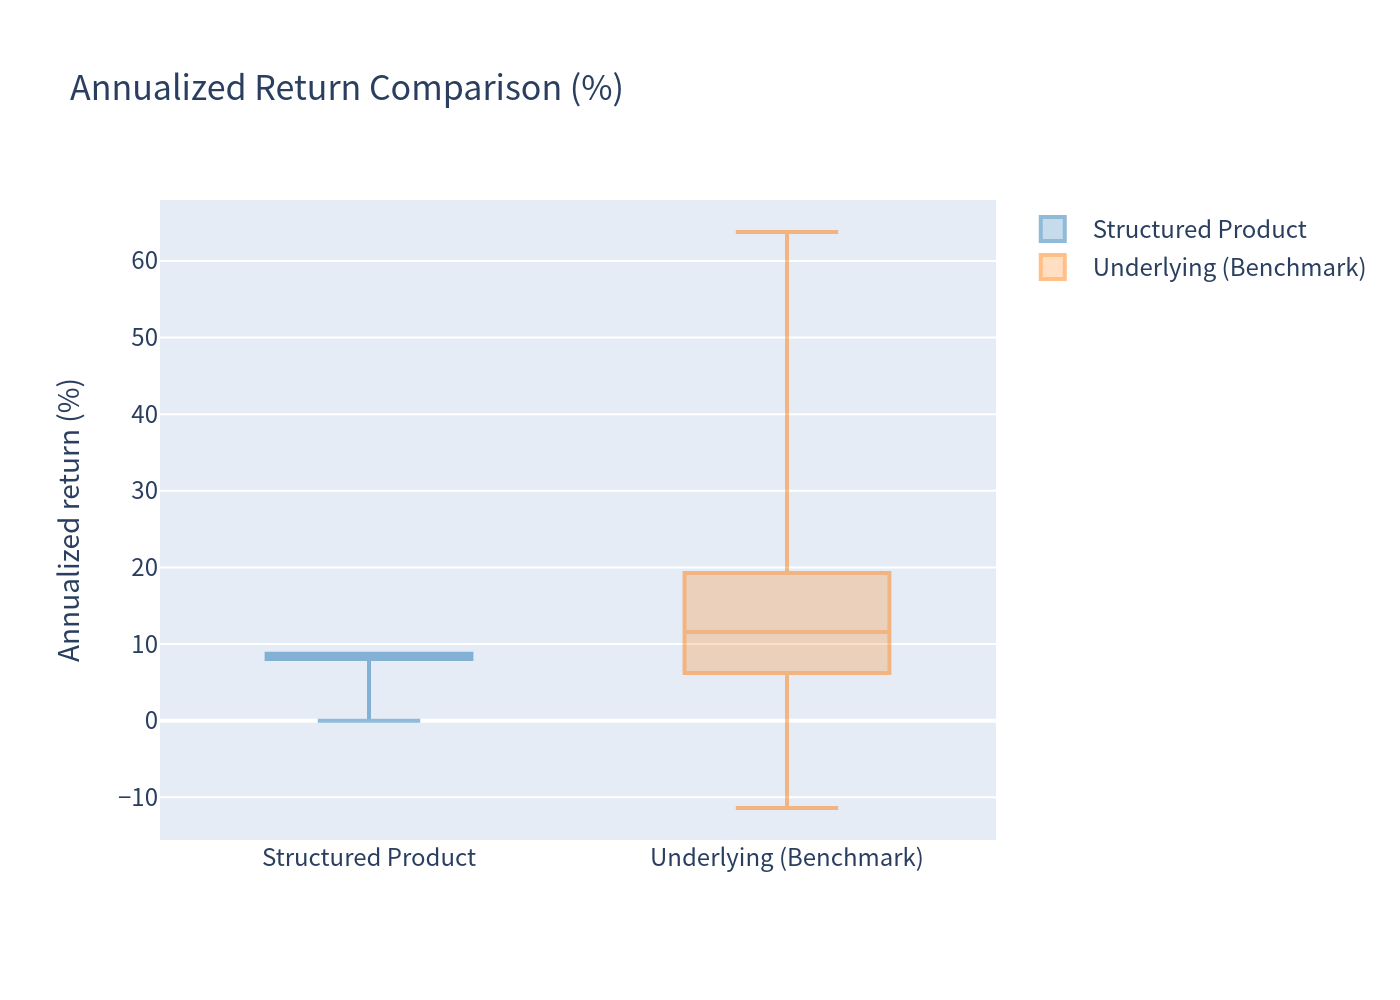
| Expected annualized return | 8.13% | 13.84% |
| Expected annualized volatility | 1.67% | 9.68% |
| Probability of loss | 0.00% | 1.67% |
| 99% confidence VaR (1-year) | 0.00% | -1.82% |
*Benchmark = proxy underlying index total return (price return + 2.45% dividend yield), measured over the same holding period as the product in each simulation.
Charts
Simulation outcomes — product return vs underlying return (color = years held)
Underlying / benchmark annualized total-return distribution (stacked by holding period)
Structured product annualized-return distribution (stacked by holding period)
Scenario probabilities
Risk / return profile
Annualized return box plot comparison
Holding-period distribution
Number of coupons paid
Investment Commentary
Pros (highlights)
- Full principal protection at maturity — the index can fall as much as it likes without causing a contractual loss (loss probability 0.00%); the worst outcome is a 0% total return over the full 7-year term (principal returned, no growth).
- Attractive, predictable call return of 8.00% p.a. — realized in ~96% of scenarios, with an expected holding period of only ~1.7 years.
- Very low return volatility (1.67% annualized) — payoffs are largely deterministic at the call amounts.
- Uncapped upside participation at maturity (100% participation) in the unlikely event the CD is never called.
Cons / considerations
- No periodic interest — all return is concentrated at redemption/maturity; there is no income during the term.
- Early redemption caps upside — even if the index rallies strongly, an auto-call pays only the fixed 8.00% p.a. amount.
- Zero-return tail — in ~3% of scenarios (index below initial level at all determination dates and at maturity), the investor receives only principal back: a 0% total return over the full 7 years, well below the ~3.71% risk-free alternative.
- Short expected holding period — 69.5% of scenarios are called at month 11, so annualized figures look high relative to the 8% total return actually received (8% over 11 months annualizes to ~8.7%). Total return and holding period should be interpreted together.
- Issuer / credit considerations — this is a bank obligation of Morgan Stanley Bank, N.A. (FDIC coverage limited and subject to terms); the estimated value of $897.40 is below the $1,000 deposit amount.
- Index risk — the Amplitude Index is new and unproven, embeds strategy costs, and involves risks from foreign markets, commodities, FX, rates and credit; a proxy was used for the analysis.