
Morgan Stanley Callable Jump Notes due September 5, 2031 — Simulation Analysis
Structured Product Evaluation • tokenengine.ai
Headline Simulation Results
| Metric | Value |
|---|---|
| Expected annualized return | 10.88% |
| Expected total return (realized holding period) | 31.10% |
| Expected holding period | 42.76 months (~3.56 years) |
| Probability of negative returns | 0.00% (principal protected) |
| 99% confidence VaR (1-year) | 0.00% |
| Probability of early redemption | 46.72% |
| Probability held to maturity | 53.28% |
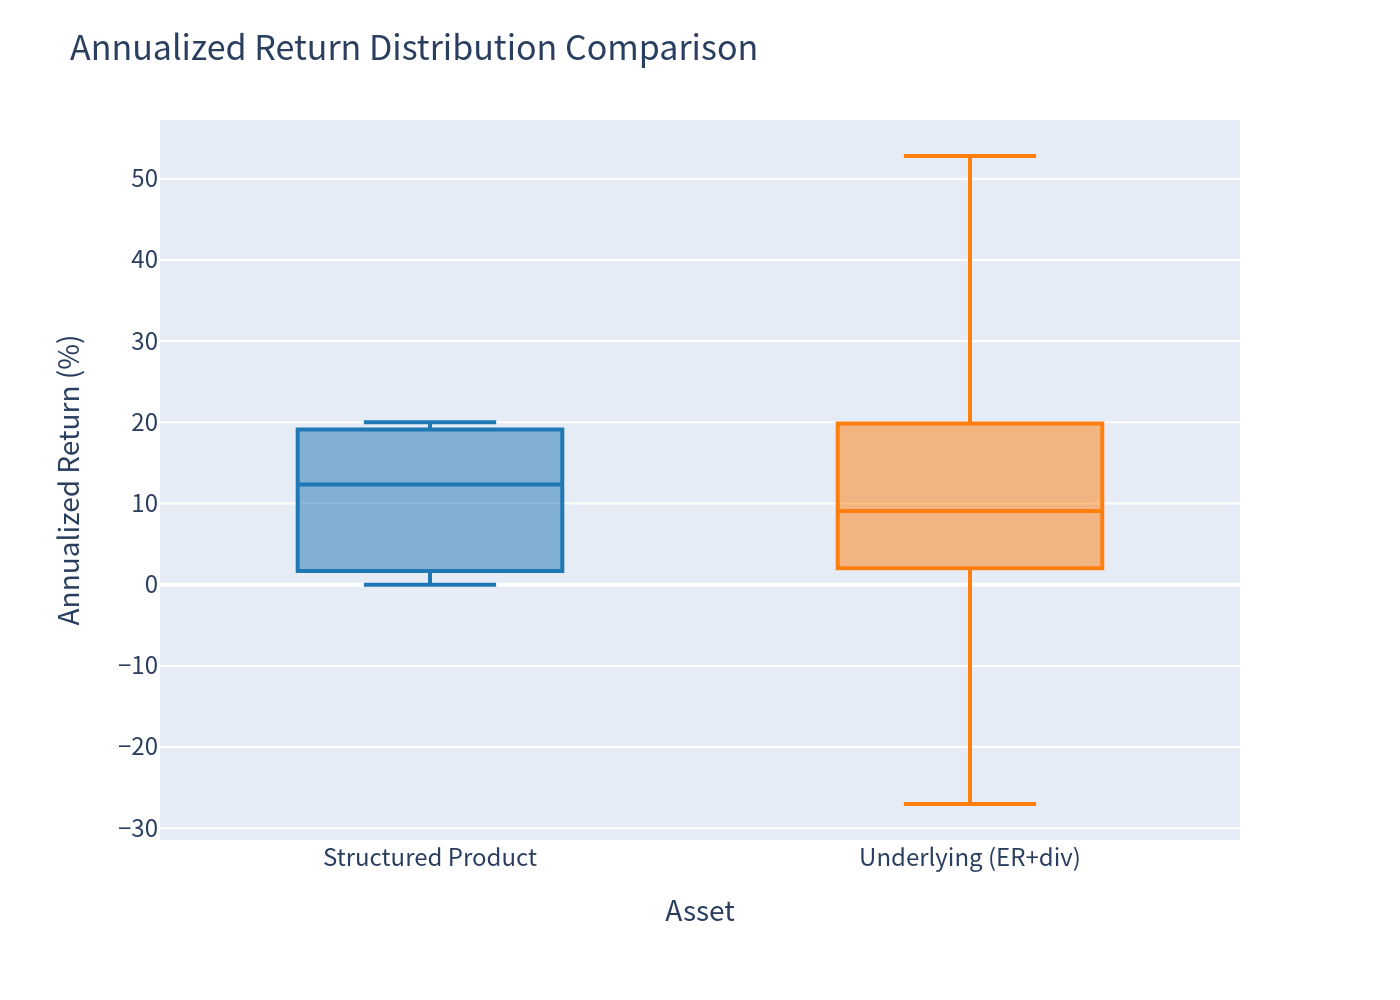
The note combines full principal protection at maturity with 160% upside participation and a monthly issuer call feature that pays escalating redemption amounts. In simulation, the product never produced a negative payoff; outcomes ranged from par (100 points, worst case) up to 215 points, with a median total return of 23.12%.
Basic Product Information
| Term | September 3, 2026 – September 5, 2031 (5 years, 60 months) |
| CUSIP / ISIN | 61781DKH0 / US61781DKH07 |
How it works (layman explanation)
- No regular coupons. The notes pay no periodic interest.
- Issuer call feature: Beginning in September 2027, Morgan Stanley may redeem the notes on any monthly redemption date (up to 48 dates) if its internal risk-neutral valuation model determines that redeeming is cheaper for the issuer than keeping the notes outstanding. Redemption payments start at 120% of principal (year 1) and rise by roughly 1.67 points per month to 198.33% by August 2031.
-
If never redeemed, at maturity (September 2031):
- If the underlier is above its initial level → investor receives principal + 160% × underlier gain (uncapped upside).
- If the underlier is at or below its initial level → investor receives principal only (never less than par).
- The note therefore behaves like a protected equity note: it participates in market gains (at 160%) with a floor at par, while the issuer retains the right to "call" the note early when doing so is economically attractive — typically after a meaningful rally in the underlier.
Key Statistics — Structured Product vs Underlying
| Metric | Structured Product | Underlying (ER Index + dividends)* |
|---|---|---|
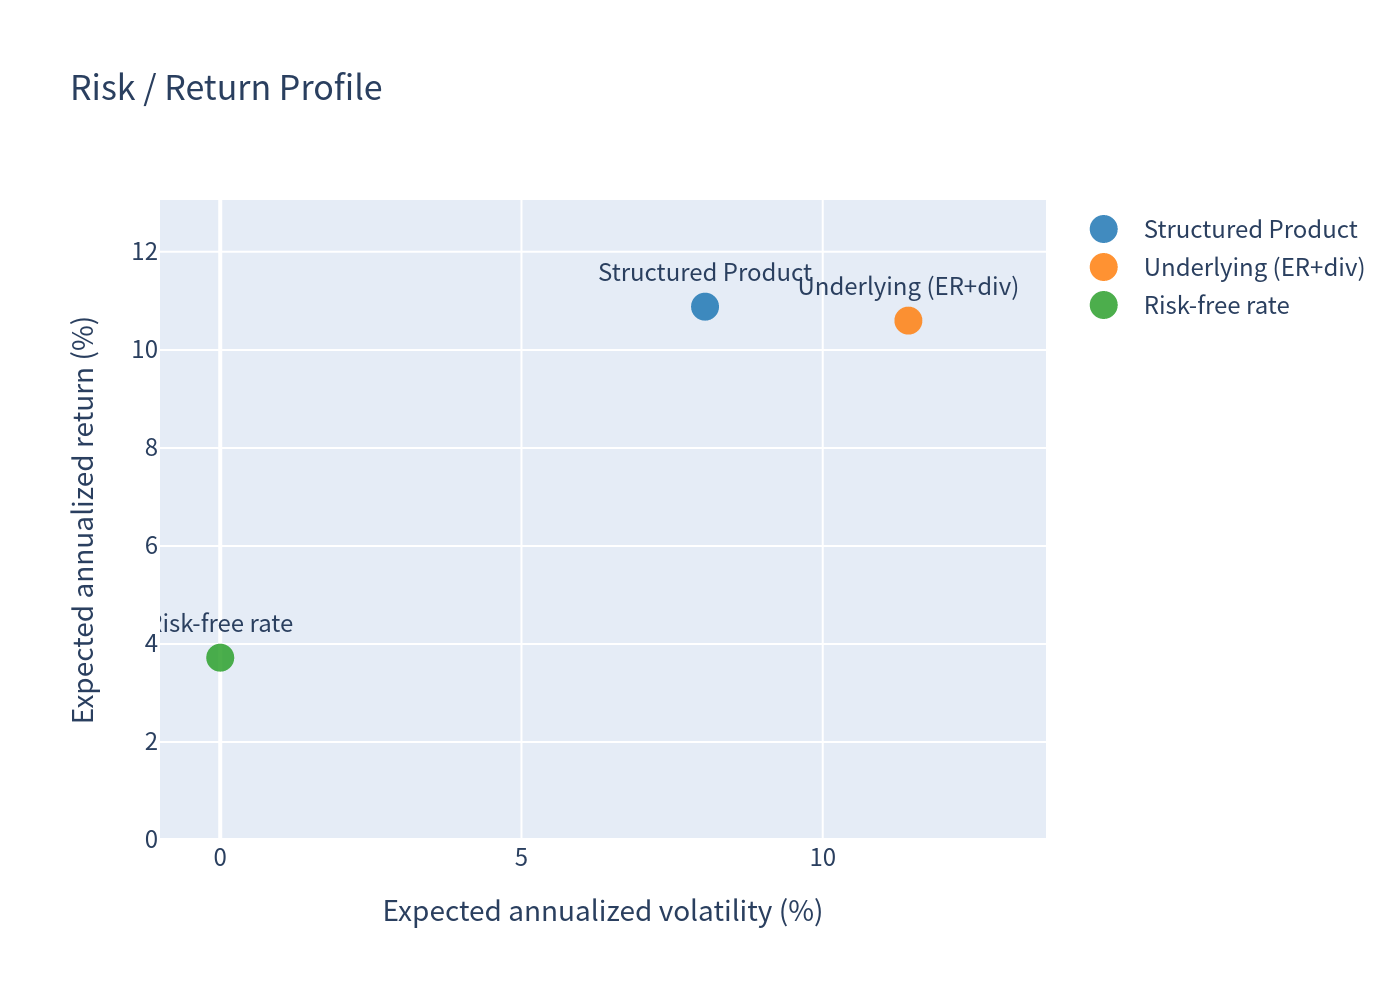
| Expected annualized return | 10.88% | 10.60% |
| Expected annualized volatility | 8.05% | 11.42% |
| Probability of loss | 0.00% | 18.26% |
| 99% confidence VaR (1-year) | 0.00% | −13.01% |
* The underlying comparison is a broad-market total-return benchmark (the excess-return index plus an estimated dividend yield) used to represent the alternative of holding the market directly. The note's payoff itself is based solely on the S&P 500 Futures Excess Return Index — no dividends enter the contract's payout calculation.
Outcome breakdown by path
- Called early (46.72%): average redemption payment 138.51 points; average total return +38.51% over an average of ~23 months (≈18.6% annualized).
- Held to maturity (53.28%): average payoff 124.61 points; average total return +24.61% (≈4.1% annualized). Of these, 31.86% of all paths received upside participation (underlier above initial level), while 21.42% received par only (underlier flat/down).
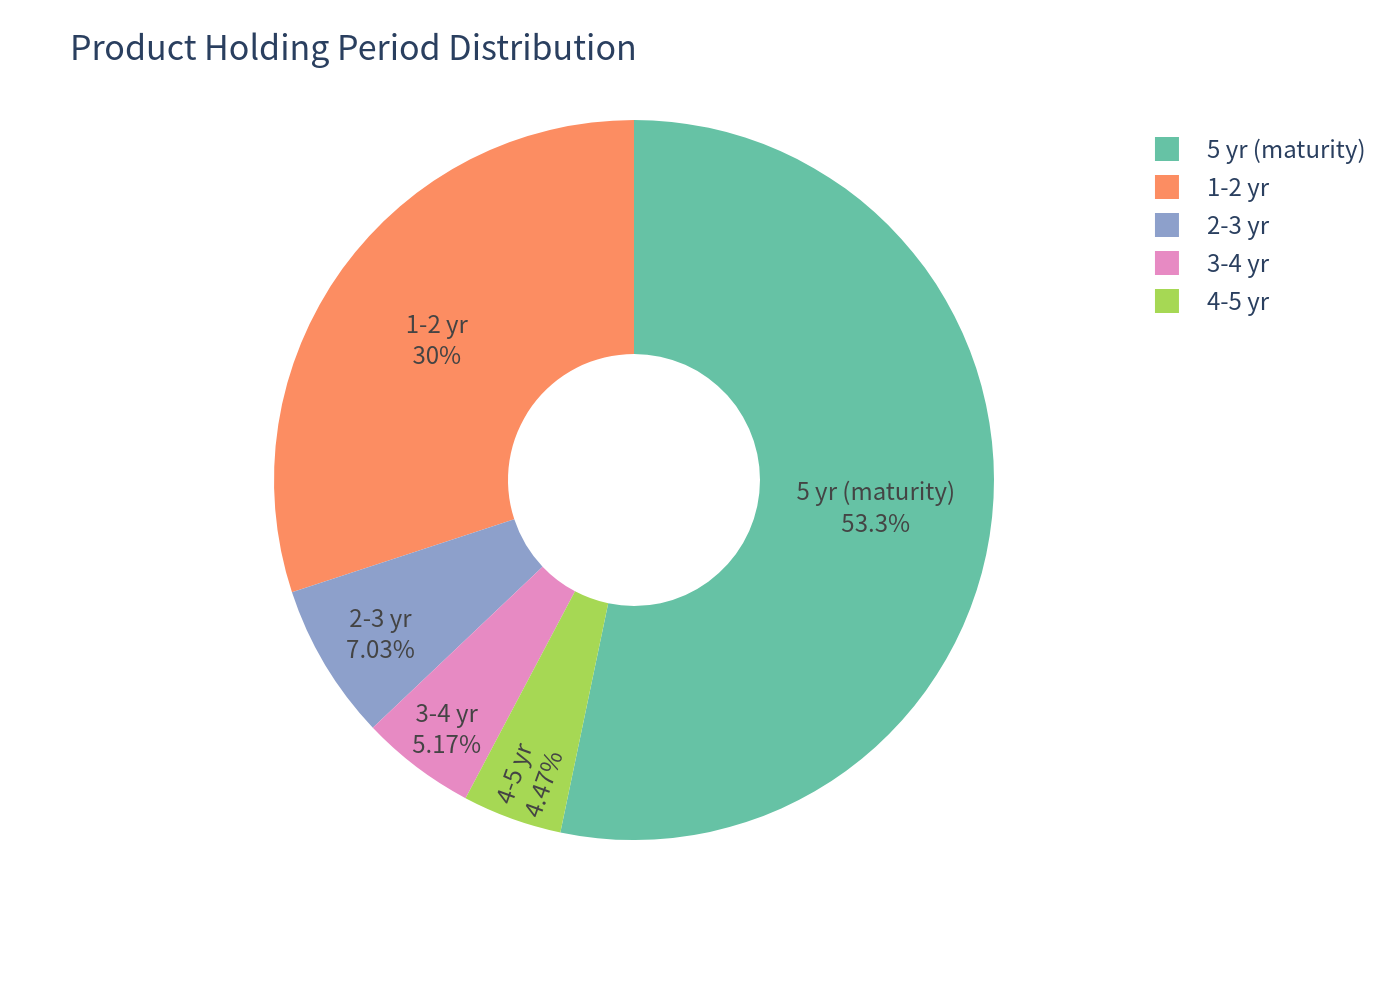
Note: because roughly 30% of simulations end within 1–2 years (early redemption), annualized figures should be read together with the expected holding period and total-return figures above.
Charts
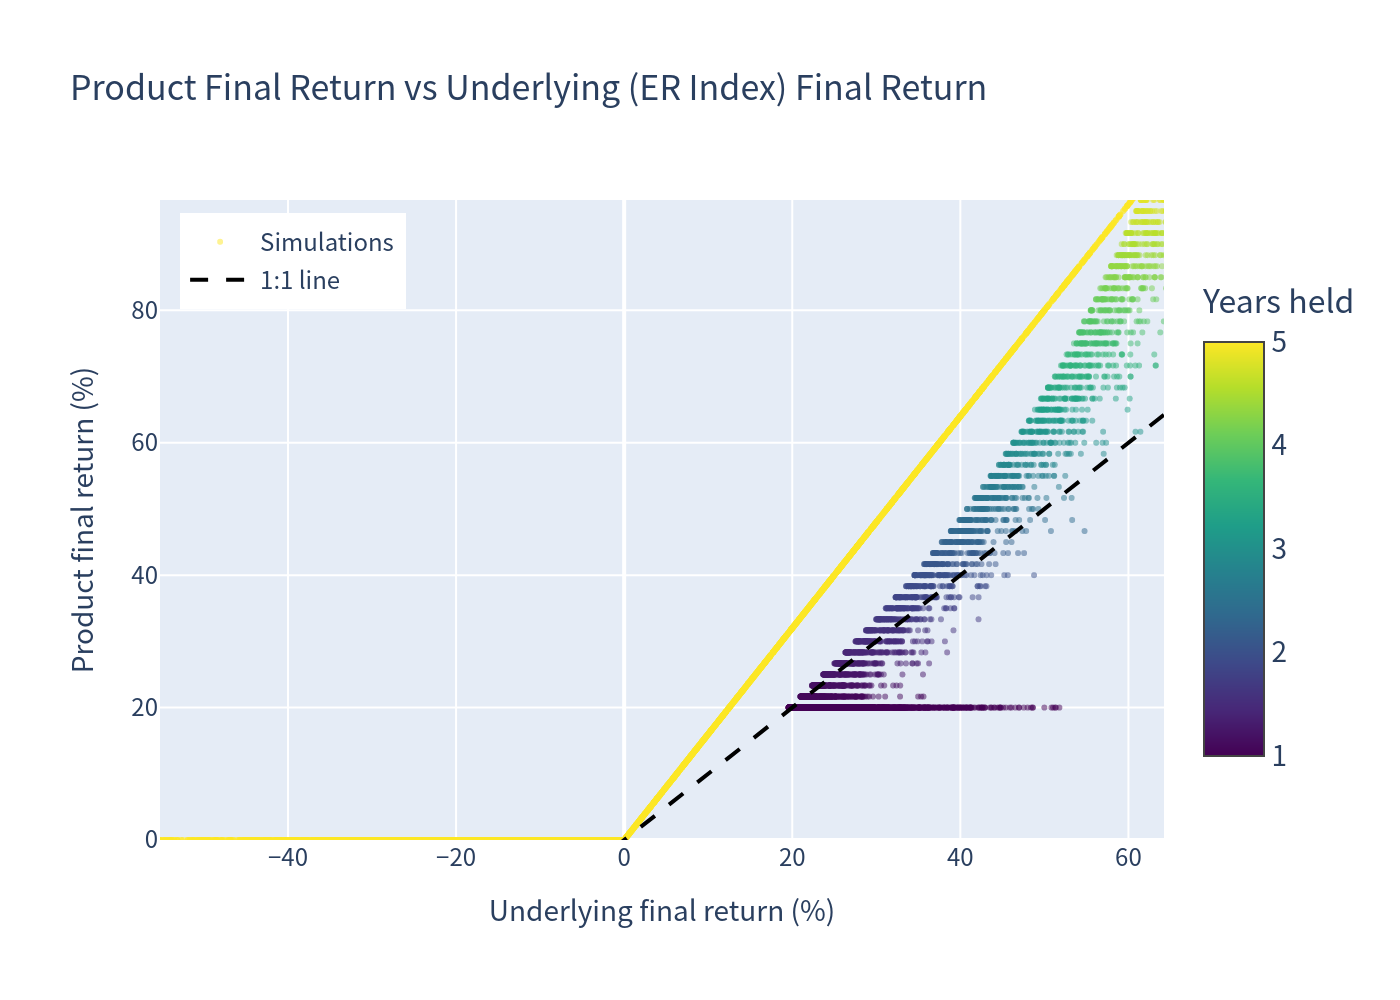
Final Return Scatter (Product vs Underlying)
Each simulated path plotted by product final return versus underlying final return.
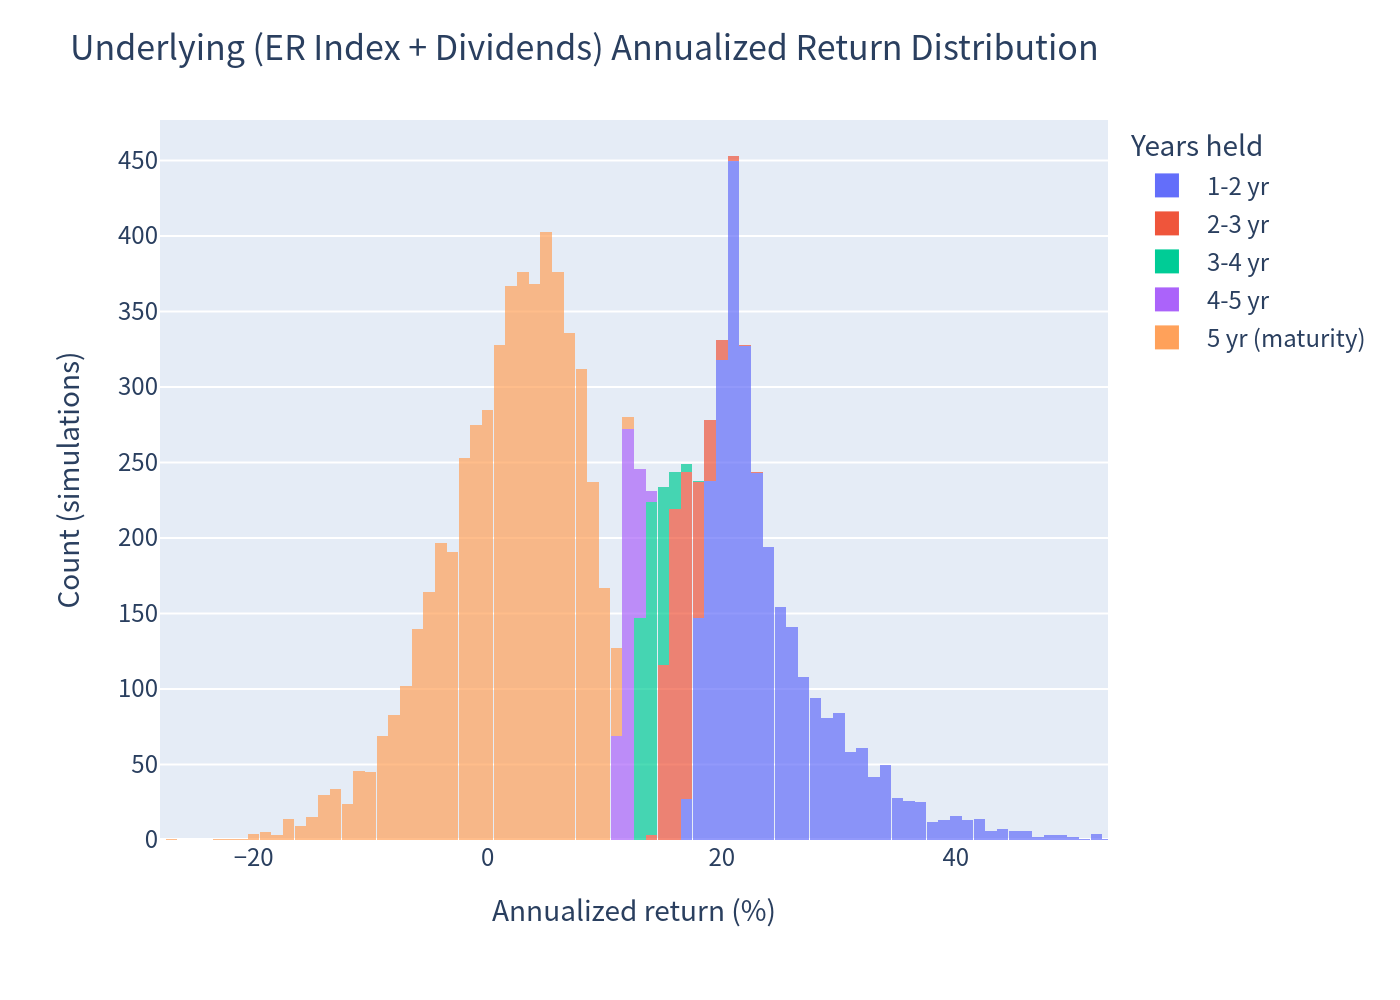
Annualized Return Distributions (1% bins, colored by holding period)
Distribution of simulated annualized returns for the underlying index benchmark.
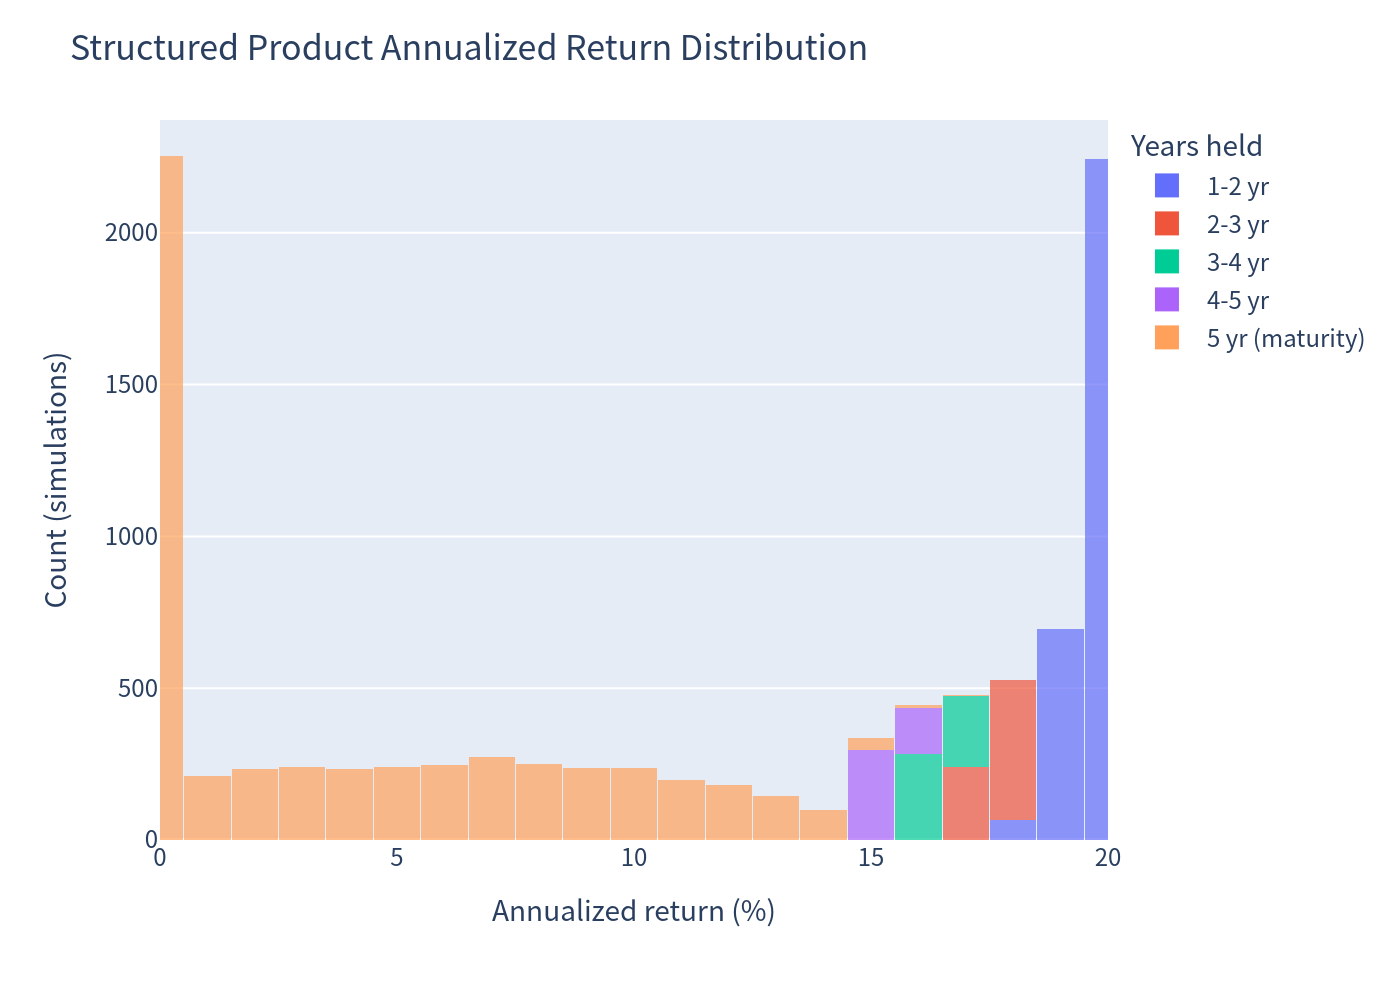
Annualized Return Distribution — Structured Product
Distribution of simulated annualized returns for the structured product, colored by holding period.
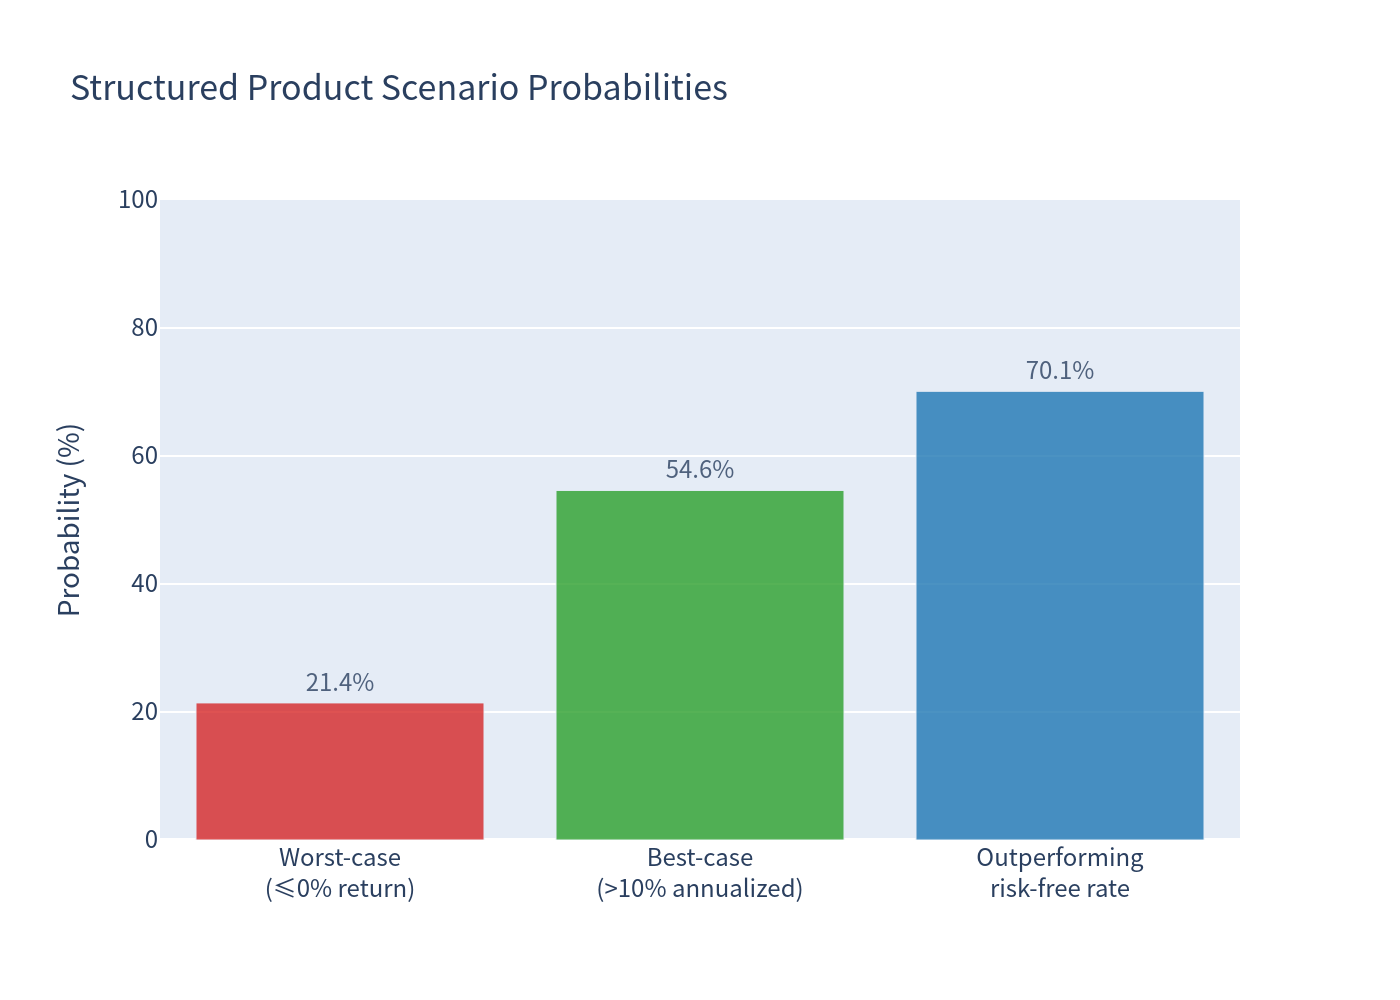
Scenario Probabilities
Probability of each payoff scenario: early redemption, upside at maturity, and par at maturity.
Risk / Return Profile
Risk (volatility) versus expected return positioning of the structured product and underlying benchmark.
Annualized Return Box Plot Comparison
Box plot comparison of annualized returns between the structured product and the underlying benchmark.
Holding Period Distribution
Distribution of simulated holding periods, driven by the monthly issuer call feature.
Investment Commentary
Positive characteristics
- Principal protection: payment at maturity is never below par — the simulated probability of a loss on the contractual payoff is 0.00%, versus 18.26% for the underlying index itself.
- Attractive return profile: the note delivered a higher expected annualized return (10.88%) than the underlying benchmark (10.60%) with materially lower volatility (8.05% vs 11.42%), driven by the escalating early-redemption payments and the par floor.
- High probability of outperforming cash: 70.11% of simulations beat the risk-free rate; 54.62% produced annualized returns above 10%.
- Uncapped upside at maturity with 160% participation, if the notes are not redeemed early.
Considerations
- Issuer call risk: the notes are redeemable at the issuer's discretion when its model indicates it is economical to do so — this typically occurs after strong underlier gains, effectively capping the investor's upside in those scenarios (early redemption payments of 120%–198% are received instead of continued participation).
- No regular income: the note pays no coupons; returns are realized only via early redemption or at maturity.
- Credit risk: all payments depend on Morgan Stanley Finance LLC / Morgan Stanley creditworthiness.
- Opportunity cost: in strongly rising markets where the note is not called, participation is 160% but the return is still limited versus direct equity ownership in the very best tail scenarios (the issuer calls in most strong-rally paths).
This analysis is for informational purposes only and does not constitute financial advice or a suitability assessment.