
Worst-of NDXT, RTY and SPX Callable Jump Notes due September 5, 2031 — Investment Analysis
Headline Simulation Results
| Metric | Value |
|---|---|
| Expected annualized return | 6.32% |
| Expected total return (over realized holding period) | 26.15% |
| Expected holding period | 51.32 months (~4.28 years) |
| Probability of negative return | 0.00% |
| 99% confidence VaR (1 year) | 0.00% |
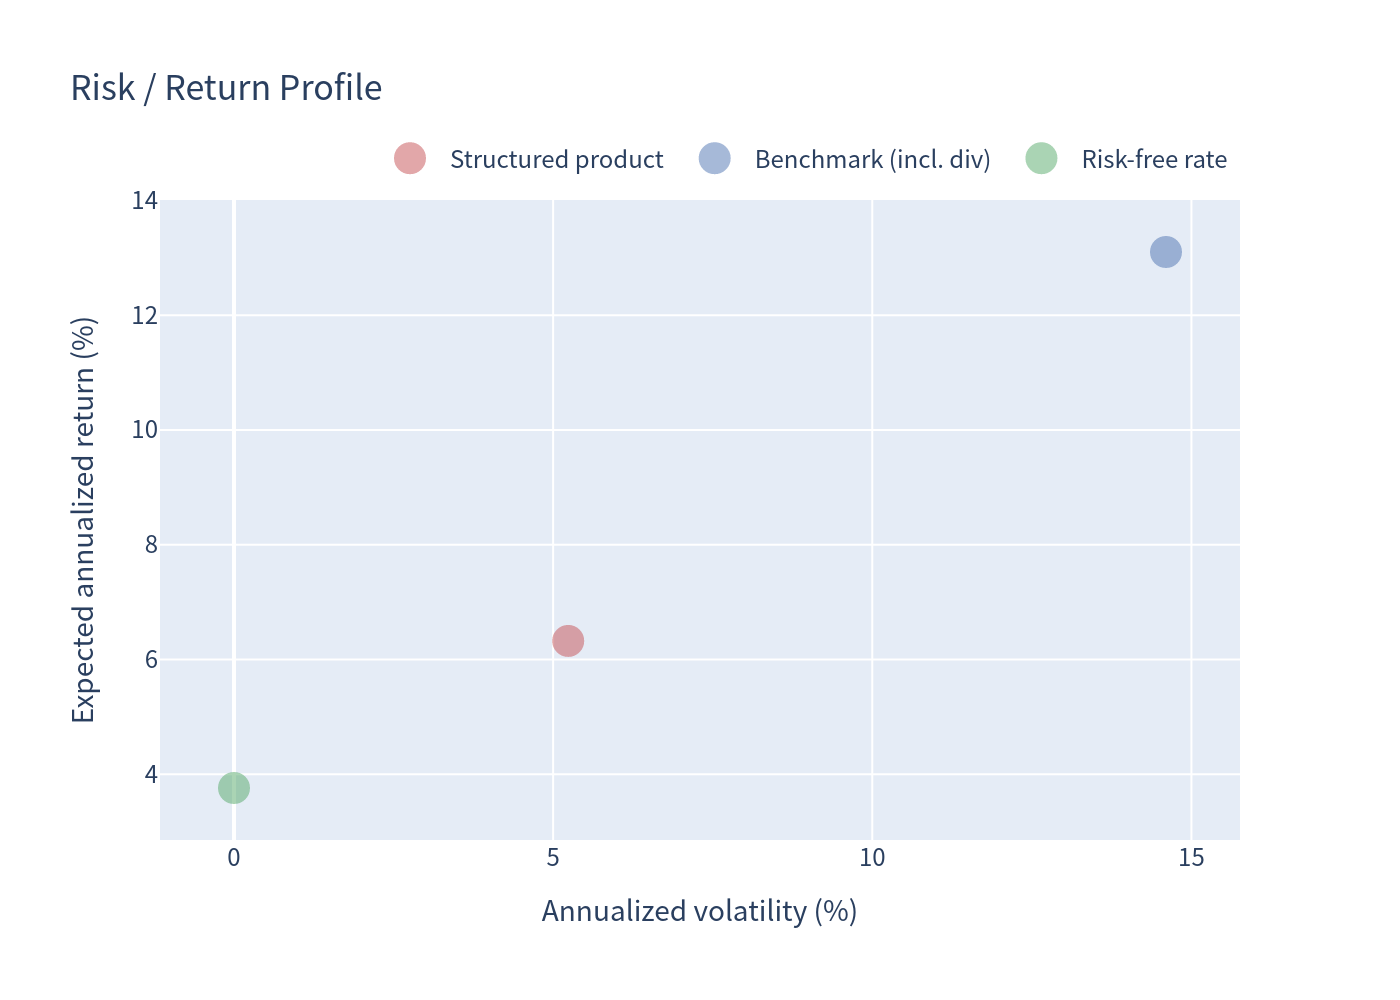
| Annualized volatility of returns | 5.24% |
| Probability of outperforming risk-free rate | 59.36% |
The product never produced a negative return in simulation: it offers 100% principal protection at maturity combined with 125% upside participation on the worst performing index. Its principal risk is opportunity cost — in roughly 30% of scenarios it returns only par (0% total return), which is below the risk-free rate.
Basic Product Information
- Issuer: Morgan Stanley Finance LLC (guaranteed by Morgan Stanley)
- Type: Issuer-callable "Jump" note linked to the worst performing of three indices
- Underlyings: Nasdaq-100 Technology Sector Index (NDXT), Russell 2000 Index (RTY), S&P 500 Index (SPX)
- Coupon: None (the notes do not pay interest)
- Participation rate: 125% on the worst-of upside
- Principal protection: 100% at maturity (subject to issuer credit risk)
- Maturity: September 5, 2031 (priced August 31, 2026)
How It Works (in plain terms)
You pay $1,000 per note and receive no periodic interest. The return depends on the worst performing of the three indices:
- If not redeemed early: At maturity you always receive at least your $1,000 back. If the worst performing index has risen, you receive $1,000 plus 125% of that rise (e.g., a +20% worst index = $1,250; a −40% worst index = $1,000). There is no downside participation.
- Early redemption: Starting one year after issue (monthly), Morgan Stanley may redeem the notes early if its risk-neutral valuation model determines it is economically rational to do so. Early redemption pays a fixed, increasing amount — from $1,135 at the first call date up to $1,663.75 at the final call date per $1,000 note. If the note is redeemed, the investor receives the fixed amount and the note ends.
Because the issuer calls when the note is most valuable, investor upside in called scenarios is capped by the fixed redemption schedule. However, the final redemption date is one month before maturity, so in about 5% of scenarios a late rally in the worst performing index produces a maturity payoff above the maximum redemption payment (a characteristic "jump" of this product).
Key Statistics — Structured Product vs Benchmark
Benchmark = equal-weight basket of the three underlyings (price performance plus dividends).
| Metric | Structured Product | Benchmark (incl. dividends) |
|---|---|---|
| Expected annualized return | 6.32% | 13.10% |
| Expected annualized volatility | 5.24% | 14.60% |
| Probability of loss | 0.00% | 17.16% |
| 99% confidence VaR (1 year) | 0.00% | −12.88% |
| Best simulated total return | +117.08% | — |
The structured product delivers a much lower expected return and volatility than direct index exposure, reflecting the cost of full downside protection and the issuer's early redemption right.
Holding Period and Redemption Behavior
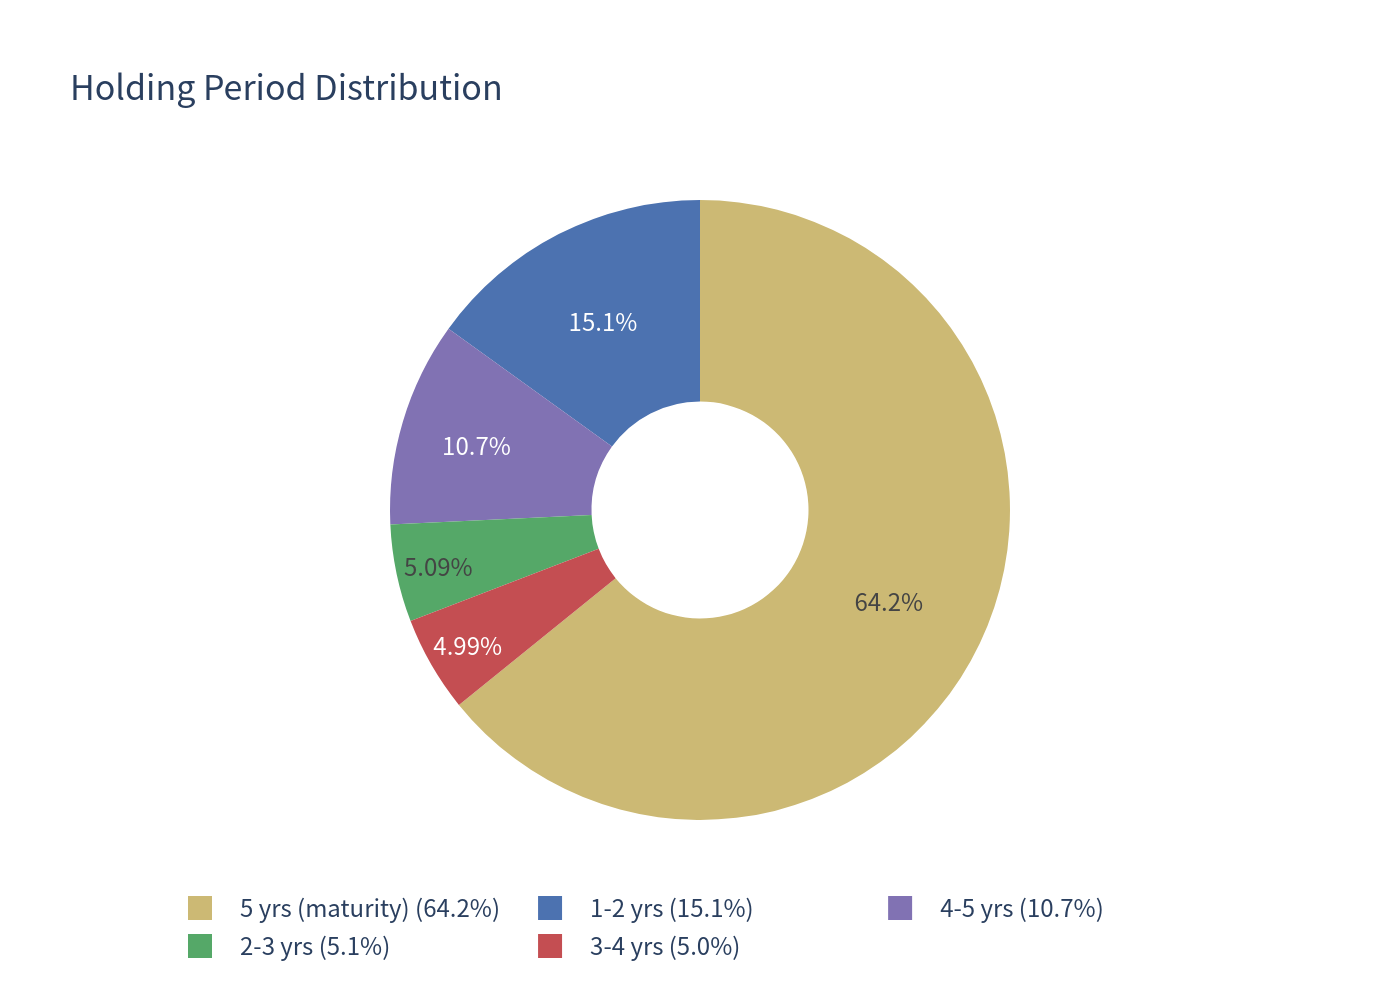
- Early redemption: 35.82% of simulated scenarios (mostly when the worst-of basket has risen sharply).
- Held to maturity: 64.18% of scenarios.
- Par-only outcome (0% total return): 30.48% — the worst performing index finished below its start, so the note pays exactly par at maturity.
- Maturity payoff above maximum redemption payment: ~5.13% of scenarios — the worst-of rose above the last call threshold in the final month before maturity.
Because the expected holding period is long (~4.3 years) and most scenarios run to maturity, annualized figures are not distorted by very short holding periods. Note that for scenarios redeemed early, the annualized return can look higher even though the total dollar gain is fixed by the redemption schedule — total return and holding period should be read together.
Charts
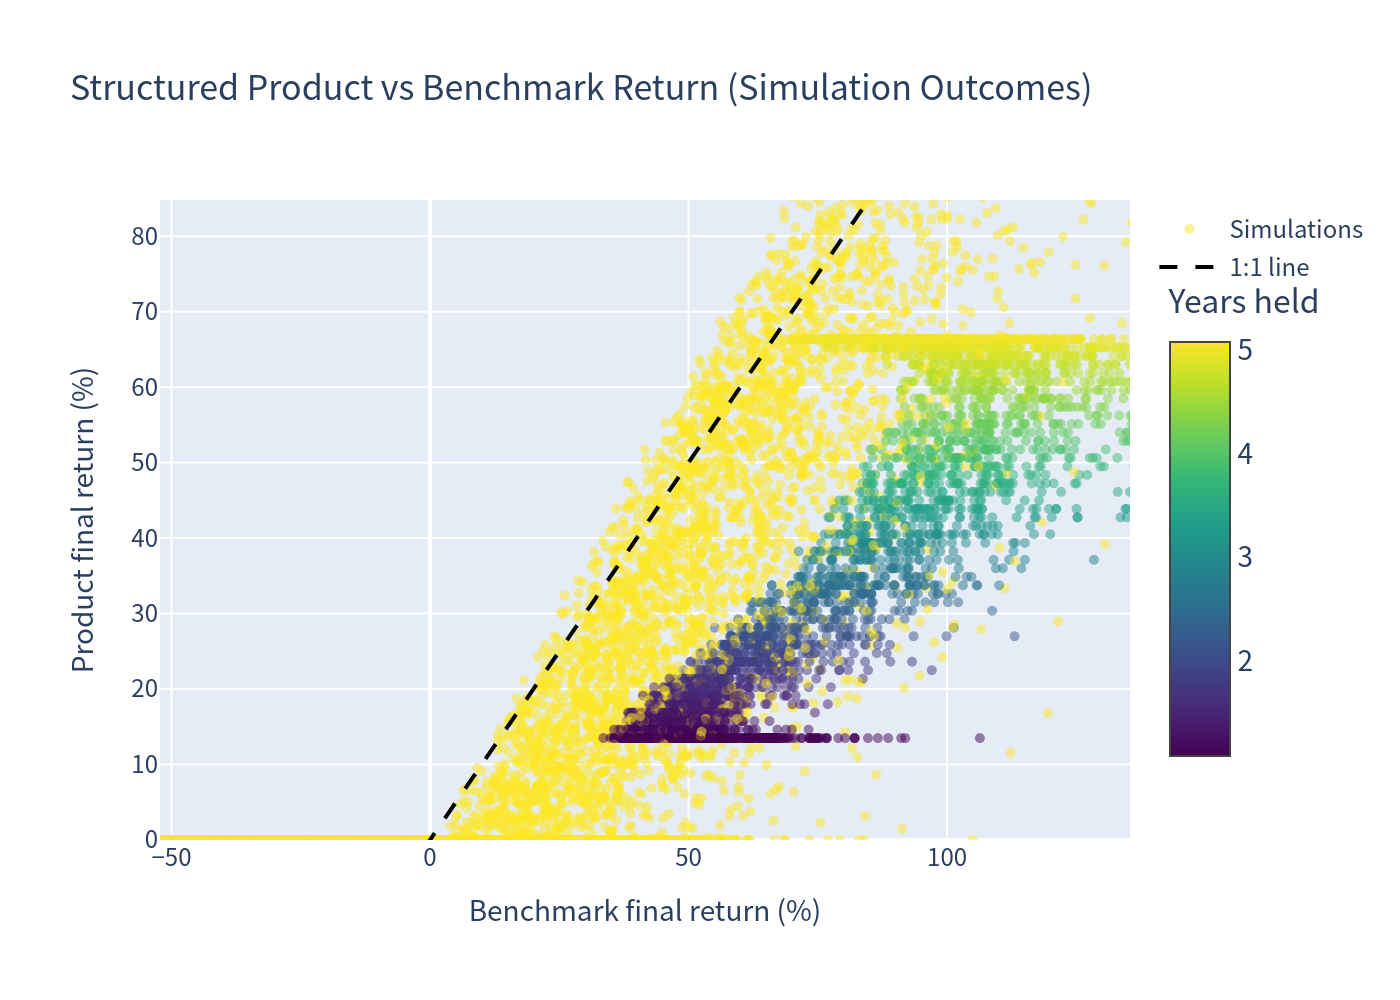
Simulation Outcomes (Product vs Benchmark Return)
Scatter of simulated total returns for the structured product against the benchmark basket.
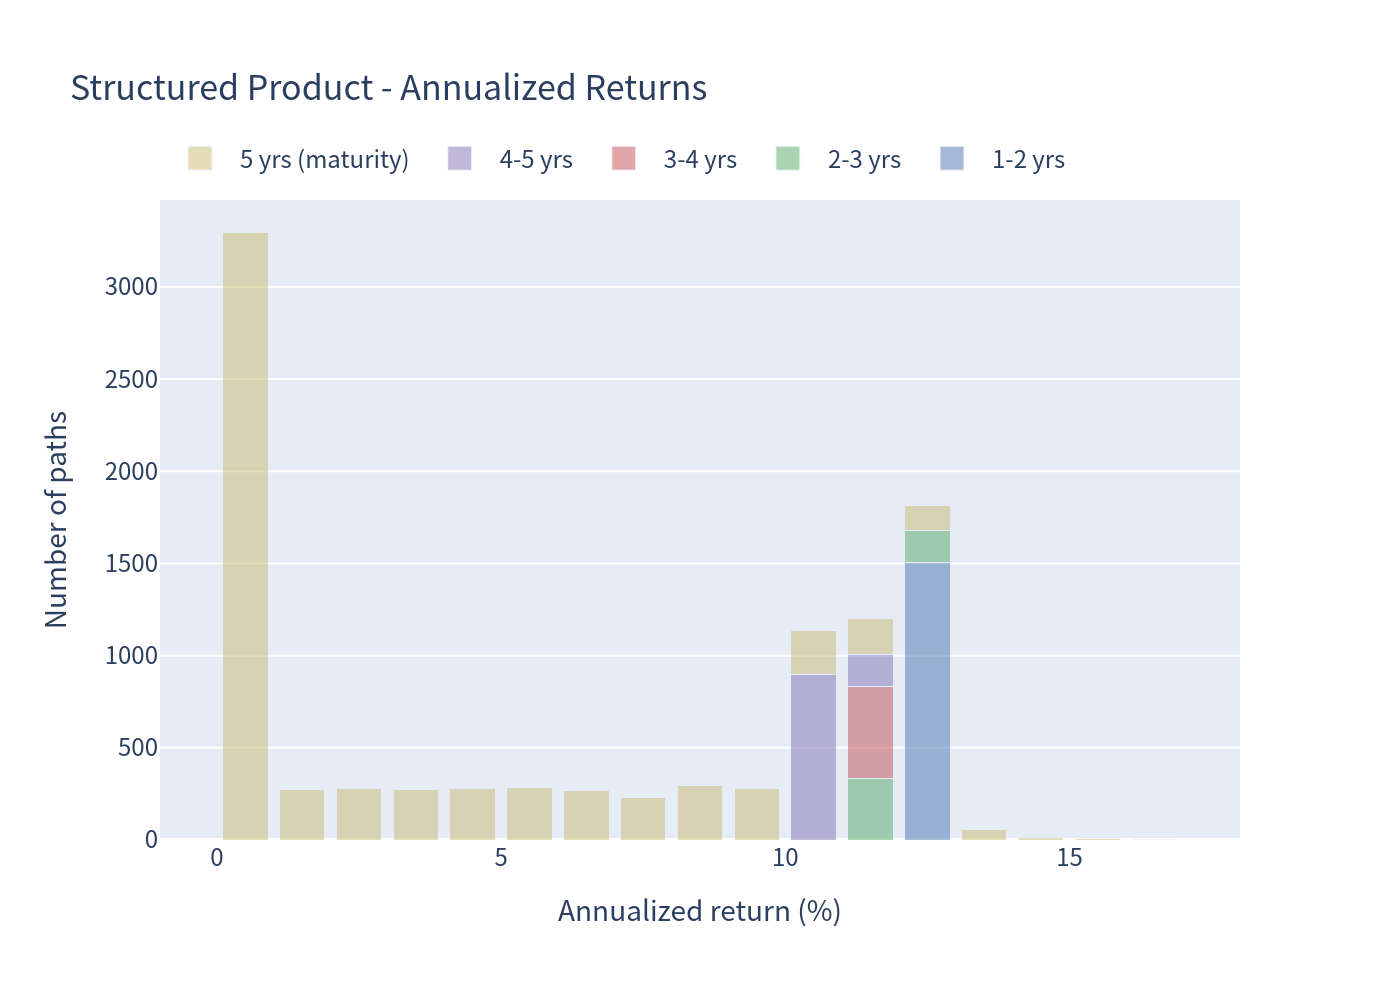
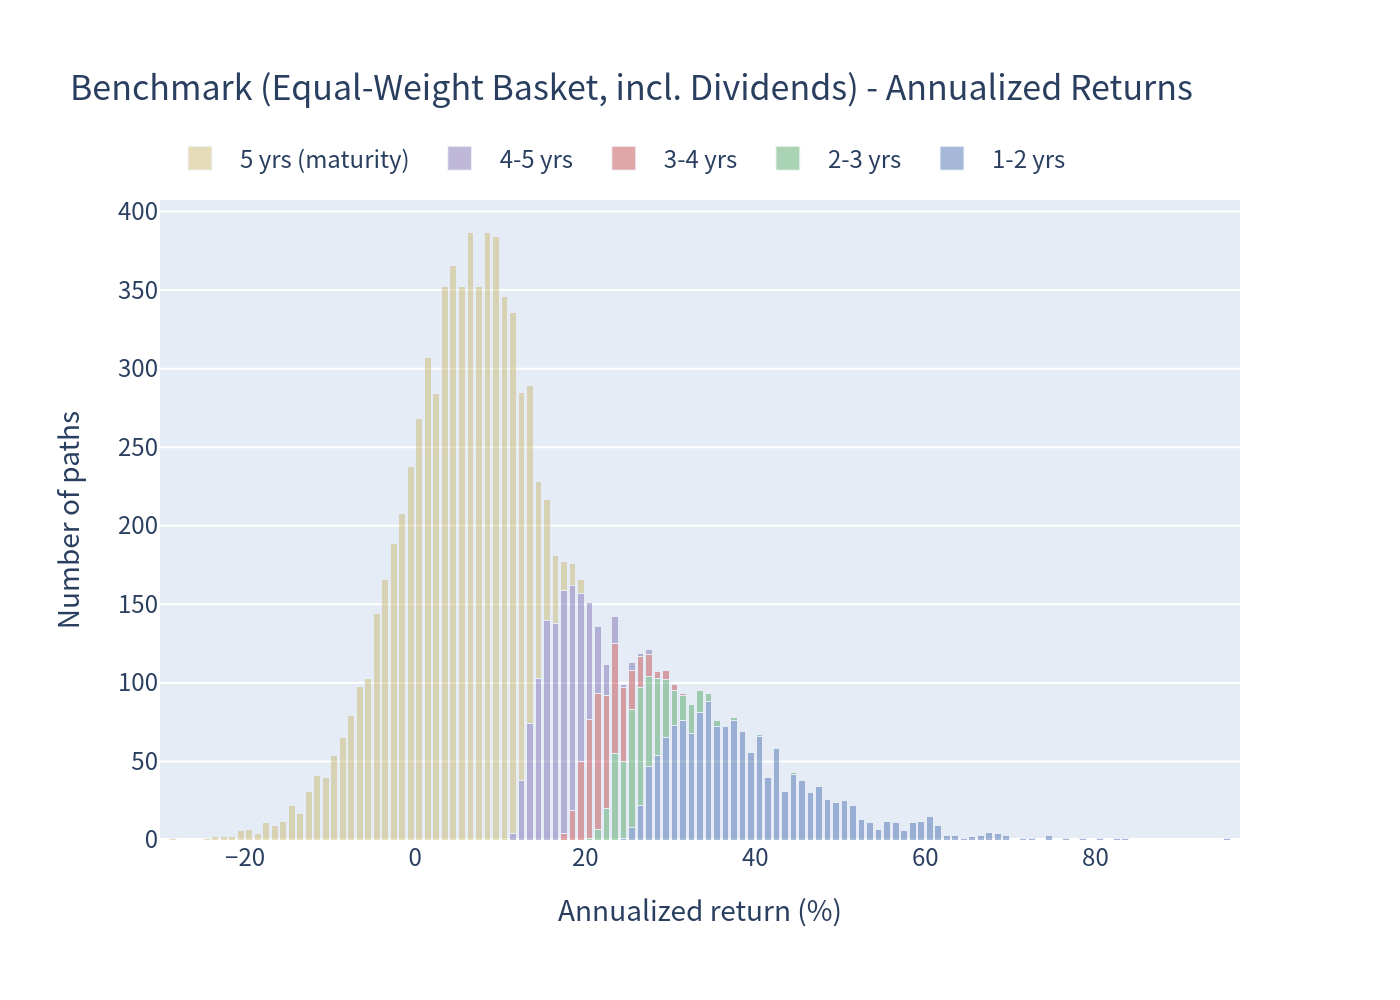
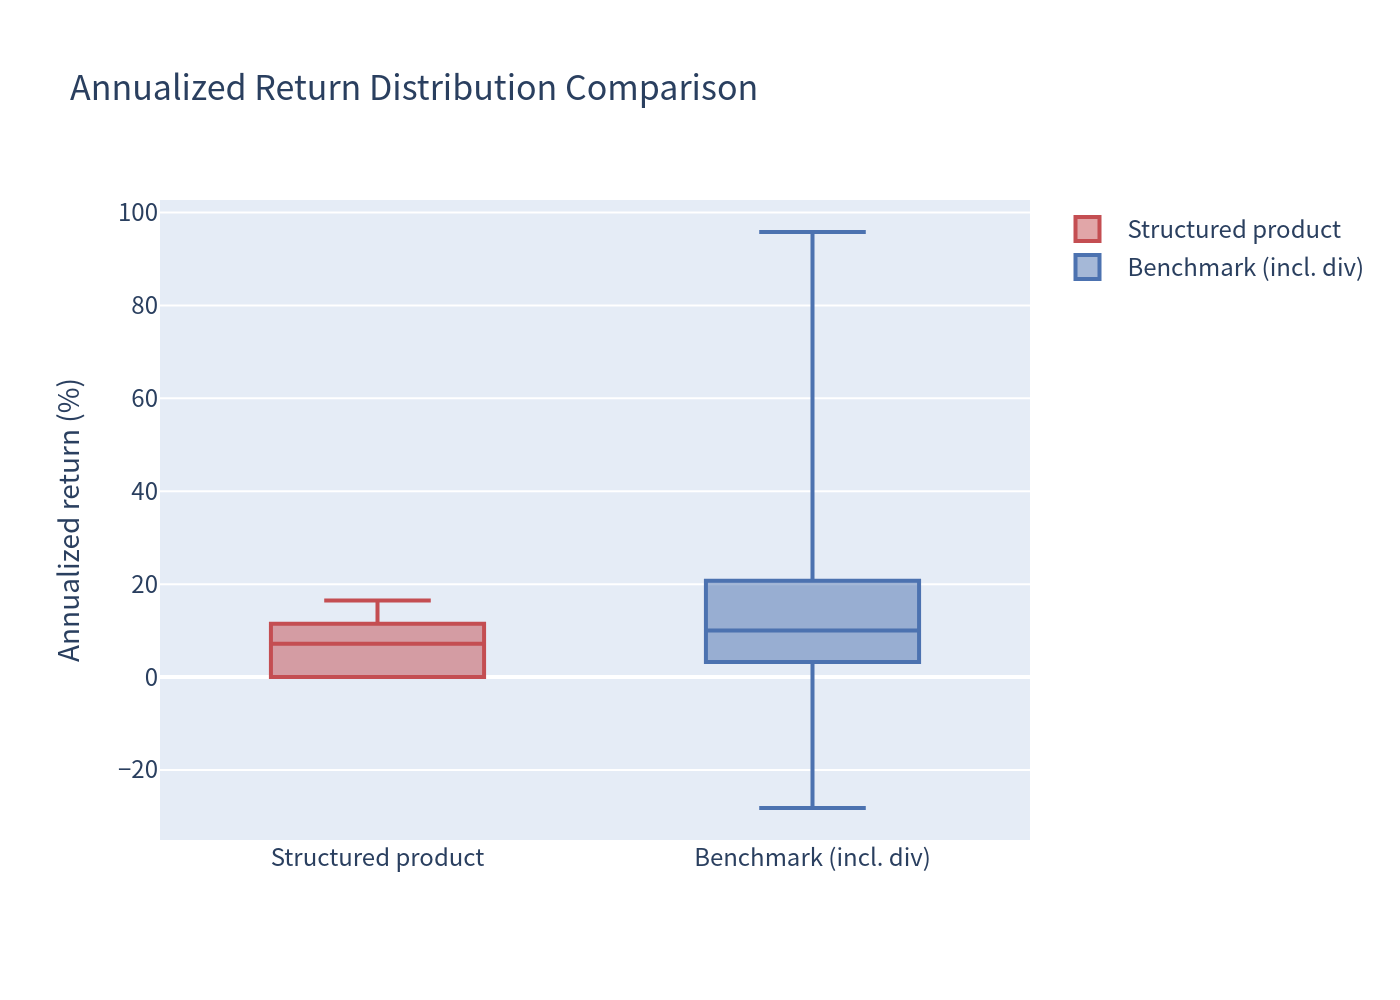
Annualized Return Distributions
Distribution of annualized returns for the structured product (left) and the benchmark (right).
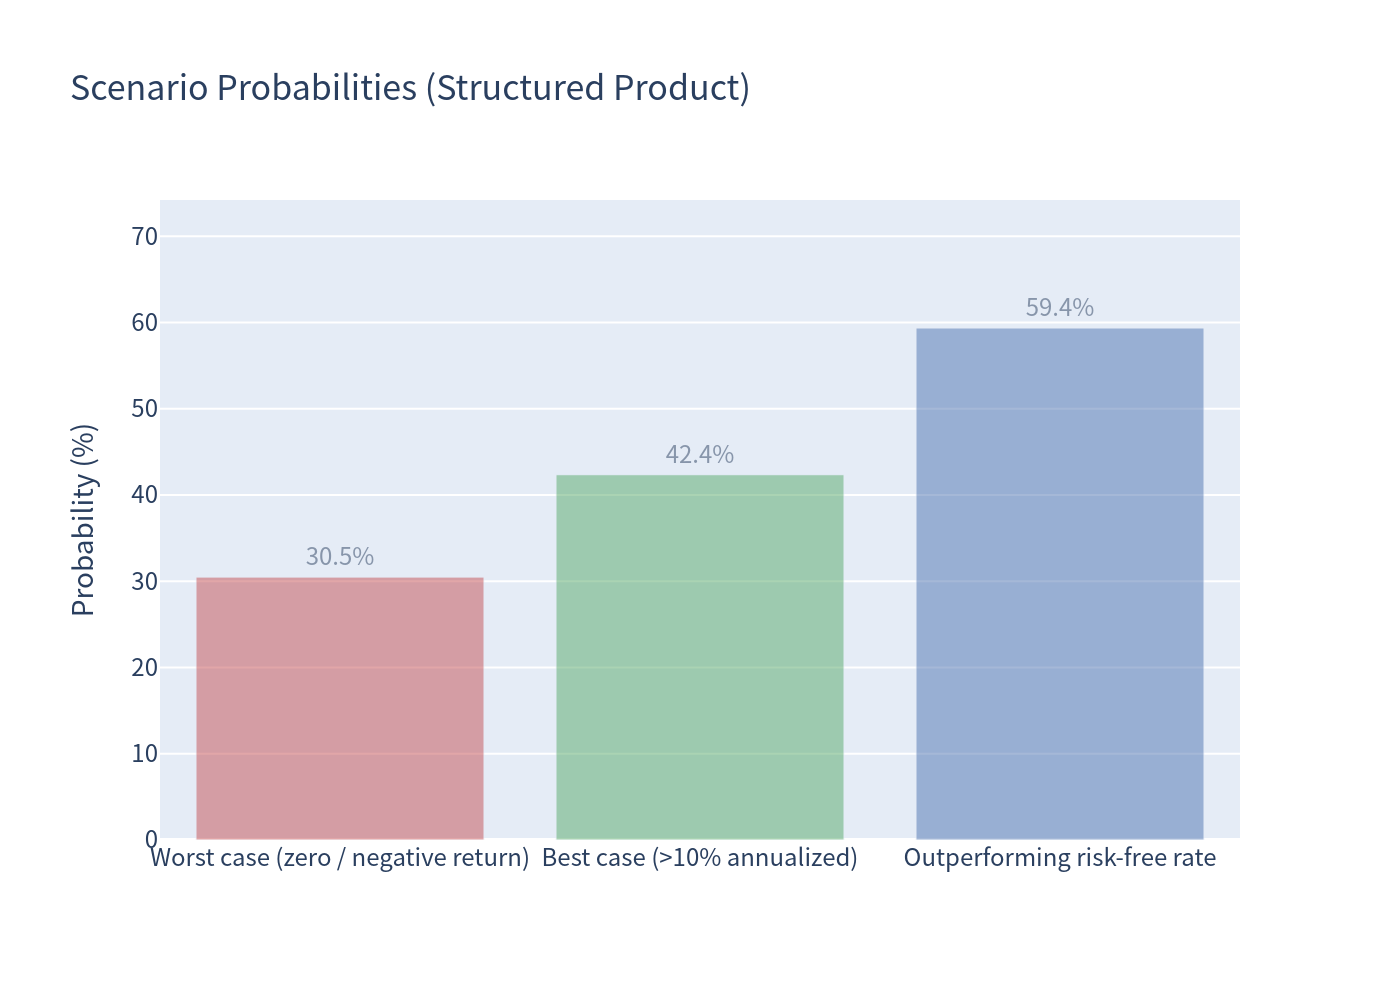
Scenario Probabilities
Probability of each outcome category: early redemption, held to maturity, par-only, and jump payoff.
Risk / Return Profile
Risk-return positioning of the structured product relative to the benchmark.
Return Distribution Comparison
Boxplot comparing the distribution of total returns between the product and the benchmark.
Holding Period Distribution
Distribution of the realized holding period across simulated scenarios, by year bucket.
Investment Commentary
Key Strengths
- Full downside protection at maturity — the simulated probability of a loss is 0%; the worst outcome is getting your $1,000 back.
- Attractive upside capture when markets rise — 125% participation on the worst-of index, with early redemption paying fixed premiums of +13.5% to +66.4% over the term.
- Low return volatility (5.24% annualized) — outcomes are tightly clustered relative to direct equity exposure.
- Positive return in ~69.5% of scenarios, and outperformance of the risk-free rate in ~59.4% of scenarios.
Key Considerations
- No interest or coupons are paid; a par-only outcome (30.5% probability) delivers a 0% total return over up to five years, below the risk-free rate.
- Upside is capped in most scenarios by the issuer's early redemption right — the issuer redeems the note precisely when it has become most valuable, converting a potentially larger maturity gain into a fixed redemption payment.
- Worst-of structure means returns are governed by the weakest of the three indices, so the expected return is lower than for a single-index or best-of note.
- The expected return (6.32%) is well below the benchmark's (13.10%); the difference is the price of the embedded protection and the issuer's call option.
- All payments are subject to issuer credit risk (MSFL / Morgan Stanley guarantee).
This analysis is for informational purposes only and does not constitute financial advice or a suitability assessment.