
Structured Product Analysis
Headline Simulation Results
| Metric | Result |
|---|---|
| Expected annualized return | 5.17% |
| Probability of negative return | 18.69% |
| 99% confidence VaR (1-year) | −19.46% |
| Expected holding period | 19.51 months (≈1.63 years) |
| Expected total return over the realized holding period | 7.53% |
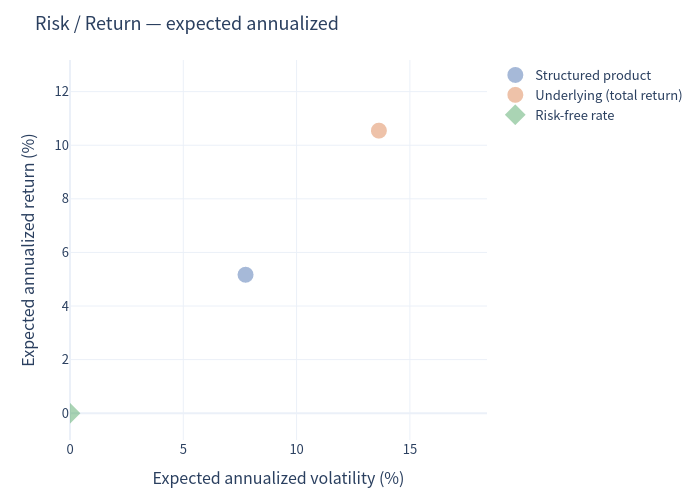
The product is a yield-enhancement structure: it offers a 9.00% p.a. coupon (paid quarterly) in exchange for the investor taking the downside of the worst-performing of three Swiss blue-chips once a 64% barrier is breached. Across 10,000 simulated 2-year scenarios the product returned about 5.17% per year on average — below the equal-weight underlying basket's ~10.54% total return — but with roughly 40% less volatility and a much narrower loss probability in all but the most adverse tail.
Basic Product Information & How It Works
- Underlyings (worst-of): Alcon Inc (ALC), Geberit AG (GEBN), Swisscom AG (SCMN) — all SIX Swiss Exchange, CHF.
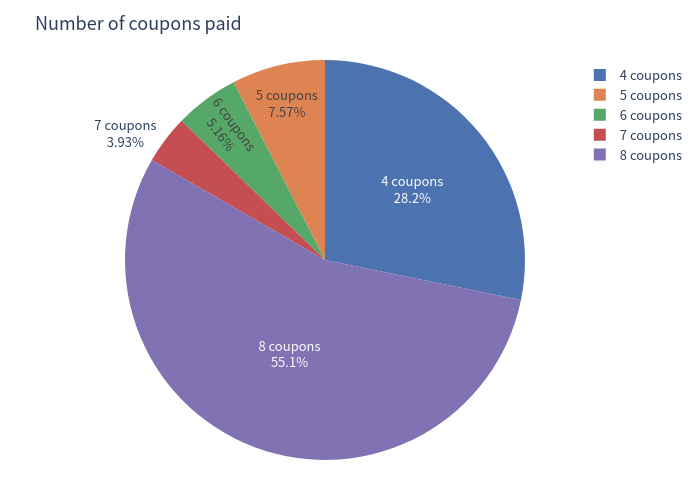
- Coupon: 9.00% p.a., paid quarterly (CHF 22.50 per CHF 1,000, i.e. 2.25 index points per quarter), for up to 8 payments.
- Barrier: 64% of the initial level, continuously observed over the whole life.
- Maturity: 15/09/2028 (redemption 22/09/2028).
- Issuer callable: the Issuer may redeem early on each quarterly date from Sep-2027, paying par plus the coupon then due.
- Upside: capped — the investor never receives more than par plus coupons.
In plain terms. The investor lends CHF 1,000 and is promised 9% a year. As long as none of the three shares ever trades at or below 64% of its starting price, the investor simply gets the CHF 1,000 back at the end plus every coupon. If any one share does breach 64% and that worst share is still below its starting price at maturity, the investor does not get par back — instead they receive that worst share (physically or in cash), so their capital follows the weakest of the three names down. In short, the juicy 9% coupon is the compensation for selling downside protection on the worst of three stocks.
Key Statistics — Product vs Underlying
Underlying = equal-weight basket of Alcon, Geberit and Swisscom (total return, dividends included at ≈2.30%). All figures annualized.
| Metric | Structured Product | Underlying (total return) |
|---|---|---|
| Expected annualized return | 5.17% | 10.54% |
| Expected annualized volatility | 7.75% | 13.63% |
| Probability of loss | 18.69% | 22.90% |
| 99% confidence VaR (1-year) | −19.46% | −14.74% |
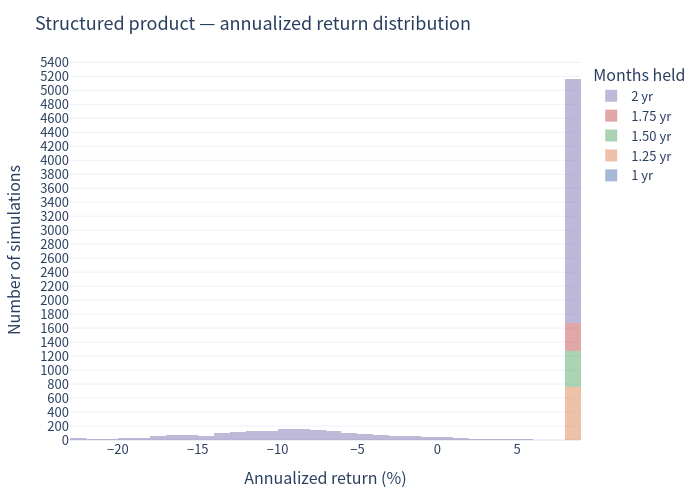
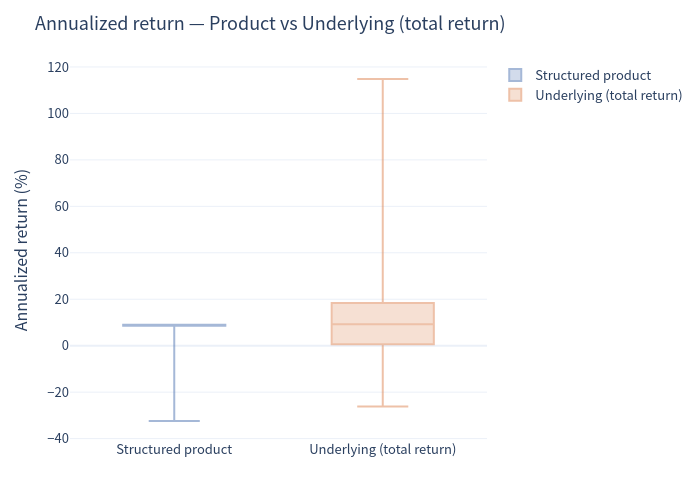
The product converts a wide distribution of equity outcomes into a narrow, cap-and-coupon payoff: the best case is capped near +9% annualized, the worst observed case was −32.42% annualized, and 79.73% of scenarios returned capital at par. The investor gives up the upside (basket expected return is roughly double) and in exchange usually collects the coupon, while accepting a fatter left tail than a straight holding (VaR −19.46% vs −14.74%).
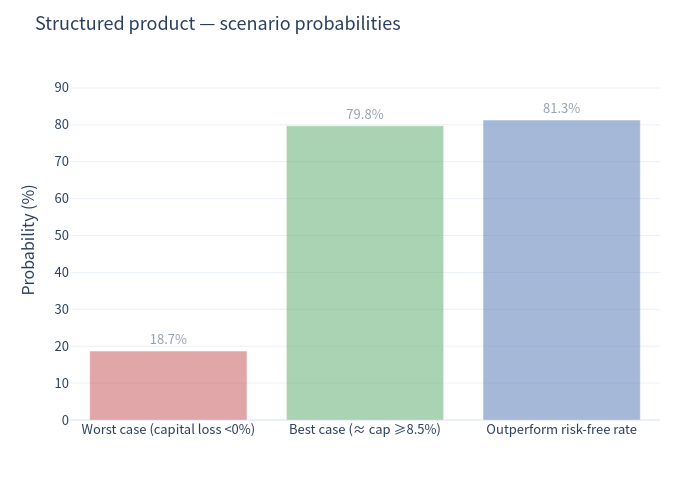
Scenario Probabilities
- Capital loss (negative return): 18.69%
- Best case — par + full coupon (≈ cap, ≥8.5%): 79.75%
- Outperforming the risk-free rate (≈0%): 81.31%
Charts
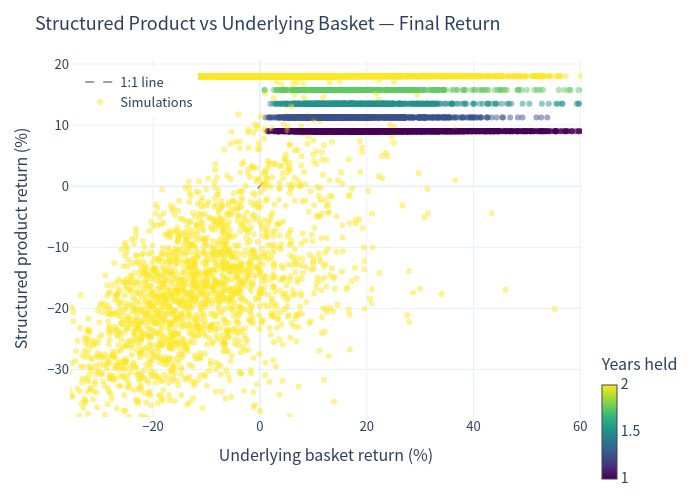
Simulated outcomes — product vs underlying basket
Each point is one scenario; colour indicates holding period. Points above the dashed 1:1 line are scenarios where the product beat the basket.
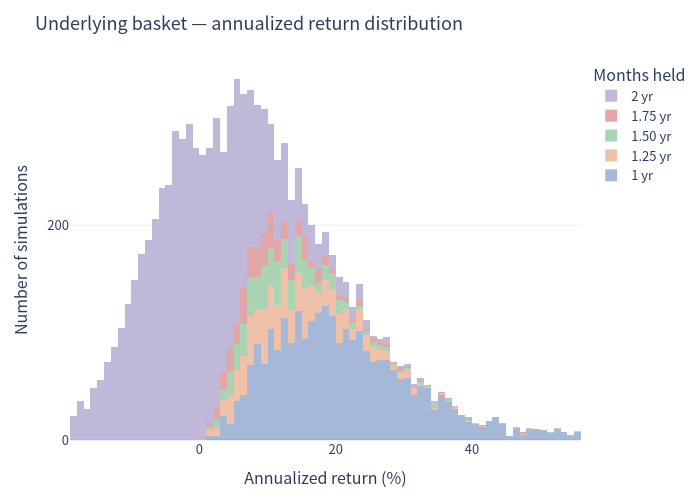
Annualized return distributions
The product's returns cluster at the coupon level (~8.5–9%) with a separate loss tail; the basket is far more dispersed.
Risk / Return
Annualized return — box plot comparison
Scenario probabilities
Holding period and coupon count
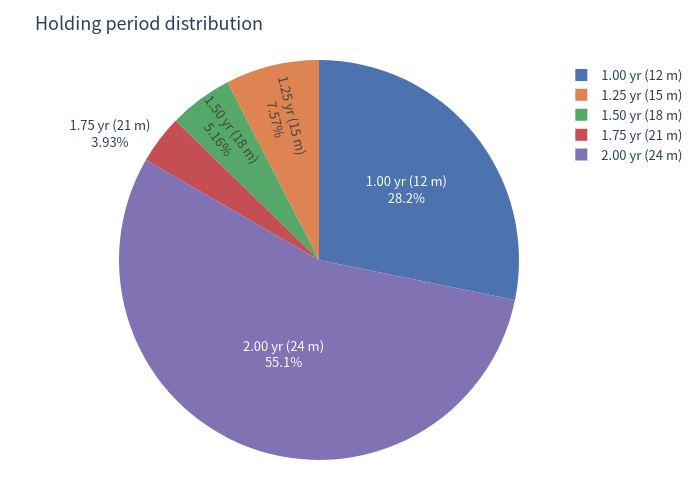
Because the product is issuer-callable, it frequently ends early; this also determines how many of the eight coupons are received.
Investment Commentary
Points worth noting
- High headline coupon. 9.00% p.a. is far above CHF short rates (≈0%), providing a large, predictable income stream while the structure survives. In ≈80% of scenarios investors received par plus essentially the full coupon.
- Deep, continuously-monitored barrier at 64%. The knock-in requires a ≥36% fall in any of the three names, which materially reduces the chance of a capital event (≈21% over two years).
- Worst performer must also finish below its start to cause a loss. Even after a barrier breach, if the weakest share recovers back to (or above) its initial level by maturity, the investor still gets par — so the barrier event (≈21%) translates into an actual capital loss in fewer cases (≈19%).
- A barrier breach alone does not guarantee a loss. Only one of the three names needs to touch 64% to trigger the barrier event, but a capital loss still requires the worst performer at maturity to finish below its starting level. If that weakest name recovers to (or above) 100% by maturity, the investor still receives par — so a barrier event (≈21%) becomes an actual capital loss in fewer cases (≈19%). Note the loss can be driven by a different name than the one that first breached the barrier.
- Meaningful capital protection in the base case, with a loss probability (18.69%) even a little below that of holding the basket outright (22.90%).
- Issuer callability can shorten the trade: in ≈45% of scenarios the note was called early, capping the number of coupons received (most commonly at the first call date).
Risks to keep in mind
- Capped upside. The investor cannot benefit from a rally beyond the fixed coupon; in the ≈45% of paths where the market rose strongly, the basket handily out-performed the note.
- Fat left tail. The loss profile is put-like: 99% VaR (−19.46%) is worse than the underlying's (−14.74%), and the worst simulated outcome was about −32% annualized. Losses are concentrated and can be large when the barrier breaks.
- Worst-of payoff. The coupon is earned on the weakest link; the effective downside is on the single worst-performing name, which can diverge sharply from the basket average.
- Issuer / credit and collateral risk (Leonteq Securities AG, Guernsey Branch; Fitch BBB-, TCM-collateralised).
- Concentration in Swiss equities. All three names are Swiss large-caps; correlated Swiss-market drawdowns reduce the diversification benefit of the worst-of basket.