
Callable Jump Notes due September 30, 2031 — Simulation Analysis Report
Headline Simulation Results (primary scenario*)
| Metric | Result |
|---|---|
| Expected annualized return | 7.80% |
| Probability of a negative return | 0.00% (principal protected at maturity) |
| 99% confidence VaR (1 year, annualized) | 0.00% (worst realistic case = principal repaid only) |
| Expected total return over the expected holding period | +25.06% |
| Expected holding period | ≈ 44 months (~3.7 years) |
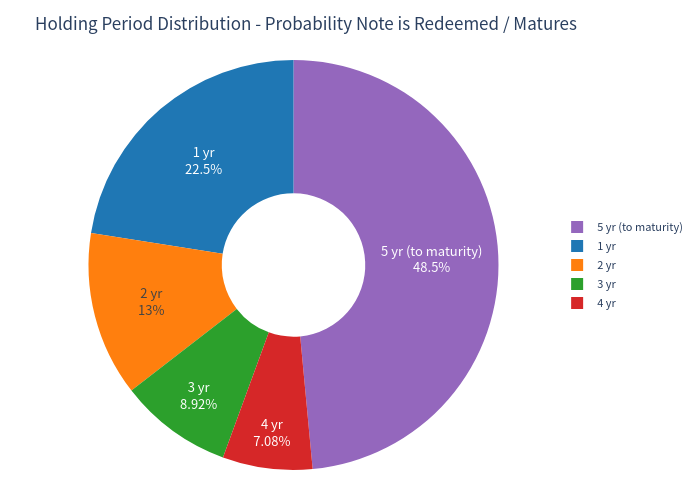
| Probability the note is held to maturity | 48.51% |
| Probability of receiving only principal (0% total return) | 19.70% |
| Probability of annualized return > 10% | 52.93% |
| Probability of outperforming risk-free (~3.72%) | 70.43% |
*Primary scenario models the issuer exercising its monthly redemption ("call") right when it is economically rational to do so — see "Two Scenarios Considered" below. The call trigger is not mechanically defined in the term sheet (it is driven by Morgan Stanley's internal risk-neutral valuation model); an explicit, clearly-labelled assumption is used and results are shown for a "never called" baseline as well.
Basic Product Information
What it is.
A 5-year principal-protected structured note (issued Sep 2026, maturing Sep 2031) linked to the worst performing of the Russell 2000® and S&P 500® indices. It pays no coupons. If the note is not redeemed early, investors receive at maturity:
- Both indices above their initial level → 100% participation in the upside of the worst-performing index (no cap);
- Either index at or below its initial level → only the $1,000 principal (0% return, never less than par).
How the call feature works (layman terms).
From one year after issue, Morgan Stanley may redeem the note early, on any monthly redemption date, at a pre-set redemption amount that increases over time — from about $1,132.50 (≈ +13.25% after year 1) to about $1,651 (≈ +65% just before maturity). Morgan Stanley only calls when its own model says doing so is cheaper for the issuer than letting the note run — in practice, mainly after a strong rally, which caps the investor's upside at the redemption amount. This analysis therefore looks at the note from the investor's perspective under two transparent scenarios (same market simulations):
| Scenario | Description |
|---|---|
| A — Never called (baseline) | Note held to maturity; payoff = principal + 100% of worst-of upside (if both indices up) or principal only. |
| B — Issuer-rational call (primary) | Morgan Stanley redeems at the first monthly redemption date where the value of continuing the note (worst-of level discounted at the risk-free rate) is no longer cheaper than paying the scheduled redemption amount. |
Why the two matter.
In the "never called" world the investor keeps full upside; in the issuer-rational-call world upside is capped in strong markets (the issuer uses its option). The expected annualized return is similar (~7.8%) in both; the difference shows up mainly in the total return, the holding period, and how often the investor is redeemed early.
Key Statistics
Structured product vs underlying benchmark (50/50 equal-weight Russell 2000 + S&P 500, incl. dividends)
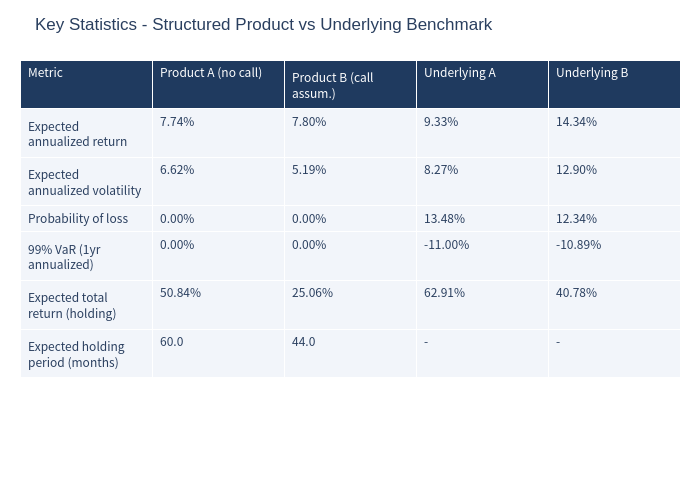
| Metric | Product A (never called) | Product B (issuer-rational call) | Benchmark A (5-yr hold) | Benchmark B (matched horizon) |
|---|---|---|---|---|
| Expected annualized return | 7.74% | 7.80% | 9.33% | 14.34% |
| Expected annualized volatility | 6.62% | 5.19% | 8.27% | 12.90% |
| Probability of loss | 0.00% | 0.00% | 13.48% | 12.34% |
| 99% VaR (1 yr, annualized) | 0.00% | 0.00% | -11.00% | -10.89% |
| Expected total return (over holding) | +50.84% | +25.06% | +62.91% | +40.78% |
| Expected holding period | 60 months | 44.0 months | 60 months | 44.0 months |
Risk-free rate used: ~3.72% (1-year U.S. T-bill average). Benchmark returns measured over the same horizon as each simulated product exit. In Scenario B the note tends to be redeemed early in strong markets, so the benchmark return measured over those shorter matched horizons averages higher than a static 5-year buy-and-hold.
How often is the note redeemed early? (Scenario B)
| Outcome | Probability |
|---|---|
| Redeemed in year 1 (≈ +13.25% return) | 22.50% |
| Redeemed in year 2 (≈ +26.5%) | 12.99% |
| Redeemed in year 3 (≈ +39.75%) | 8.92% |
| Redeemed in year 4–5 (≈ +53% to +65%) | 7.08% |
| Held to maturity (month 60) | 48.51% |
Interpreting the numbers.
Because the note can be redeemed early, look at total return and holding period together. A year-1 redemption locks in ≈ +13.25% in one year; a 5-year hold that ends at par returns 0% over five years (a real opportunity cost versus ~3.7% risk-free). Short, high-return redemptions are what lift the expected annualized figures; ~19.7% of simulations end with principal only.
Charts
Simulation outcomes: structured product return vs underlying return (Scenario B)
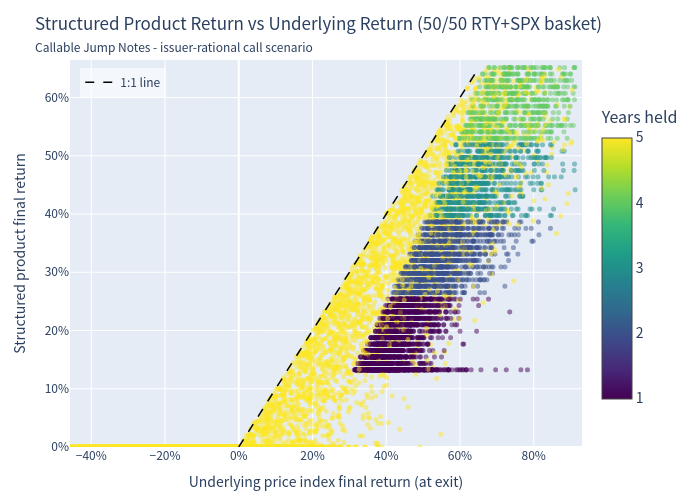
Each dot is one simulation; color = years the note was held. The dashed 1:1 line is where the product return would equal the underlying return. Redemptions appear as horizontal bands (capped returns); maturity outcomes follow the floor/upside profile. Points below the line occur where the product payoff lags the equal-weight benchmark — either because the issuer redeemed the note early at a capped amount in a strong market, or because the worst-of/maturity structure paid less than a 50/50 basket would have.
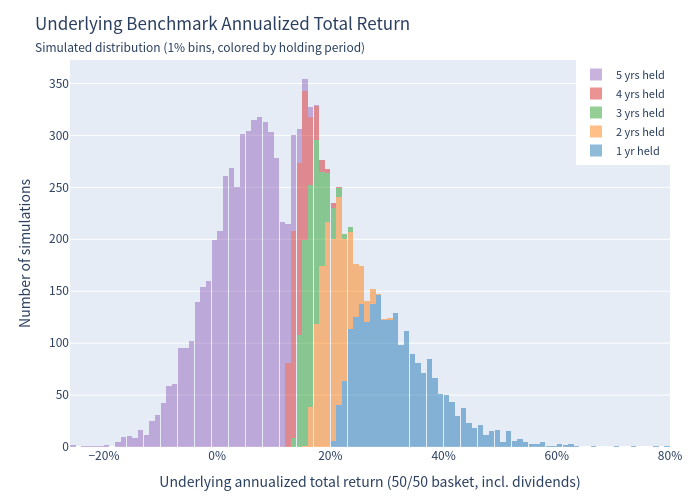
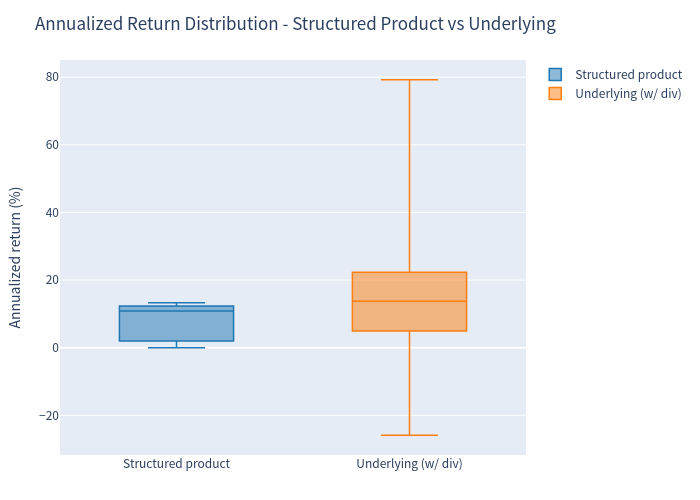
Distribution of annualized returns — underlying benchmark (Scenario B)
Distribution of annualized returns — structured product (Scenario B)
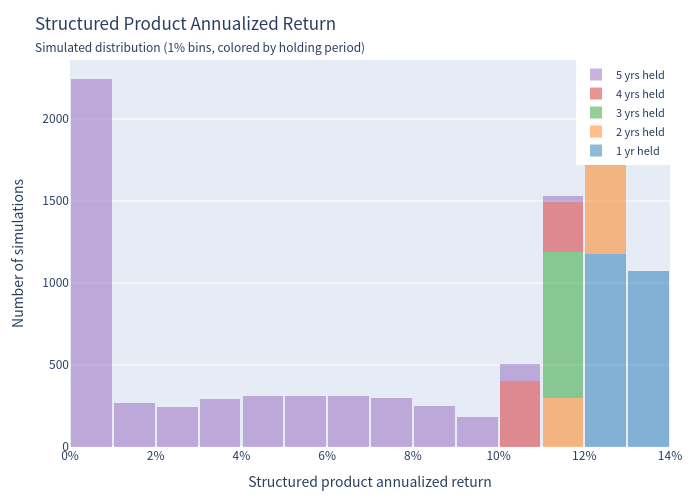
In this simulation the product's annualized return spans 0% (principal only) to ≈13.25% (year-1 redemptions). This compression reflects the par floor, the redemption schedule and the issuer redeeming the deepest in-the-money paths — the contractual maturity payoff itself is uncapped.
Key statistics table
Scenario probabilities
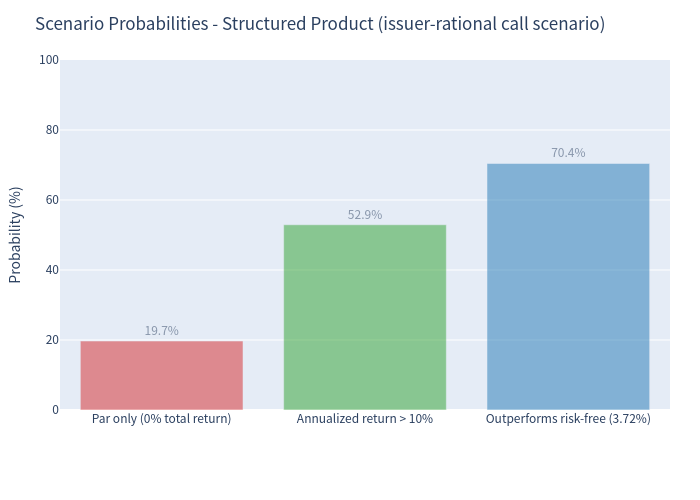
Risk / return profile
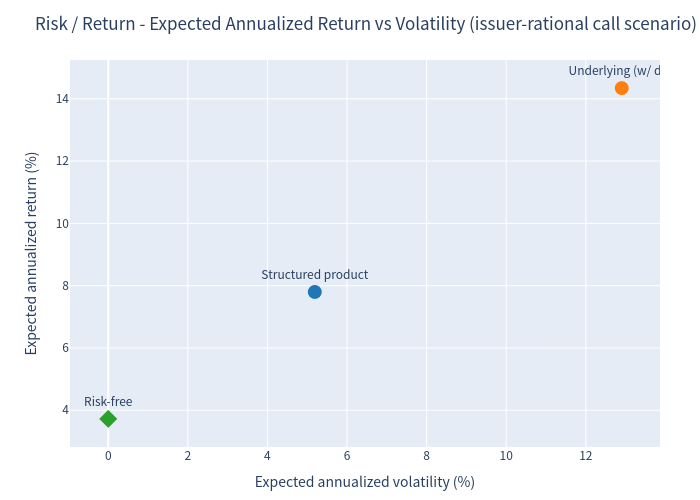
Annualized return distributions — box comparison
Holding-period distribution (Scenario B)
No coupon-count pie is shown: the note pays no coupons.
Investment Commentary
Attractive features worth noting
- Principal protection at maturity — under no scenario does the note pay less than par, so the simulated probability of a negative return is 0% and the 99% VaR is 0% (worst case is a 0% return over the holding period, i.e., an opportunity cost rather than a capital loss).
- Positive skew from the issuer call in the base structure — when redeemed early, redemption amounts are generous (≈ +13.25% in year 1, rising to ≈ +65% by year 5), which, combined with the par floor, produces an expected annualized return (≈7.8%) that is roughly double the risk-free rate (≈3.72%) with no downside below par at maturity.
- Downside protection from the maturity principal floor — the note can never pay less than par at maturity, so in ~70% of simulations it outperforms the risk-free rate and its annualized volatility (≈5.2%) is far below that of the underlying benchmark (≈12.9% over matched horizons). Returns are floored at 0% and capped when the issuer redeems early.
Trade-offs to weigh (facts, not advice)
- The call is the issuer's option. In the issuer-rational-call scenario the note underperforms the benchmark over matched holding periods (expected annualized 7.80% vs 14.34%) — in strong markets the investor is redeemed early at a capped amount while the indices keep rising. The "never called" baseline (full upside to maturity) shows expected annualized return of 7.74% over 5 years.
- Worst-of structure has a high "both must be up" hurdle at maturity: if either index ends at or below its start, the payoff is only principal — about 19.7% of simulations end with a 0% total return over the holding period (0% annualized), which can lag cash over 3–5 years.
- Zero coupon / no interim income; all value is in the terminal payoff or redemption, and the note is unsecured issuer/guarantor credit.
This report is a quantitative evaluation of the payoff mechanics under simulated market conditions. It is not financial advice and does not constitute a suitability assessment for any investor.