
Worst-of INDU / NDXT / RTY Contingent Income Auto-Callable Securities — Simulation Report
Headline Simulation Results
Across 10,000 simulated scenarios (USD-denominated note):
| Headline Metric | Value |
|---|---|
| Expected annualized return | +8.15% |
| Probability of a negative return | 8.46% |
| 99% confidence VaR (1 year) | −30.65% |
| Expected total return over the realized holding period | +5.16% |
| Expected holding period | ~11.9 months (1.0 year) |
| Early-redemption (autocall) probability | 77.1% |
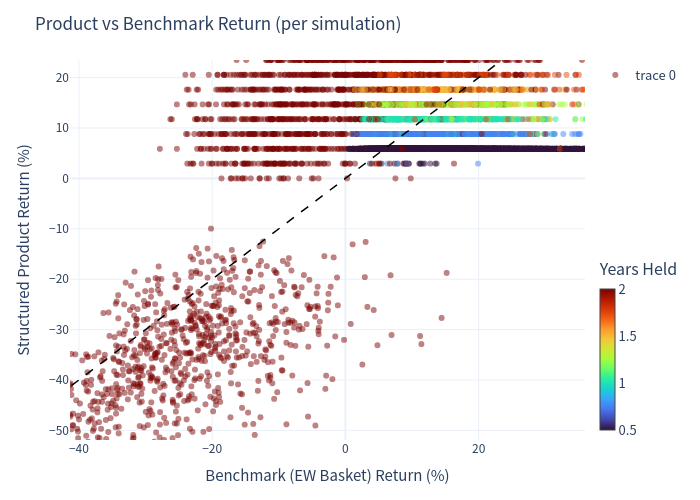
The note behaves like a high-coupon, short-dated, worst-of “phoenix”: most of the time it is called early and the investor collects coupons and par, but a minority of paths suffer severe, unprotected downside when the weakest index falls below 70% of its starting level.
How It Works (plain language)
The note is linked to the worst performer of three US equity indices — the Dow Jones Industrial Average (INDU), the Nasdaq-100 Technology Sector Index (NDXT) and the Russell 2000 Index (RTY).
- Contingent quarterly coupon (~11.75% p.a.). Every quarter you receive a coupon only if all three indices are at or above 80% of their starting level on that day. If even one index dips below 80%, that quarter’s coupon is skipped.
- Automatic early redemption. Starting after 6 months, on each quarterly date the note is called (redeemed at par $1,000 plus the coupon) if all three indices are at or above 100% of their start. Once called, the note ends.
- Maturity. If never called and the worst index finishes at or above 70% of its start, you get par ($1,000) plus any final coupon. If the worst index finishes below 70%, you lose 1:1 — e.g. −50% gives $500, −100% gives $0.
- Upside is capped. You never participate in index gains; the maximum is par plus coupons.
In short: the investor is paid an attractive coupon to sell worst-of downside protection below a 70% barrier, while upside is capped and the note is likely to be redeemed early.
Basic Product Snapshot
| Feature | Detail |
|---|---|
| Underlyings | Worst-of Dow Jones Industrial Average, Nasdaq-100 Technology Sector, Russell 2000 |
| Type | Contingent-income, worst-of auto-callable (phoenix) |
| Reference notional | $1,000 per security (modelled as 100 index points) |
| Contingent coupon | 11.25%–12.25% p.a.; modelled at midpoint 11.75% p.a., quarterly |
| Coupon barrier | 80% of initial (all three indices) |
| Downside threshold | 70% of initial (worst performer) |
| Call threshold | 100% of initial (all three), quarterly from month 6 |
| Term | ~24 months (maturity Nov 2, 2028) |
| Upside cap | Yes |
| Currency | USD (no FX/quanto) |
Key Statistics
| Metric | Structured Product | Benchmark (EW Basket, total return) | Benchmark Buy & Hold 24m (reference) |
|---|---|---|---|
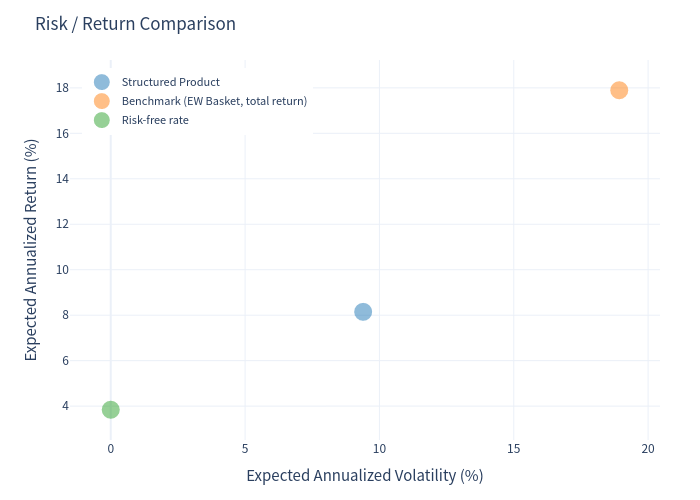
| Expected annualized return | 8.15% | 17.90% | 9.60% |
| Expected annualized volatility | 9.40% | 18.93% | 13.71% |
| Probability of loss | 8.46% | 15.10% | 23.67% |
| 99% VaR (1 year) | −30.65% | −22.61% | −22.96% |
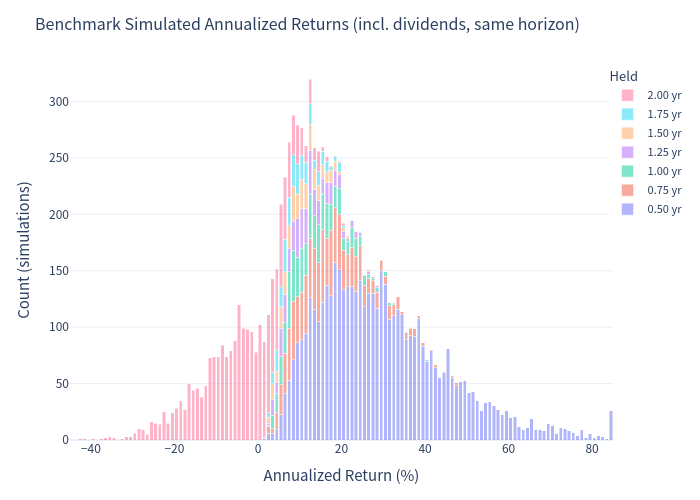
Benchmark = equal-weight basket of the three indices (price return, plus a blended ~0.80% dividend yield). The “same-horizon” benchmark column measures the basket only over each path’s realized holding period; because early redemptions trigger precisely when the market has rallied, this column understates holding-period length and inflates the annualized figure (many paths are annualized from a 6-month rally). The unconditional 24-month buy-and-hold reference (≈9.60% annualized) is the fairer “do-nothing” comparison.
Distribution of Returns
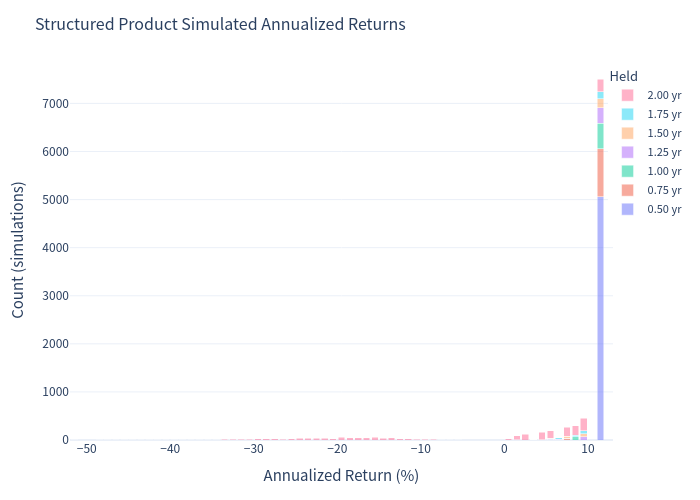
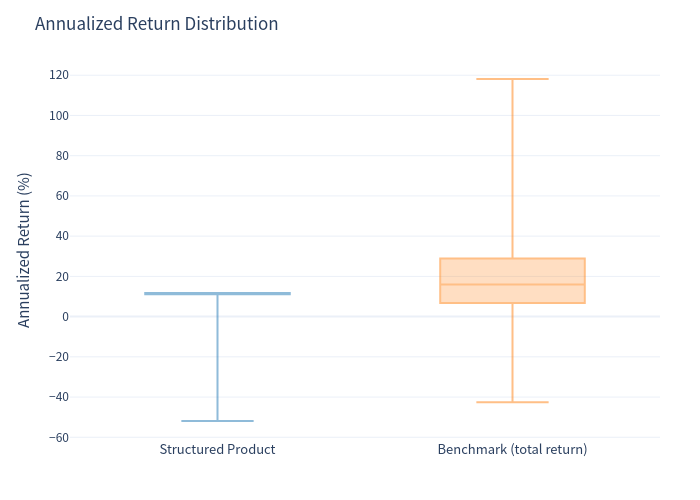
Structured product. The distribution is strongly bimodal/thin-tailed on the upside and fat on the downside: roughly three-quarters of paths annualize near the coupon rate (~11.8%), while a tail of ~8% of paths suffers losses (worst ≈ −77% total). The product’s volatility (9.4%) is about half the basket’s.
Benchmark (equal-weight basket, total return, same horizon). Much wider dispersion and a long right tail from strong rallies that coincide with early calls.
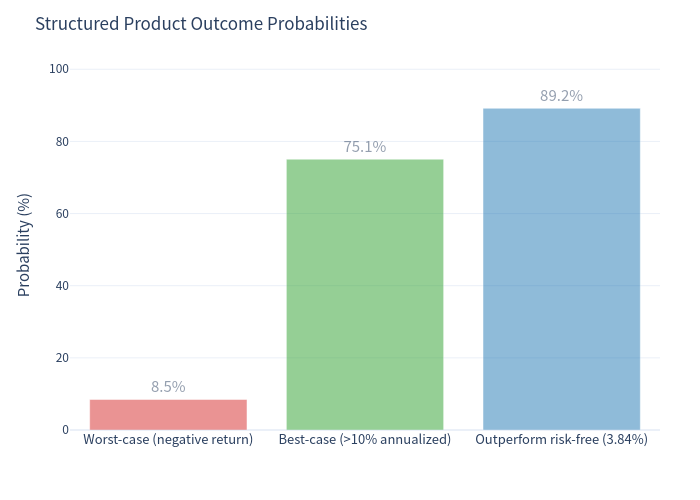
Outcome Probabilities & Path Profile
- Worst case (negative return): 8.46%
- Best case (>10% annualized): 75.1% (the note most often delivers close to its coupon rate)
- Beats the risk-free rate (~3.84%): 89.2%
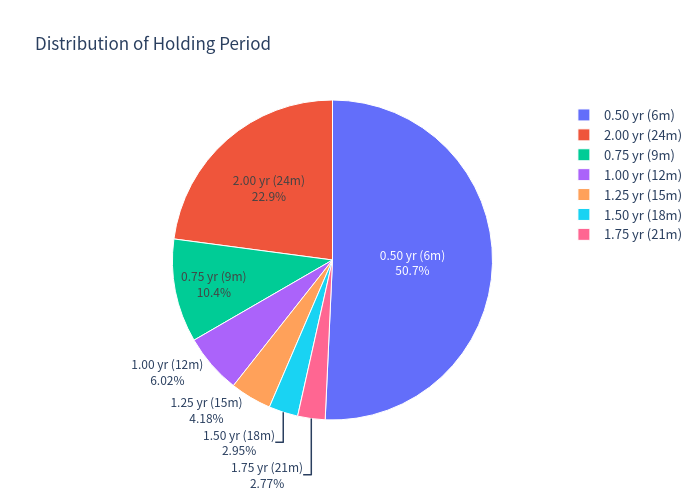
Most paths terminate at the first call (month 6, ~51% of scenarios) after collecting two coupons. About 23% run to maturity, and the remainder are called at later quarterly dates.
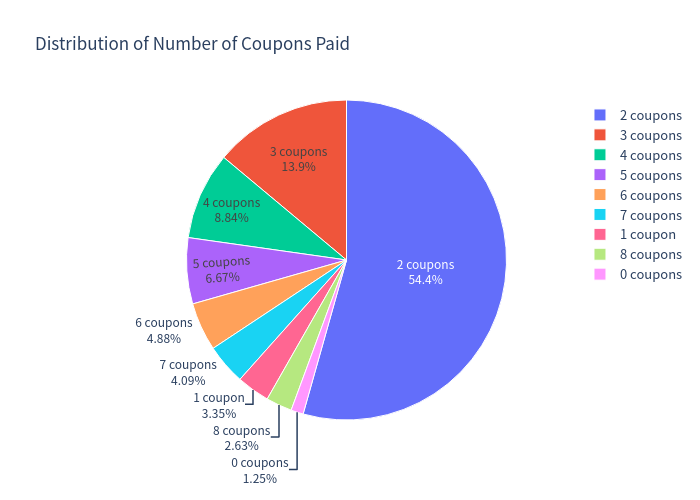
The coupon-count profile mirrors this: the most common outcome is exactly two coupons (~54%), and ~1.3% of paths receive no coupon at all (an index fell below 80% at every observation).
Investment Commentary
Interpretation of the numbers. On average the note returned +5.16% over an ~12-month realized holding period (≈ an 8.15% annualized rate). Because roughly half of all scenarios end at the 6-month first call, the annualized figure reflects short holding periods and should be read together with the total return and holding period, not in isolation. Over the same realized horizons the equal-weight basket averaged +9.55% total return, so the note trades part of the equity upside for a coupon and a partial capital buffer.
Favorable characteristics
- Attractive coupon: ~11.75% p.a. contingent income — several times the ~3.8% risk-free rate — paid quarterly, with coupon income driven by staying above an 80% barrier rather than by index appreciation.
- High early-redemption rate (~77%): most scenarios lock in the coupon within one year, and ~91.5% of scenarios return at least the original principal.
- Much lower volatility (9.4%) than the underlying equity basket (~18.9%), with a meaningful cushion before losses begin (coupon barrier 80%, principal barrier 70%).
- Consistently clears the risk-free rate in ~89% of scenarios.
Risks and drawbacks
- Capped upside: the investor never participates in index gains; a strong bull-market path forgoes large upside (benchmark buy-and-hold averaged ~+20% over two years versus the note’s ~+5%).
- Worst-of linkage: tying the barrier and coupon to the weakest of three indices raises the chance of a missed coupon or barrier breach versus a single-index note.
- Severe, unprotected tail: once the worst index ends below 70%, losses are 1:1 with no floor — the worst simulated path lost ~77%, and the 99% VaR (−30.65%) is worse than the basket’s (−22.61%). A minority of scenarios carries most of the risk.
- Conditional coupon: income can be interrupted whenever any one index closes below 80% on an observation date.
- Issuer and liquidity risk: exposure to Morgan Stanley’s credit, and limited secondary-market liquidity for an unlisted note.
This report is a quantitative, scenario-based evaluation of the note’s payoff profile and risk/return characteristics. It does not constitute financial, investment, tax, or suitability advice.
Charts Included
scatter_returns.png— per-simulation product vs benchmark returnshist_product.png— product annualized-return histogram (stacked by holding period)hist_benchmark.png— benchmark annualized-return histogram (stacked by holding period)risk_return_scatter.png— expected return vs volatility (product, benchmark, risk-free)box_comparison.png— annualized-return box plotscenario_probabilities.png— worst-case / best-case / beat-risk-free probabilitiespie_holding_period.png— distribution of holding periodpie_coupons.png— distribution of number of coupons paid