
Morgan Stanley SPX Market-Linked Notes due August 30, 2029
CUSIP 61781DCH9 | 3-year term | USD
Principal-protected, capped upside on the S&P 500® Index
Headline Simulation Results
Basic Product Information
How It Works
This note offers 100% principal protection with uncapped downside protection and a capped share of the S&P 500's upside:
- At maturity (August 30, 2029), the performance of the S&P 500 Index is measured from the pricing date to the observation date (August 27, 2029).
- If the index rises, you receive 100% participation in that gain, up to a maximum payment of $1,185 per $1,000 note (18.50% cap), assumed at the conservative end of the stated $1,185–$1,205 range.
- If the index is flat or falls, you receive your full $1,000 principal back — the note does not participate in losses at all.
- The note pays no coupons and has no early-redemption feature; it is held to maturity.
In short: the investor trades away returns beyond +18.50% over 3 years in exchange for complete protection against S&P 500 losses.
Key Product Features
- Underlier: S&P 500® Index (SPX) — single underlying
- Participation rate: 100%
- Upside cap: 18.50% over the term (assumed, from the $1,185–$1,205 range)
- Principal protection: 100% (no barrier conditions)
- Coupons: None
- Early redemption: None — always held to maturity (36 months)
Key Statistics (Structured Product vs Underlying)
| Metric | Structured Product | Underlying SPX (Total Return) |
|---|---|---|
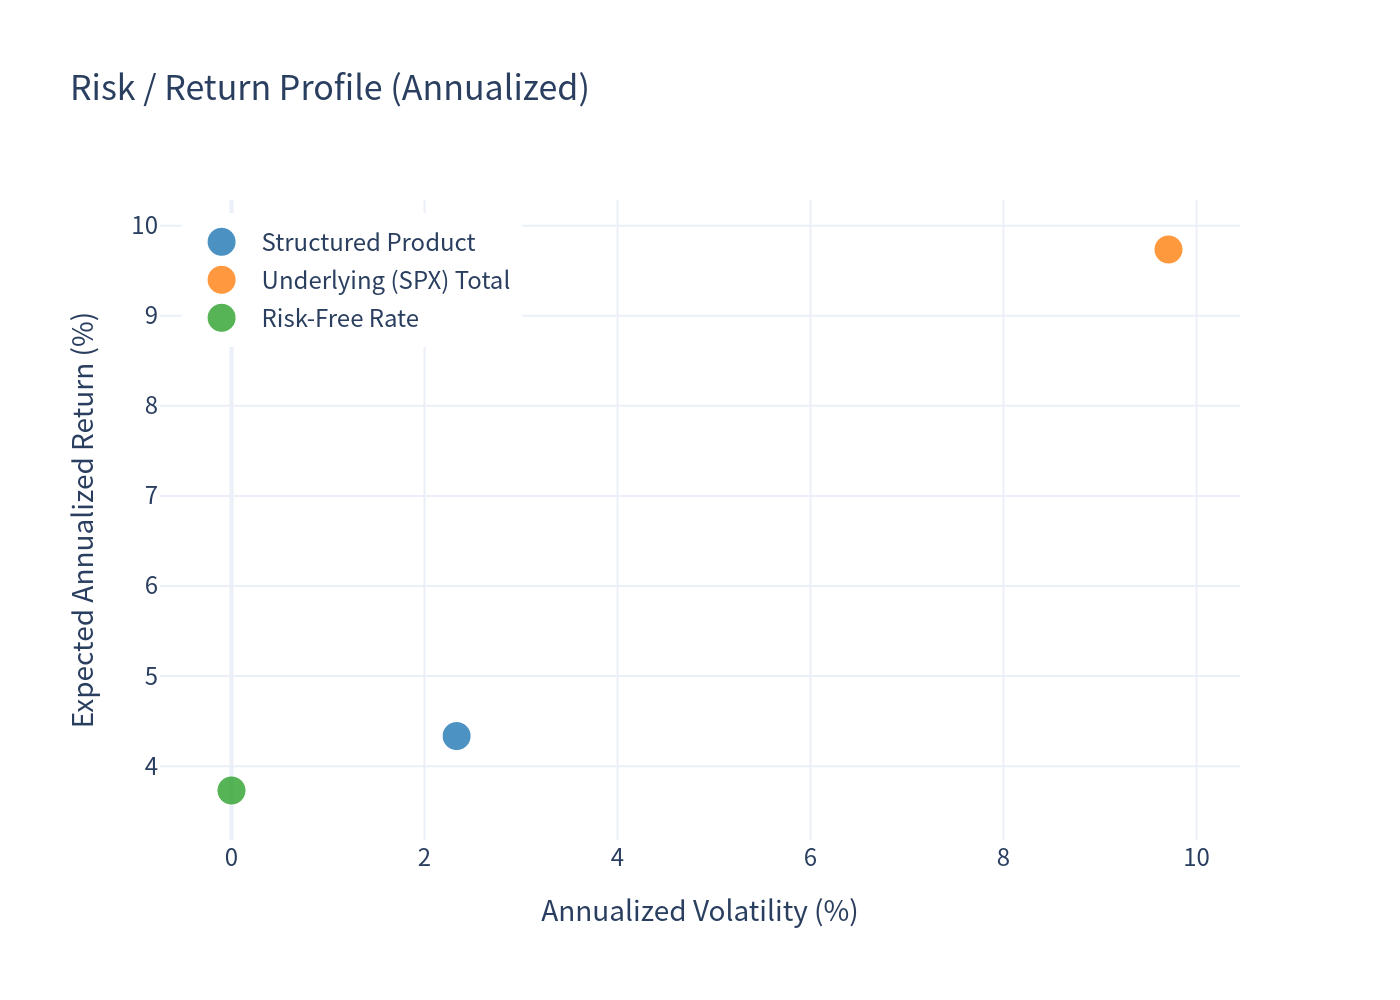
| Expected annualized return | 4.33% | 9.74% |
| Expected annualized volatility | 2.33% | 9.71% |
| Probability of loss | 0.00% | 15.22% |
| 99% confidence VaR (1 year) | 0.00% | -15.79% |
| Expected total return over term | 13.74% | 31.56% (price) / ~34.6% (with dividends) |
The structured product is held for the full 36-month term in all simulations (no early exit feature). Underlying comparisons use the S&P 500 level at the same 36-month horizon, and the underlying's annualized returns include an estimated dividend yield of 1.01% for a fair comparison.
Charts
Simulation Outcomes: Structured Product vs Underlying Return
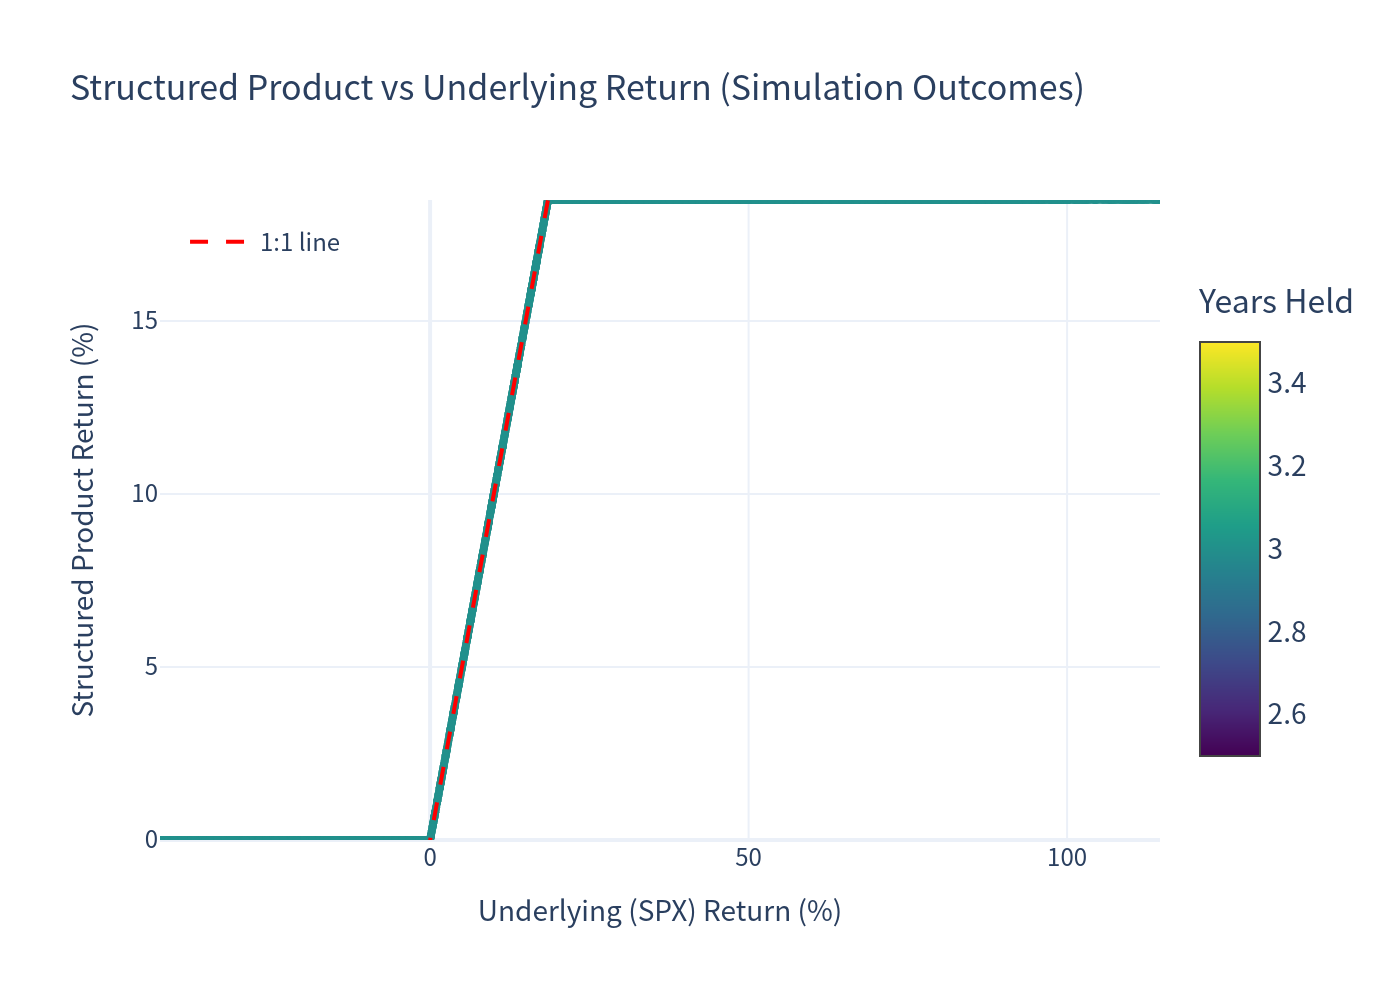
Each point is one simulated path. The red dashed line is the 1:1 line. Note the characteristic "hockey stick": the product return is floored at 0% and capped at 18.50%, while the underlying spans roughly -42% to +115%.
Annualized Return Distributions (1% bins)
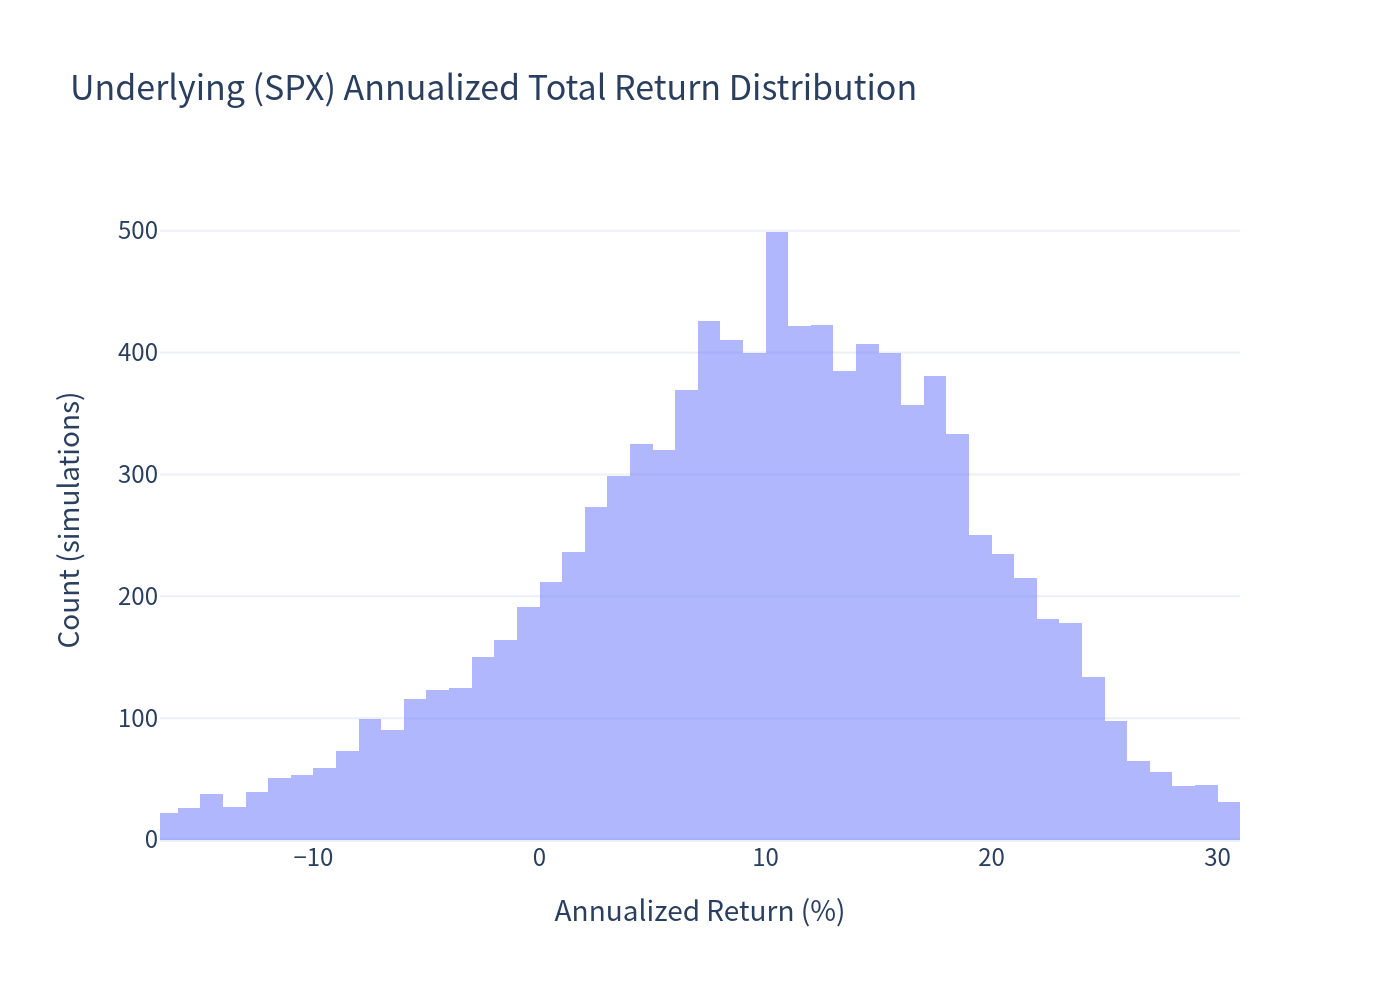
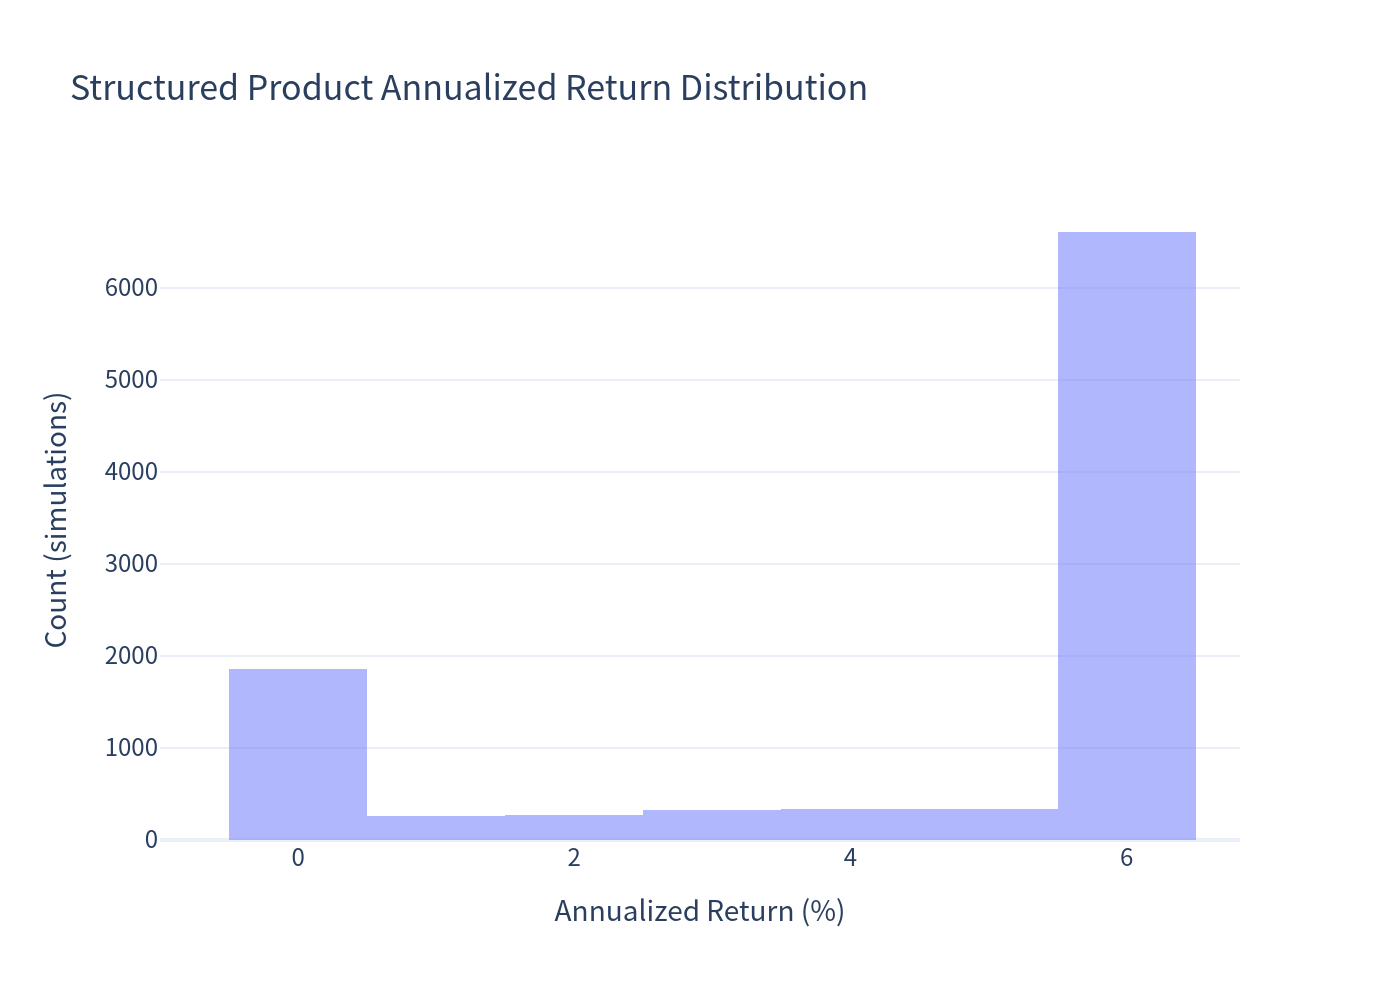
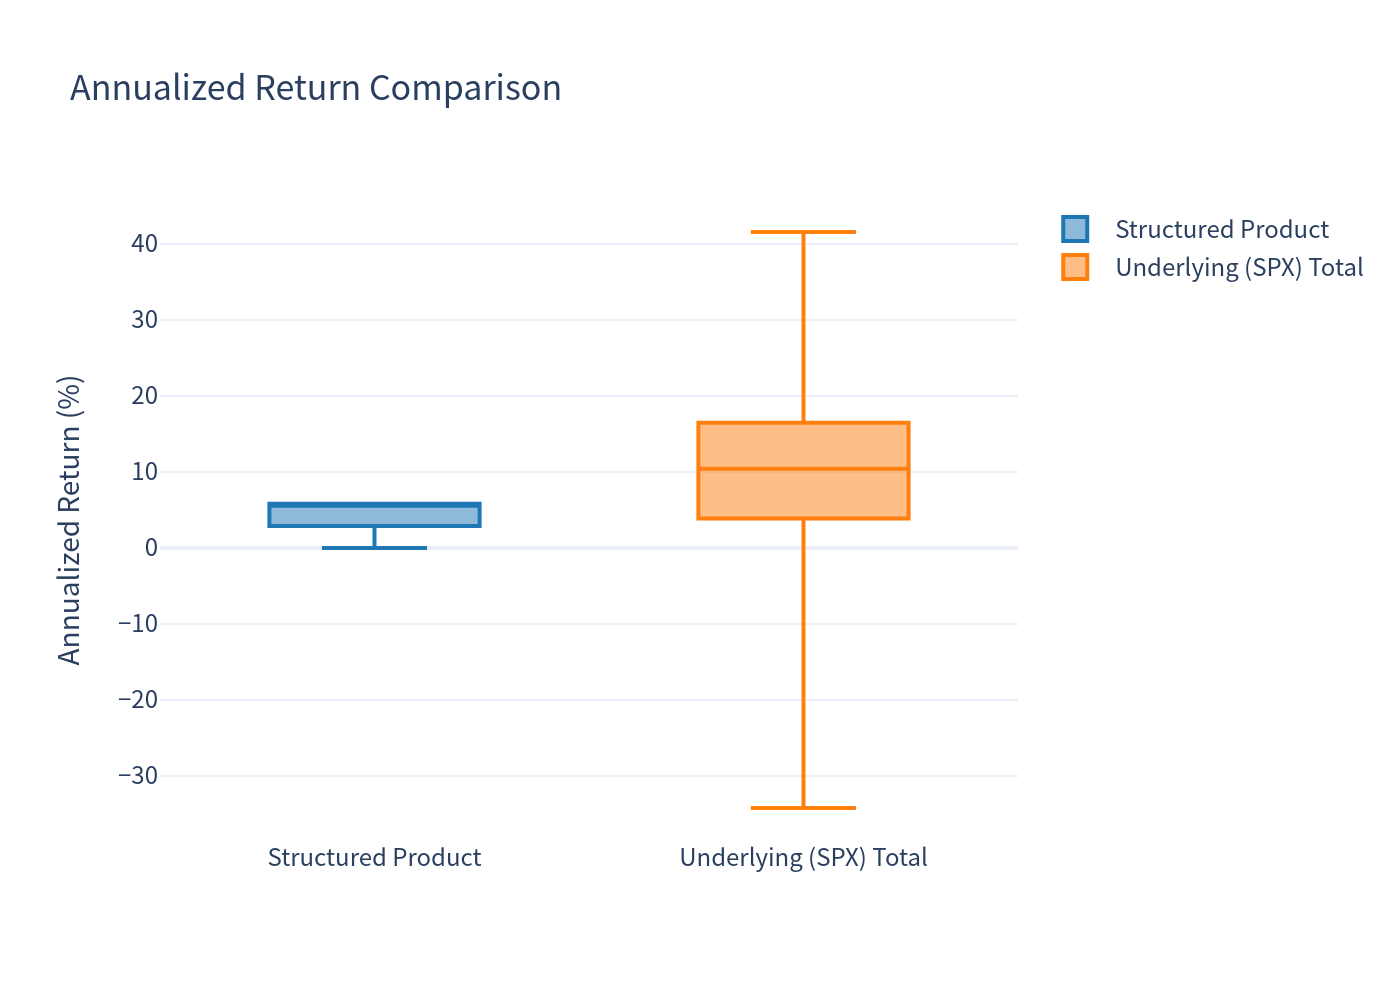
The underlying's annualized total returns are broadly dispersed (roughly -17% to +31% in the central range) with roughly 15% of paths negative. The product's annualized returns are tightly clustered between 0% and the capped maximum of approximately 5.83% annualized, with no negative outcomes.
Scenario Probabilities
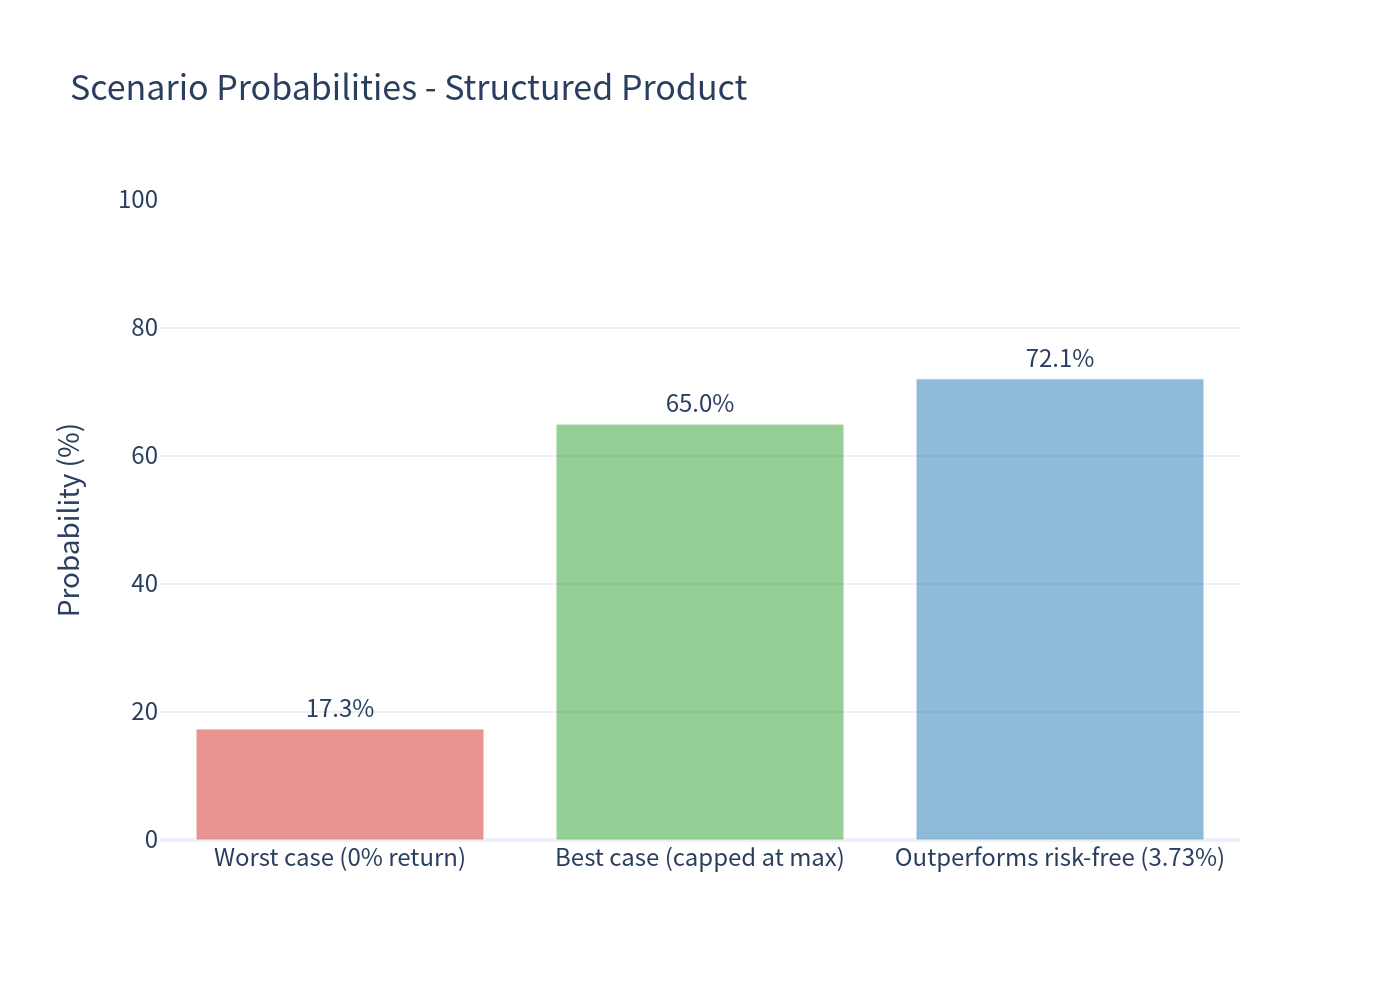
- Worst case (0% return): 17.35% — the index is flat or down, investor gets principal back with no gain.
- Best case (capped at maximum): 64.98% — index gain exceeds 18.50%, investor receives the maximum $1,185 per note.
- Outperforming risk-free (3.73%): 72.06% — the note beats the 1-year T-bill rate.
Risk / Return Profile
The structured product offers a lower expected return (4.33%) than the S&P 500 total return (9.74%) but with dramatically lower volatility (2.33% vs 9.71%) and no downside — a classic trade-off of principal protection for capped upside.
Return Distribution Comparison
Investment Commentary
What Works Well
- Full principal protection: the note's return can never be negative, eliminating market downside risk entirely (subject only to Morgan Stanley's credit risk).
- Favorable upside capture probability: in roughly 65% of simulated scenarios the note reaches its maximum payment of $1,185, and it outperforms the risk-free rate about 72% of the time.
- Very low volatility of outcomes: annualized return volatility of only ~2.3%, with outcomes tightly bounded between 0% and ~5.83% annualized.
Trade-offs to Consider
- Capped upside: the 18.50% cap forfeits any S&P 500 gain beyond that level — in the simulated distribution the index exceeds +18.50% over 3 years in about 65% of scenarios, so the note frequently lags the index in strong markets.
- Modest expected return: at 4.33% annualized, the expected return is only modestly above the 3.73% risk-free rate, reflecting the cost of the principal protection and the issuer's structuring margin (estimated value $955.40 vs $1,000 issue price).
- Credit risk: all payments depend on Morgan Stanley Finance LLC / Morgan Stanley's ability to pay; the note is not principal-protected against issuer default.
Notes on Interpretation
The product is always held to the full 36-month maturity in this analysis, so annualized figures (CAGR) and the expected total return (13.74%) should be read together: the holding period is fixed at 3 years.
A cap assumption of 18.50% (the conservative end of the stated $1,185–$1,205 maximum range) is used; a higher final cap would slightly improve the expected return.