
Worst-of NDXT, RTY & SPX Buffered Jump Securities (Auto-Callable)
Headline Simulation Results
| Metric | Value |
|---|---|
| Expected annualized return | 9.35% |
| Expected total return over realized holding period | 16.92% |
| Expected holding period | 27.7 months (2.31 years) |
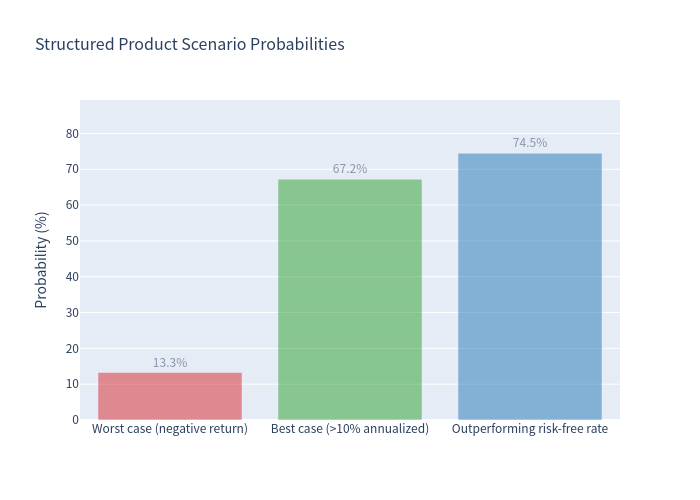
| Probability of a negative return | 13.26% |
| 99% confidence VaR (1 year) | -13.00% |
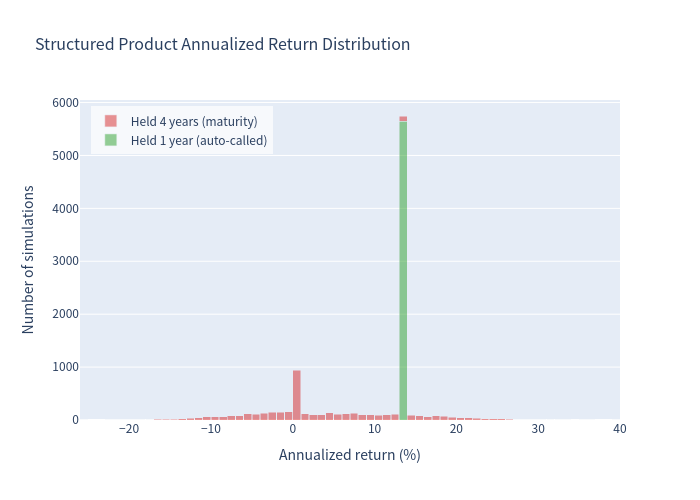
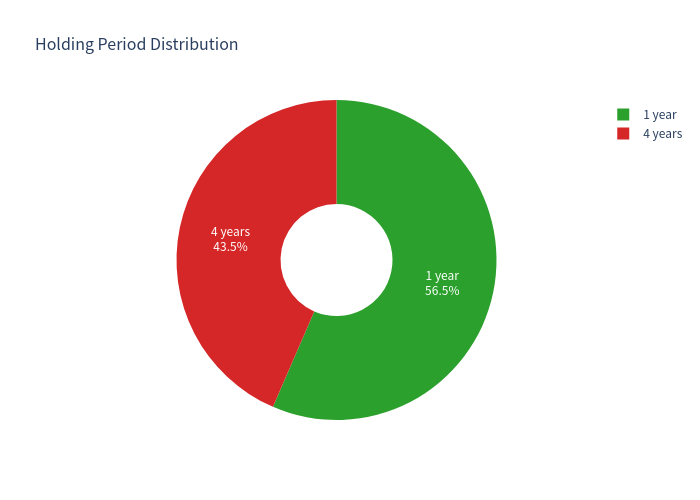
| Probability of auto-call at ~1 year (+13.75%) | 56.50% |
Basic Product Information
How it works (in plain terms):
This is a USD structured note linked to the worst-performing of three major US equity indices — the Nasdaq-100 Technology Sector Index (NDXT), the Russell 2000 (RTY) and the S&P 500 (SPX).
- Auto-call at ~1 year: If, roughly one year after pricing, all three indices stand at or above their starting levels, the note is automatically redeemed at about $1,137.50 per $1,000 (a fixed +13.75%). No further payments follow.
-
If not auto-called, held to ~4-year maturity: your payment is driven by the worst index at maturity:
- Worst index up → you capture 150% of that gain (no cap).
- Worst index down up to 20% → you receive your $1,000 back (20% buffer).
- Worst index down more than 20% → you lose 1% for every 1% beyond the buffer, up to an 80% maximum loss.
- The note pays no periodic interest.
The payoff is subject to the credit risk of Morgan Stanley Finance LLC (guaranteed by Morgan Stanley).
Key Statistics Annualized • 10,000 Monte-Carlo simulations
| Metric | Structured product | Underlying basket* |
|---|---|---|
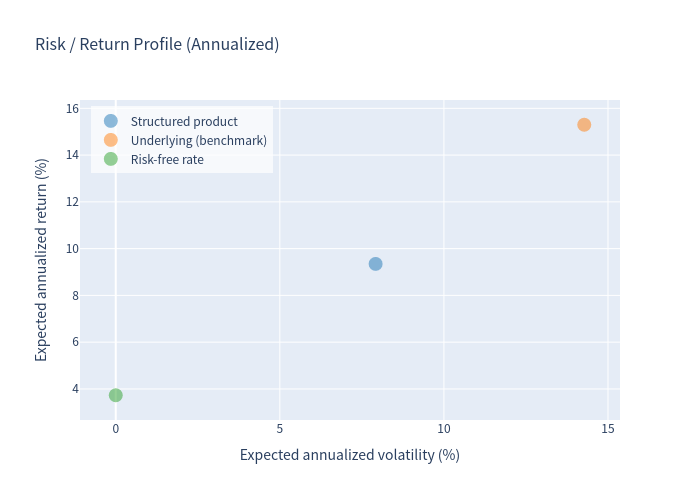
| Expected annualized return | 9.35% | 15.30% |
| Expected annualized volatility | 7.92% | 14.28% |
| Probability of loss | 13.26% | 12.41% |
| 99% confidence VaR (1 year) | -13.00% | -14.44% |
Equal-weight basket of NDXT, RTY and SPX, total return (dividends included), measured over each simulation's own holding period.
Charts
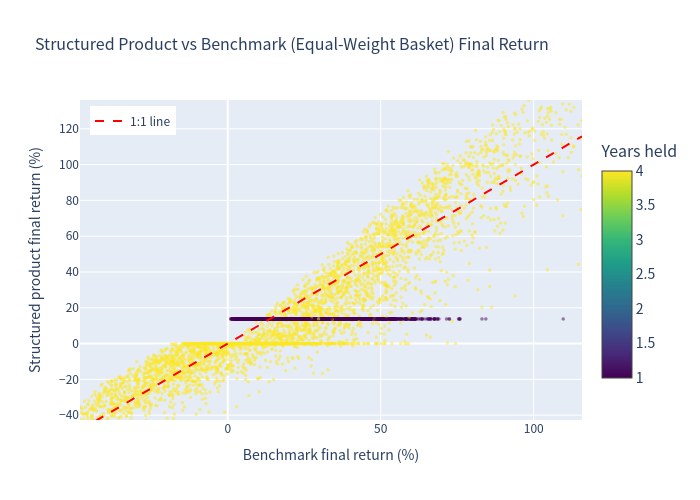
Simulation Outcomes (product vs. benchmark final return)
Scatter of product total return against the equal-weight underlying basket's return over the same realized holding period, across 10,000 Monte-Carlo scenarios.
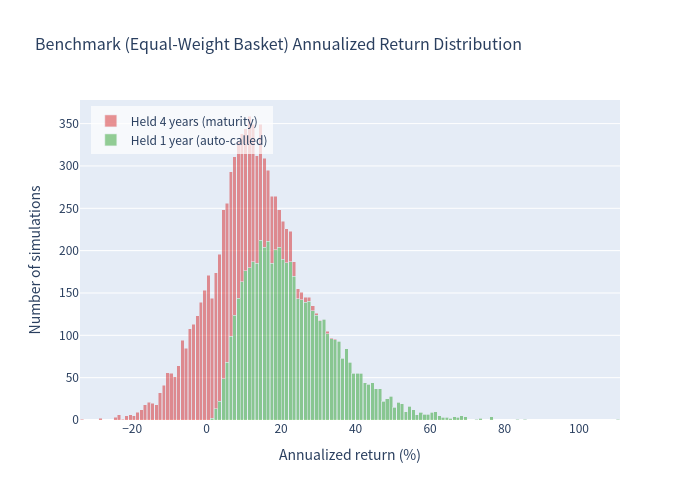
Annualized Return Distributions
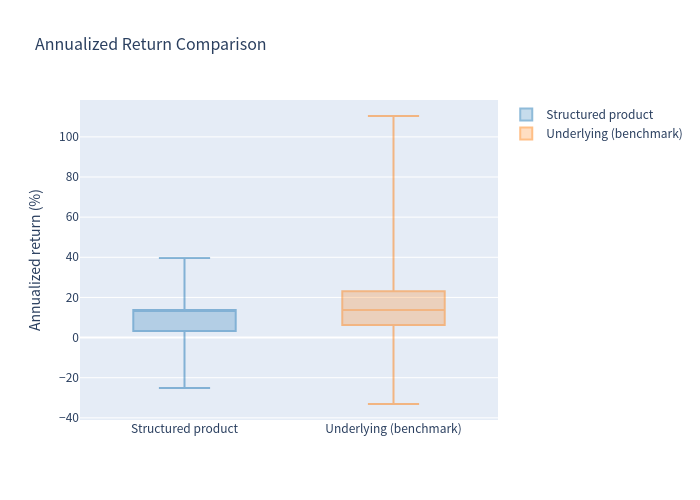
Distribution of annualized total returns for the equal-weight underlying basket across simulated holding periods.
Distribution of annualized total returns for the structured product across simulated holding periods.
Scenario Probabilities & Risk/Return Profile
Probability of each payoff scenario (auto-call, par, partial loss, capped loss, upside participation) across the simulation set.
Risk/return scatter placing the structured product against the underlying basket in annualized return-volatility space.
Return Comparison & Holding Period
Distribution comparison of total returns between the structured product and the equal-weight underlying basket.
Share of simulations ending at the ~1-year auto-call versus those running to the ~4-year maturity.
Investment Commentary
What stands out (potential positives):
- High early-exit probability with a fixed gain: in about 56.5% of simulated scenarios the note is redeemed at +13.75% after only ~1 year, which historically-style favourable markets make a relatively frequent outcome.
- Downside buffer: the 20% buffer absorbs moderate declines (worst index down up to 20% → par), and losses are limited to 80% in extreme tail scenarios.
- Uncapped 150% upside participation at maturity if the worst-performing index finishes higher.
- Lower volatility profile than the direct basket: the structure's annualized return volatility (7.92%) is well below that of the equal-weight underlying basket (14.28%), and its 99% VaR (-13.00%) is comparable to or slightly better than the basket's (-14.44%).
- Better than risk-free in most scenarios: the product outperforms the ~3.73% risk-free rate in 74.45% of simulations, delivers a positive return in 78.43% of them and breaks even at par in a further 8.31%.
This commentary is descriptive only and does not constitute investment advice or a suitability assessment.