Worst‑Of Memory‑Coupon Barrier Reverse Convertible (XS3315832785)
Structured Product Evaluation — Worst‑Of Memory‑Coupon Barrier Reverse Convertible
Instrument: Issuer‑callable certificates with American barrier and memory coupon, worst‑of S&P 500®, EURO STOXX 50® and Nikkei 225® (ISIN XS3315832785, USD, SSPA 1260)
1. Headline Simulation Results
| Metric | Value |
|---|---|
| Expected annualized return (mean of per‑path CAGR) | 10.74% |
| Probability of a negative return | 0.29% |
| 99% VaR (1st‑percentile annualized return) | +10.91% *¹ |
| Worst‑1% Expected Shortfall (annualized) | −5.82% |
| Expected holding period | 5.96 months (≈ 0.50 yr) |
| Expected total return over the realized holding period | 5.25% |
| Median total return over the realized holding period | 3.64% |
¹ The payoff is capped at the coupon rate (≈10.91% annualized when all memory coupons are collected). Because this ceiling is reached in ~99% of simulated paths, the 1st‑percentile (99% VaR) outcome itself sits at the coupon ceiling (+10.91%). The genuine downside is a sub‑1% crash tail: about 0.29% of paths breach the 50% barrier and end below par, with an average loss of ≈ −43.5% (worst path ≈ −57.6%). The worst‑1% Expected Shortfall of −5.82% is the more candid downside figure.
In one sentence: this is an income product that is expected to return about 10.7% annualized, with a ~99%+ chance of finishing positive, but it carries a small (~0.3%) probability of a severe, worst‑of‑linked loss if any index falls through its 50% barrier.
2. Product at a Glance
- What it is: A 1‑year, USD‑settled, worst‑of reverse convertible. Each month the note pays a 0.9092% coupon (≈10.91% p.a. if every month qualifies) as long as all three indices are at or above 60% of their starting level. Missed coupons are remembered and recovered on the next qualifying date.
- Capital protection: None. Principal is at risk. A 50% barrier, observed continuously (American), determines whether the note can lose money at maturity.
- Issuer call: The issuer may redeem at par (100%) plus accrued coupon on any monthly date from month 3 through month 11 — there is no automatic trigger; it is at the issuer's discretion.
- Worst‑of exposure: Outcomes are driven by the weakest of the three indices.
How it works (plain language)
- Coupons: Think of a monthly "vote." If all three indices are still above 60% of where they started, you earn 0.9092% that month. If one slips below 60%, no coupon that month — but the missed amount is not lost; it is paid later once all three are back above 60% (the memory feature).
- If nothing bad happens: You get 100% of principal back plus all coupons – the maximum return is the coupon stream (there is no participation in index upside).
- If an index crashes through 50% at any point (the barrier event): the note becomes exposed to the market. At maturity you get par only if all indices have recovered to at least their starting level. Otherwise you receive the worst performer's percentage change — so a worst index down 40% means roughly −40% on principal.
- Early call: If the market rallies, the issuer will typically call the note early at par + coupon (modelled as a call once the worst index reaches its starting level), so the product often does not last the full year.
3. Key Statistics (10,000 simulated scenarios)
| Strategy | Expected annualized return | Annualized volatility | Probability of loss | 99% VaR (1‑yr) |
|---|---|---|---|---|
| Structured Product | 10.74% | 2.96% | 0.29% | +10.91% |
| Benchmark — equal‑weight basket, event‑matched + dividends *² | 20.87% | 20.38% | 13.16% | −24.29% |
| Benchmark — equal‑weight basket, buy‑&‑hold 1 year + dividends *³ | 12.11% | 16.03% | 21.69% | −25.61% |
| Risk‑free (1‑year T‑bill, 1‑yr average) | 3.81% | 0.00% | – | 3.81% |
² The "event‑matched" benchmark compares the basket over exactly the same holding period as the product in each path. Because early calls cluster in market rallies and short horizons are annualized linearly, this figure is mechanically inflated and should not be read as the basket's expected return. ³ The buy‑&‑hold (unconditional 1‑year) basket is the fairer anchor and confirms the underlying drift assumption of ~10%: expected ≈12.1% including dividends, volatility ≈16.0%, loss probability ≈21.7%, 1‑yr 99% VaR ≈ −25.6%.
Reading the numbers: the product's annualized volatility of ~3% and VaR of +10.9% look almost risk‑free — but that is a direct consequence of the cap: the vast majority of paths land on the same ~10.9% coupon, so dispersion collapses. The true risk is not volatility but a rare, binary crash (barrier breach on the worst index). This "high probability of a modest gain, small probability of a large loss" profile is the defining economics of a reverse convertible.
4. Simulation Results
Figure 1 — Structured‑product vs underlying return (each dot a scenario; colour = years held). The product return sits in a narrow band and does not track the basket's upside: dots cluster at the coupon ceiling for middle/negative basket outcomes and drop sharply only when the basket itself collapses.
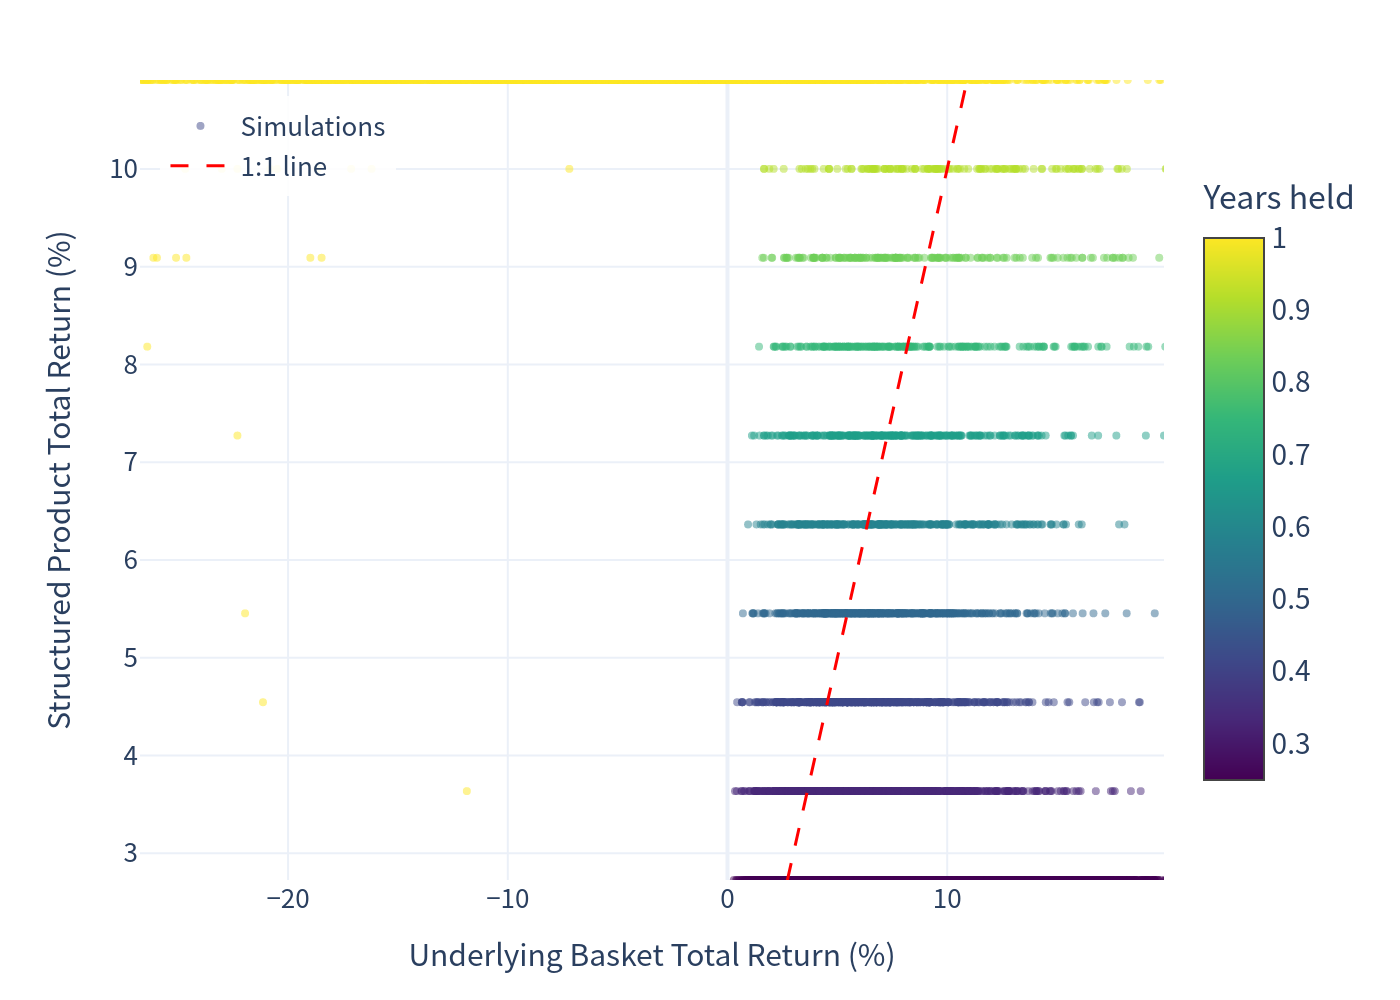
Figure 2 — Distribution of the underlying basket's annualized return (1% bins, split by holding period).
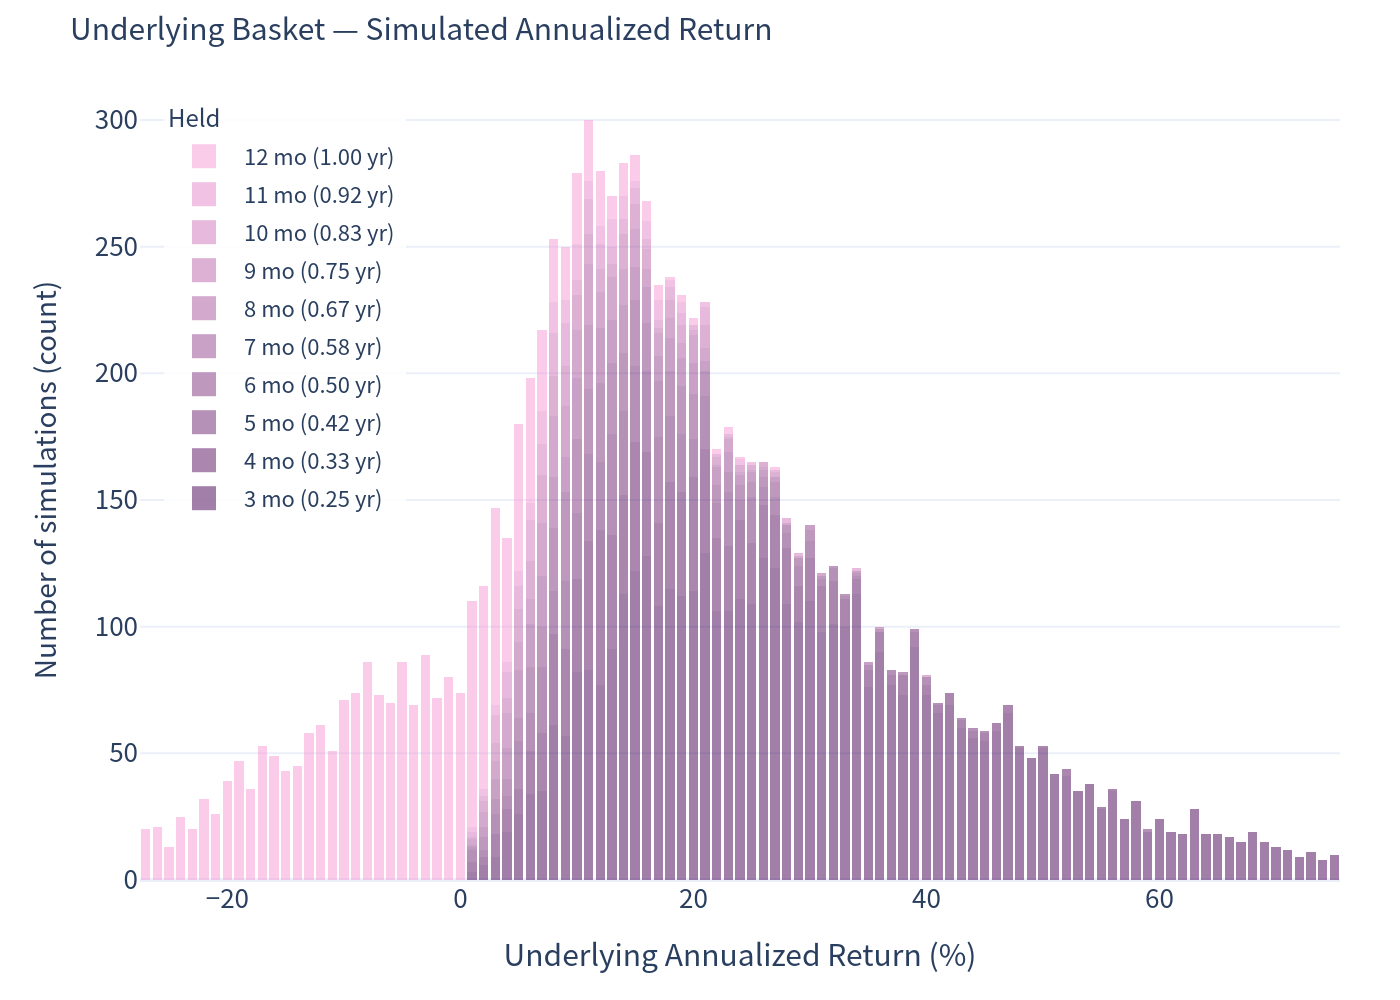
Figure 3 — Distribution of the structured product's annualized return (1% bins, split by holding period). Note the overwhelming concentration at ≈10.9% (the coupon ceiling) and a thin left tail of losses.
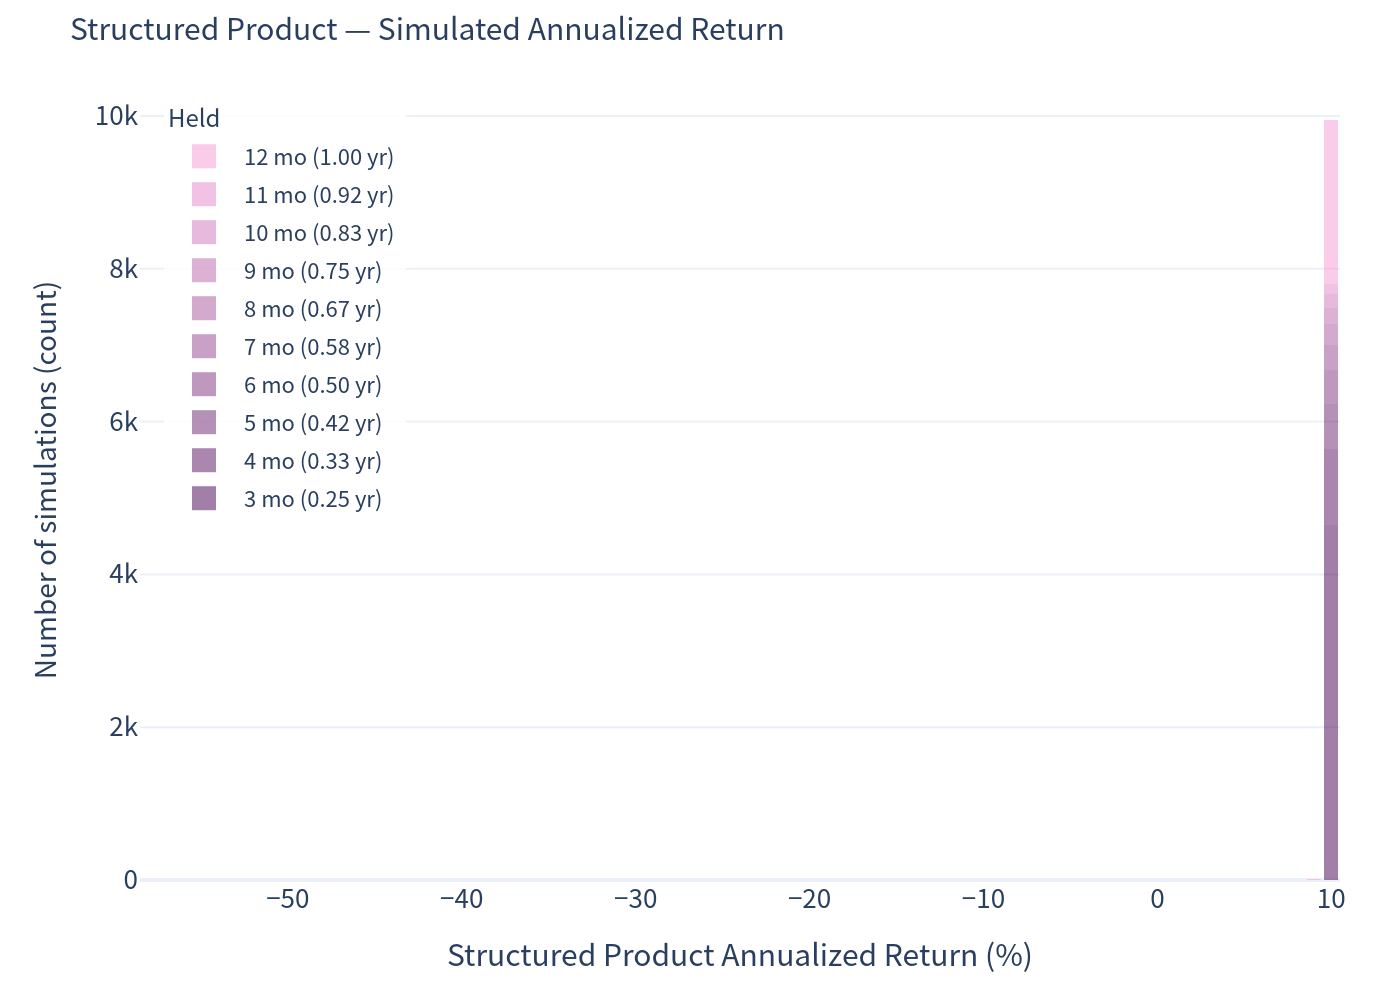
Figure 4 — Risk/return map. The product plots at far lower volatility than either benchmark framing, delivering a return above the buy‑&‑hold basket per unit of realised volatility — while the crash tail is not visible in this picture.
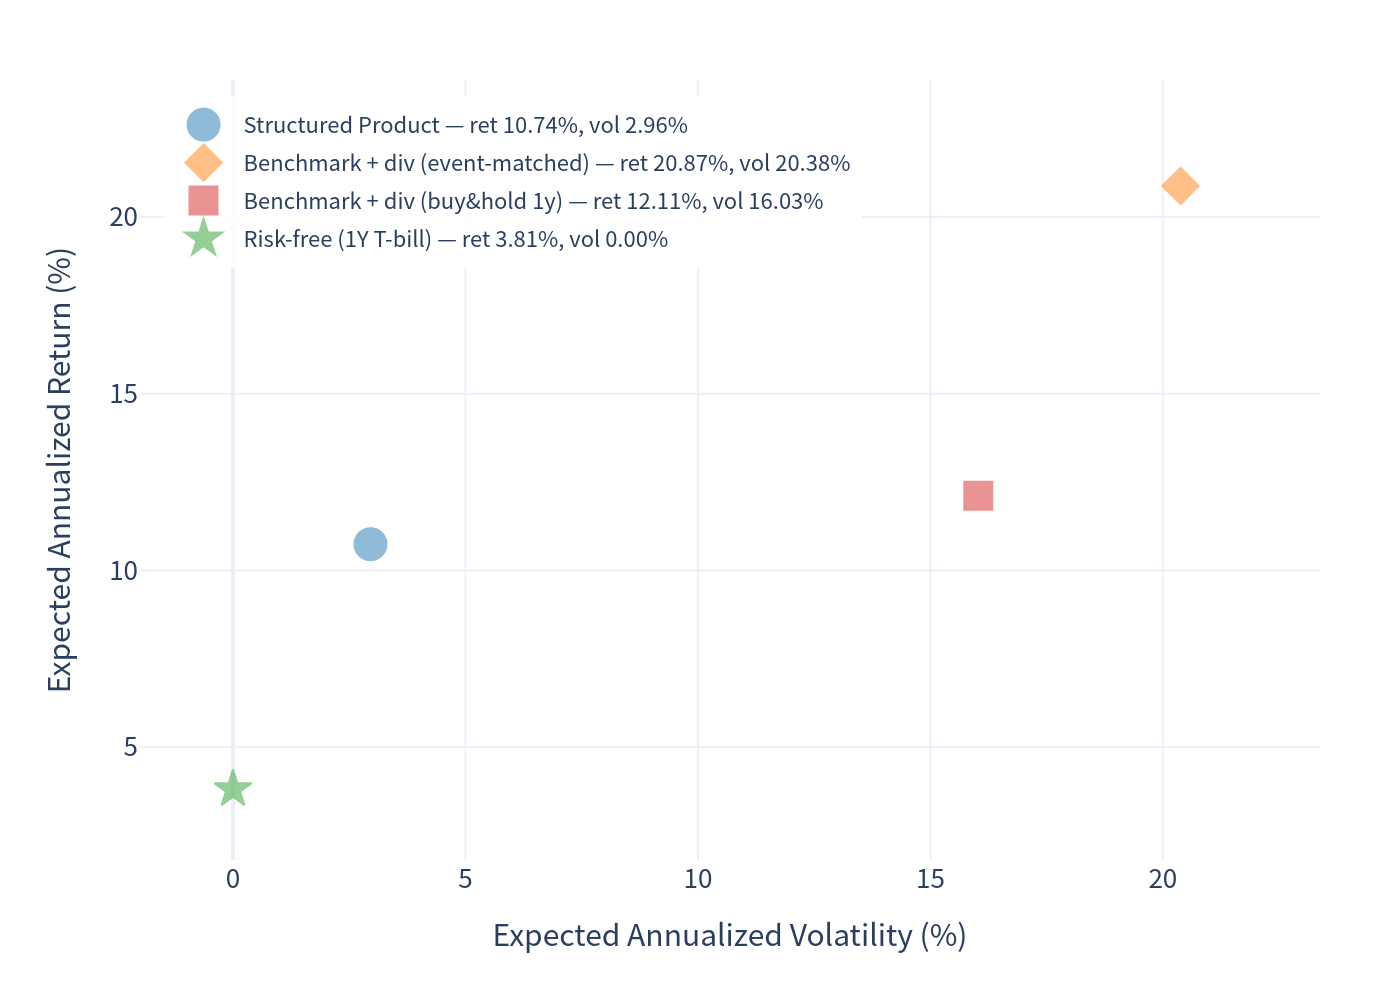
Figure 5 — Annualized‑return box plot (product vs benchmark).
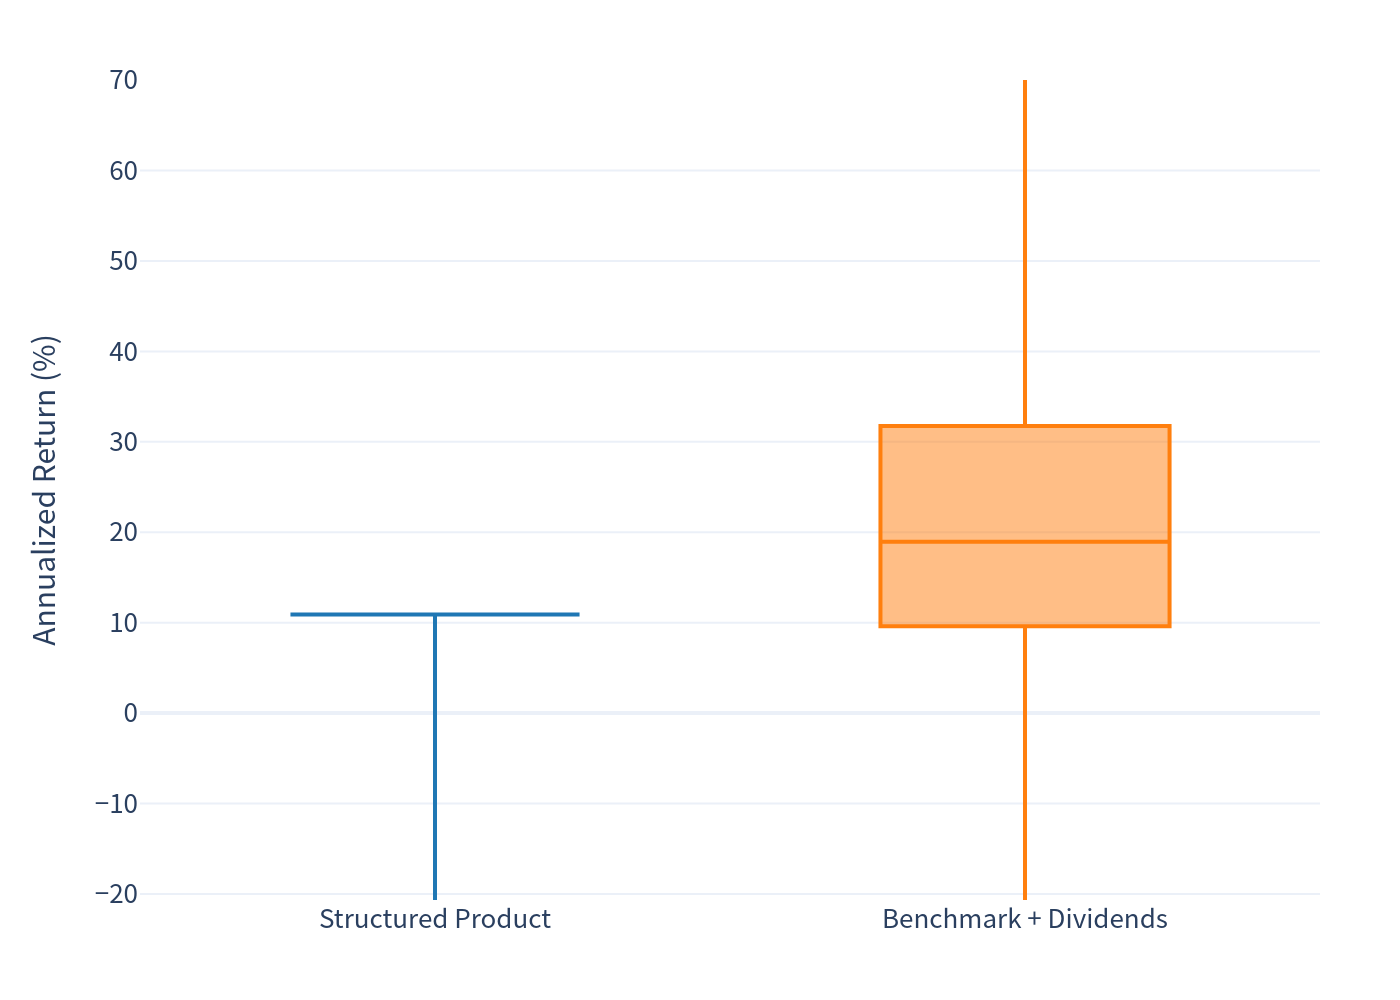
Figure 6 — Scenario probabilities (structured product).
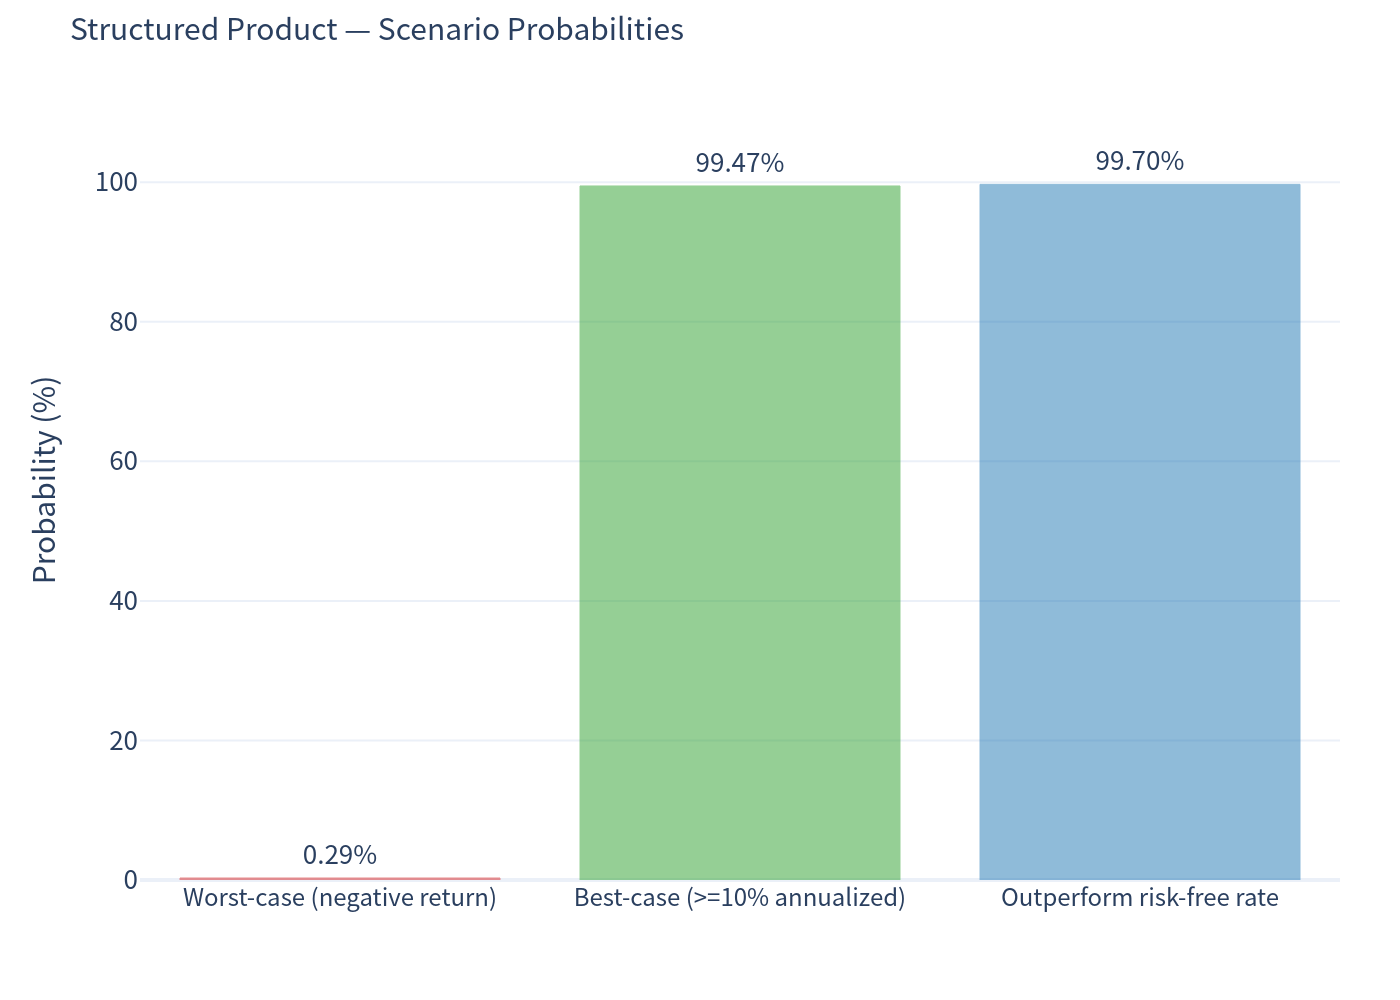
- Worst case (negative return): 0.29%
- Best case (≥10% annualized): 99.47%
- Outperform the risk‑free rate: 99.70%
Figure 7 — Holding‑period distribution. The issuer call is the dominant exit: ~78% of paths are redeemed before maturity (46% already at month 3), so the product usually lasts well under a year.
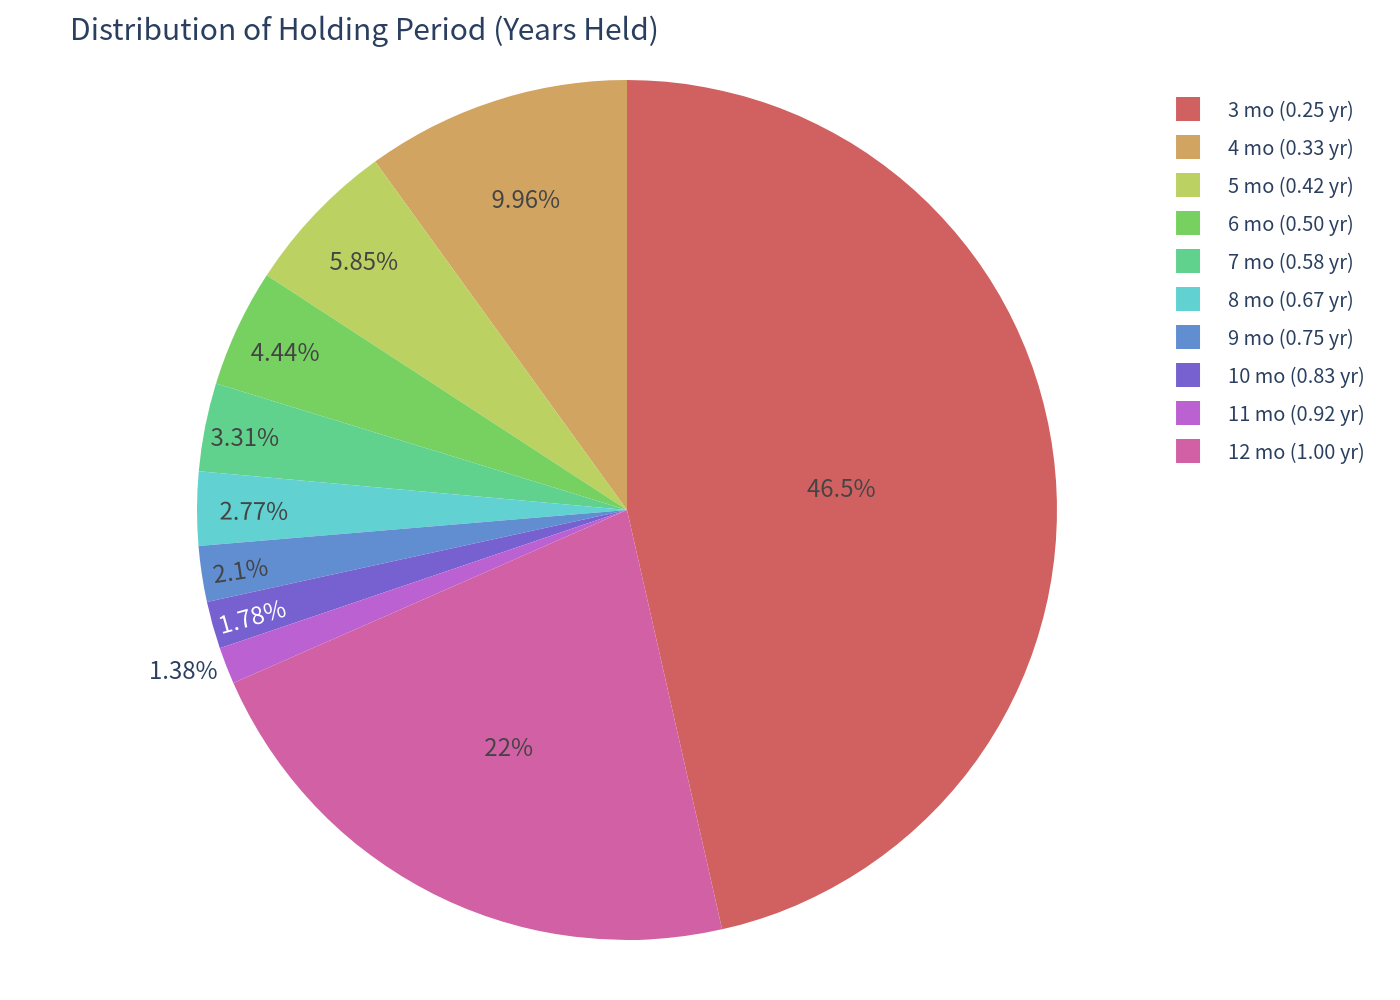
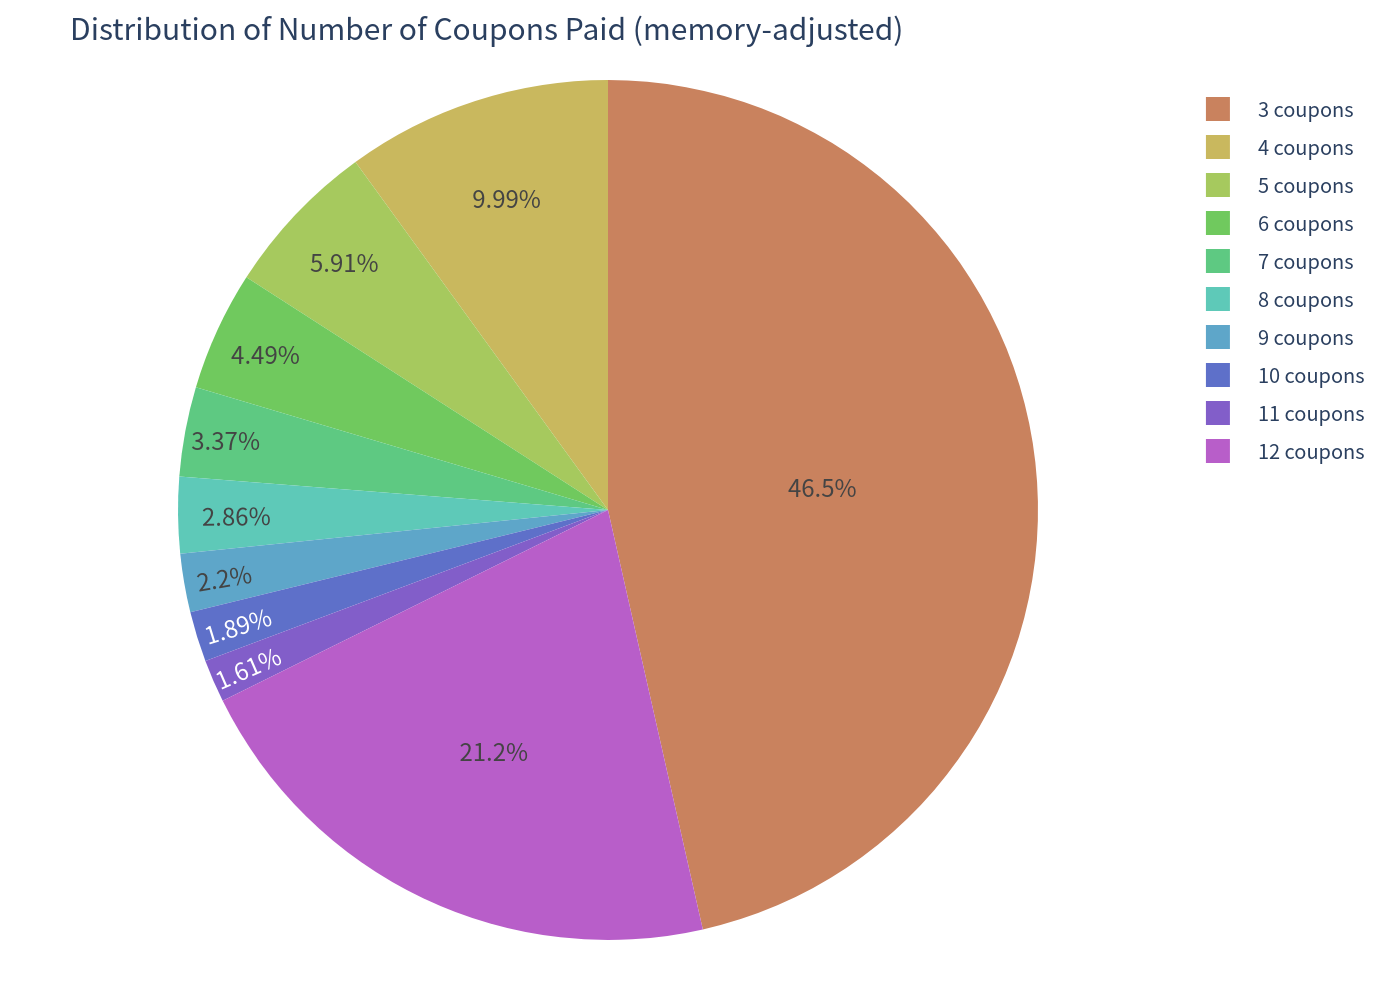
Figure 8 — Number of coupons paid (memory‑adjusted). Average ≈ 5.93 coupons (5.39 index points); the mode is 3 coupons (early call) with a secondary cluster at the full 12.
5. Return, Holding Period and the Tail
Because the holding period is variable (early redemption), the two return measures must be read together:
- Expected total return ≈ 5.25% across an average holding of ≈6.0 months.
- Expected annualized return ≈ 10.74%, close to the coupon ceiling.
- When the note is called quickly (e.g., month 3), a ~2.7% total gain in three months annualizes to ~10.9%. Short holding periods make the annualized figure look large — the economic result there is a modest, low‑risk 2.7% total return, not a "10.9% in a year" outcome.
Downside profile. Downside is concentrated and lumpy:
- Only 0.29% of paths end with a loss, but when they do the average loss is ≈ −43.5% (worst ≈ −57.6%).
- The 1‑st percentile (99% VaR) is +10.91% — i.e., the coupon cap — but the worst‑1% Expected Shortfall is −5.82%, and the sub‑0.5% tail is far worse.
- Losses require all of: (i) an index closing ≤50% of its start at some point (a ~50% drawdown on the weakest of the three), arming the barrier, and (ii) at least one index finishing below its starting level at maturity — in which case you receive the worst performer's ratio. The barrier is continuously monitored, so a single intraday touch is enough to arm the downside.
6. Investment Commentary
Strengths - High, frequent income: up to ~10.9% p.a. paid monthly; memory feature recovers any skipped coupons once performance recovers. - Very high probability of a positive outcome: ~99%+ of simulated paths finish positive, and the return clears the risk‑free rate in ~99.7% of scenarios. - Genuine downside cushion: losses only accrue if a 50% barrier on the worst index is breached, leaving a wide buffer before principal is impaired. - Attractive risk‑adjusted profile: a low realized volatility and positive expected return in the central case — the product's expected annualized return (~10.7%) exceeds an unconditional buy‑and‑hold of the same basket (~12.1% with dividends) per unit of realised volatility. - Issued/guaranteed by a large institution (Bank of America guarantor).
Risks to weigh - Capped upside: you receive only the coupon stream, never index gains — you forgo rallies, and the issuer will tend to call you out precisely when markets are strong. - Worst‑of, American barrier: the weakest of three indices (and any intraday touch of 50%) governs your loss; this is materially riskier than a single‑underlying or European‑observed structure. - Concentrated tail: a ~0.3% chance of a ~40–60% principal loss — the entire economic risk of the product lives in this small, unpleasant tail. - Issuer call risk: early redemption truncates future coupons (reinvestment risk). - Issuer/credit risk: not principal‑protected; repayment depends on the issuer/guarantor.
This document is an analytical evaluation of the simulated payoff and risk metrics only. It does not constitute investment advice, a recommendation, or a suitability assessment.