
9.00% p.a. Multi Barrier Reverse Convertible on Chevron, ExxonMobil & Shell (Quanto CHF)
Headline simulation results
| Metric | Value |
|---|---|
| Expected annualised return | 3.89% |
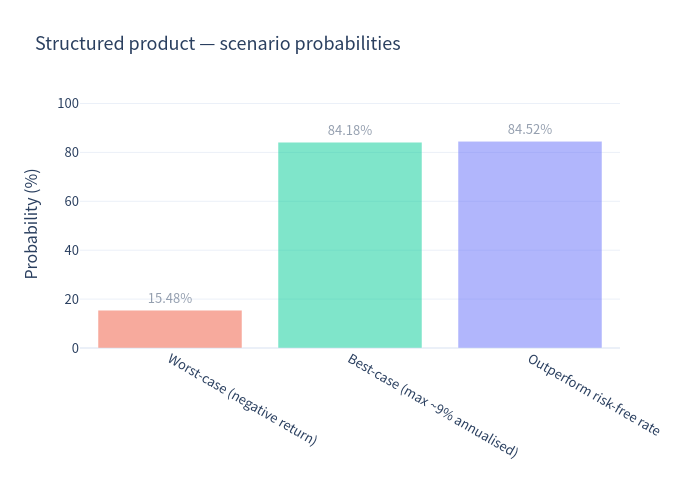
| Probability of a negative return | 15.48% |
| 99% confidence VaR (1 year) | -40.65% |
| Maximum achievable annualised return | 9.00% |
| Probability of achieving the maximum return | 84.18% |
| Probability of surpassing the risk-free rate | 84.52% |
| Expected holding period | 9.4 months |
| Expected total return over the realised holding period | 1.92% |
The product offers a fixed 9.00% p.a. income. In the large majority of simulated outcomes (~84%) the investor suffers no loss and earns the maximum annualised return of 9.00% — par plus the coupons accrued over the period the note is actually held (whether that is 6, 9 or 12 months, since the note is callable). The risk is concentrated in a ~15% tail: if the 69% barrier is breached and the worst-performing share finishes below its starting level, principal is repaid in depreciated shares, producing losses that can reach roughly -58% of notional in the worst simulations.
What it is and how it works
This is a worst-of barrier reverse convertible (a yield-enhancement product) linked to three energy majors: Chevron (CVX), ExxonMobil (XOM) and Shell (SHELL.AS). The CHF-denominated note is quanto-protected, so the investor carries no USD/EUR currency risk.
In plain terms:
- Coupon — always paid. The note pays 9.00% p.a., i.e. CHF 22.50 per CHF 1,000 each quarter, on 24/12/2026, 24/03/2027, 24/06/2027 and 23/09/2027. Coupons are paid on every scheduled date the note remains outstanding, regardless of how the shares perform (subject to the issuer's creditworthiness); after an early redemption, no further coupons are paid.
- Conditional principal protection (the barrier). Each share carries a 69% barrier, watched continuously over the whole term. If none of the three shares ever trades at or below 69% of its starting level, the investor gets 100% of nominal back at maturity, whatever the shares did.
-
When protection is lost. If at least one share touches its 69% barrier at any time, the barrier is "knocked in" and maturity redemption depends on the
worst-performing share:
- if the worst share finishes at or above its starting level → 100% of nominal;
- if the worst share finishes below its starting level → the investor receives that worst share (or its cash equivalent), i.e. a loss proportional to the worst share's fall.
- Issuer call. The issuer may redeem the note early on 24/03/2027 or 24/06/2027 (paying par plus the coupon then due). This option caps the investor's ability to stay invested when the shares rise.
Upside is capped: in every scenario the repayment of principal is at most 100%. Returns come only from the fixed coupon.
Key statistics
| Metric | Structured product | Underlying basket (total return) |
|---|---|---|
| Expected annualised return | 3.89% | 14.48% |
| Expected annualised volatility | 12.55% | 25.33% |
| Probability of loss | 15.48% | 30.30% |
| 99% VaR (1 year) | -40.65% | -37.40% |
The benchmark is an equal-weighted basket of the three underlying shares (Chevron, ExxonMobil, Shell), including each share's dividend yield. Compared with holding the basket outright, the product delivers a much smoother return profile (roughly half the volatility), a lower probability of loss and an attractive capped income, at the cost of giving up most of the basket's upside.
Charts
Simulation outcomes — product vs underlying
Each point is one simulated path; the dashed line is 1:1.
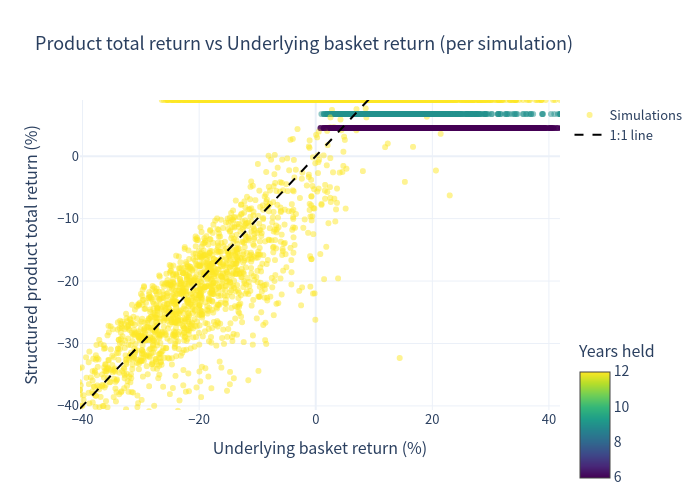
The cloud sits above the 1:1 line on the downside (coupons cushion moderate losses and the barrier protects against shallow dips) but is firmly capped at +9% on the upside — the product never participates in a strongly rising energy market.
Annualised return distributions
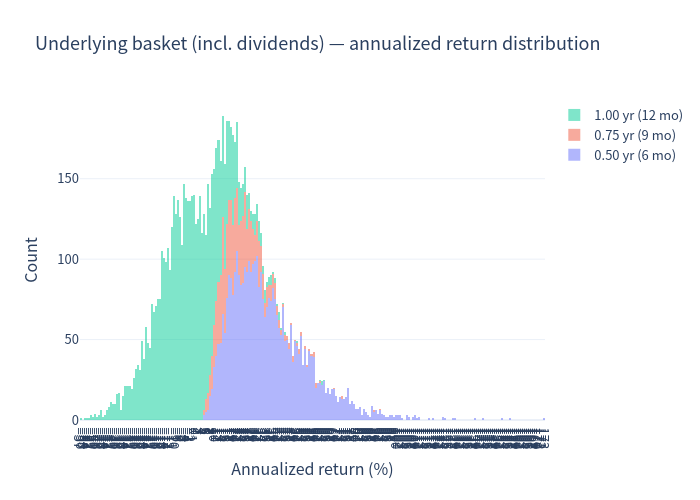
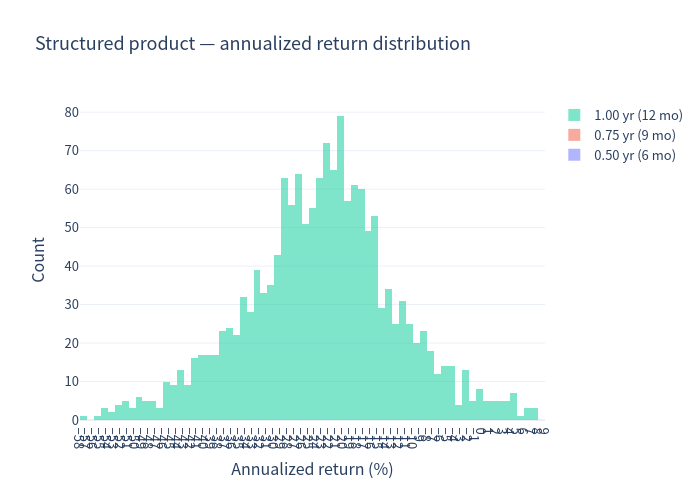
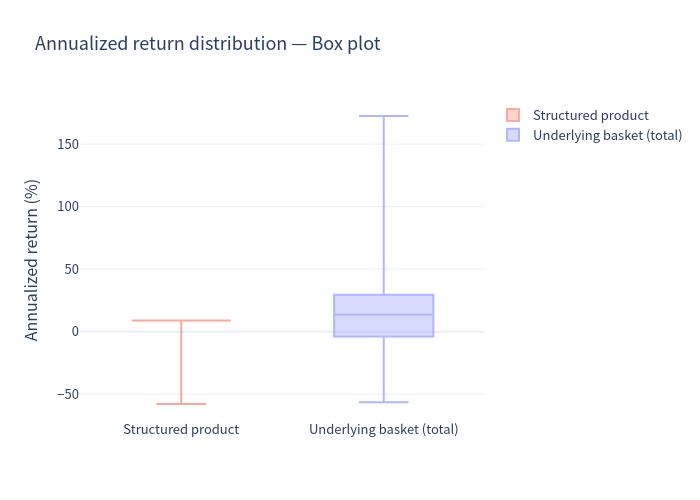
The underlying distribution is wide and near-symmetric, with a long right tail (bars are coloured by holding period). The product distribution is strongly bimodal: an 84% spike at the +9% cap, and a separate loss cluster extending to about -58%.
Scenario probabilities
Risk / return
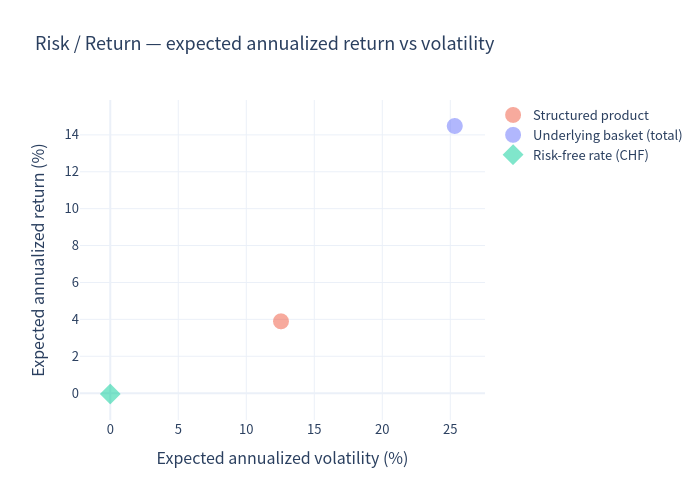
Return distribution comparison
Holding period and coupon outcomes
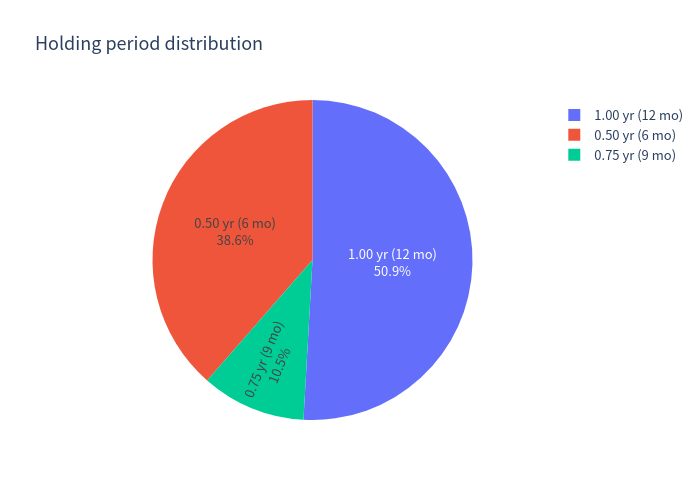
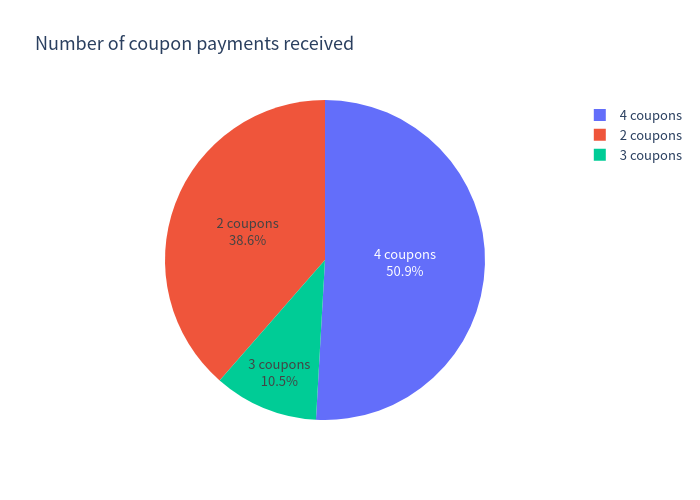
There is a 49.1% chance of early redemption (38.6% after 6 months, 10.5% after 9 months); otherwise the note runs the full 12 months. Consequently the investor receives 4 coupons ~50.9% of the time, 2 coupons ~38.6% of the time and 3 coupons ~10.5% of the time.
Investment commentary
Points worth noting
- High headline carry. A 9.00% p.a. coupon in a CHF environment where short-term rates are close to zero is a substantial income premium, paid on every coupon date regardless of market moves.
- A wide, continuously-observed barrier. The 69% barrier is only breached in ~16.5% of simulations, so in the great majority of cases principal protection holds and the investor simply collects the coupon.
- Favourable risk profile vs the underlying. Simulated volatility is ~half that of the underlying basket (12.55% vs 25.33%), the probability of loss is lower (15.48% vs 30.30%), and coupons cushion the downside relative to a direct holding.
- Income is the dominant driver. Because repayment principal is capped at par, the coupon is the return; the structure behaves much like a high-coupon, short-dated credit note with a conditional equity-linked tail.
Risks to keep in mind
- Capped upside. The product can never return more than par plus the fixed coupons; a sharp rally in energy equities is fully forgone.
- Worst-of, multi-asset downside. After a knock-in, the loss is driven by the single worst share — correlation between the three energy majors is high, so a sector-wide sell-off can trigger the barrier and a loss simultaneously.
- Tail loss is material. The 1-year 99% VaR is about -40.65%, and the worst simulated outcome is roughly -58% of notional.
- Issuer call risk. Because the note can be called early (up to ~49% of the time), the effective holding period is uncertain and the investor may face reinvestment risk if the structure is redeemed after 6–9 months.
- Credit exposure. Returns depend on the issuer (Leonteq Securities AG, rated BBB-) meeting its obligations.
All figures are drawn from a 10,000-path simulation of the three underlyings over the ~12-month product term. Returns are expressed in index points on a 100 notional. The benchmark basket return is computed over the same horizon as the realised (often early-terminated) holding period of the note and includes dividend yield; because early termination tends to occur in rising markets, this horizon-matched comparison can flatter the index during up-markets.