
info@tokenengine.ai
Structured Product Evaluation
Morgan Stanley — SPUMP40 Buffered Jump Securities with Auto-Callable Feature due March 31, 2031
Key Metrics at a Glance
1. Headline Simulation Results
| Highlight | Value |
|---|---|
| Expected annualized return | +10.09% |
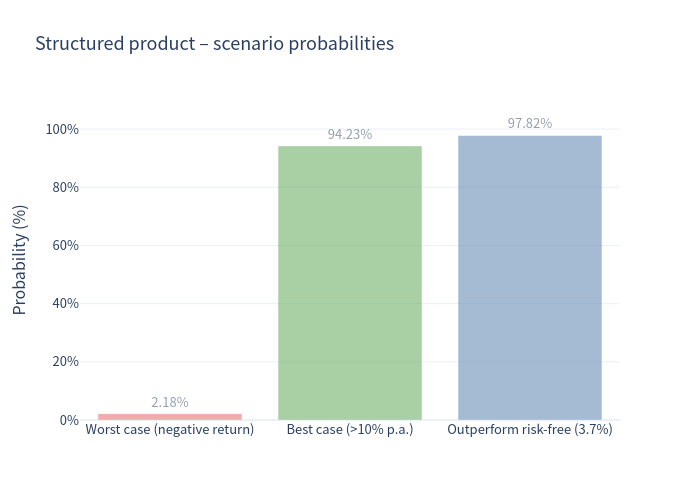
| Probability of a negative return | 2.18% |
| 99% confidence VaR (1 year) | −6.41% |
| Expected annualized volatility | 2.53% |
| Probability of outperforming the risk-free rate (3.70%) | 97.82% |
| Probability the note is autocalled early | 97.75% |
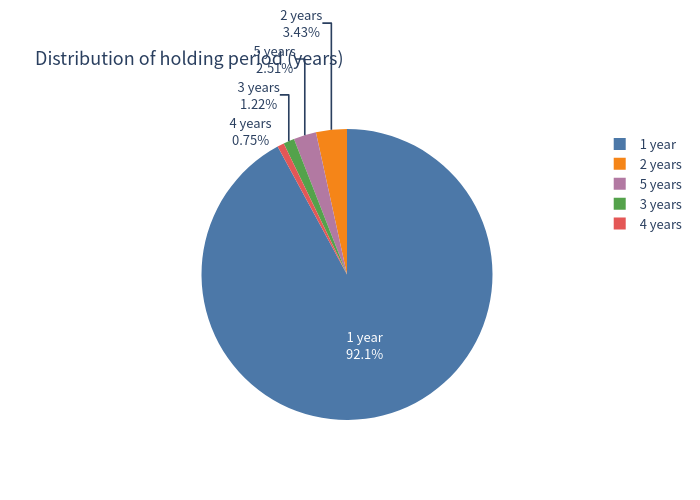
| Expected holding period | ≈ 14.2 months (≈ 1.2 years) |
| Expected total return over the realized holding period | +10.72% |
The note behaves like a short-dated, high-probability ~10% p.a. instrument: because the early-redemption trigger (85% of the starting level) sits below the strike, the large majority of simulated paths redeem at the very first observation (≈12 months) at a fixed ≈10.5% payout.
2. Basic Product Information
- Issuer: Morgan Stanley Finance LLC (guaranteed by Morgan Stanley). All payments are subject to the issuer's credit risk.
- Underlying: S&P U.S. Equity Momentum 40% VT 4% Decrement Index (SPUMP40) — a leveraged / volatility-targeted U.S. equity-momentum index carrying a 4% p.a. decrement. A directionally similar U.S. equity-momentum ETF is used here as the tradable proxy for illustration.
- Denomination: $1,000 per security, USD. No coupon / no periodic interest.
How it works (plain language)
- No coupon. The security pays nothing along the way; all return comes from an early-redemption payment or a single payment at maturity.
- Automatic early redemption. Once a month — starting one year after issue — if the index closes at or above 85% of its starting level, the note is redeemed immediately and pays a fixed amount that ramps from about $1,105 (≈10.5% p.a.) after year 1 to about $1,516 after year 5.
- If never redeemed early. At maturity the note pays $1,500 (+50%) provided the index has not fallen more than 15%. If it has fallen further, the investor absorbs 1% of loss for every 1% decline beyond −15% (a 15% buffer; worst case −85%, i.e. $150).
- Upside is capped at the fixed early-redemption / jump amounts; there is no participation beyond the fixed payouts.
3. Key Statistics (Annualized)
| Metric | Structured product | Underlying (total return) | Risk-free |
|---|---|---|---|
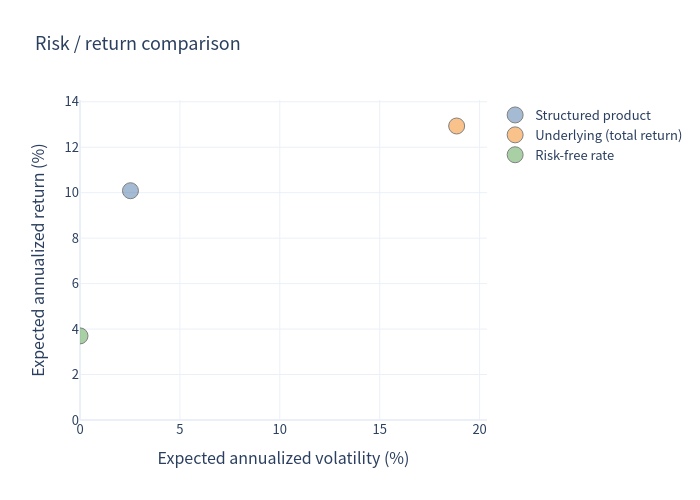
| Expected annualized return | 10.09% | 12.93% | 3.70% |
| Expected annualized volatility | 2.53% | 18.85% | – |
| Probability of loss | 2.18% | 30.37% | – |
| 99% confidence VaR (1 year) | −6.41% | −13.52% | – |
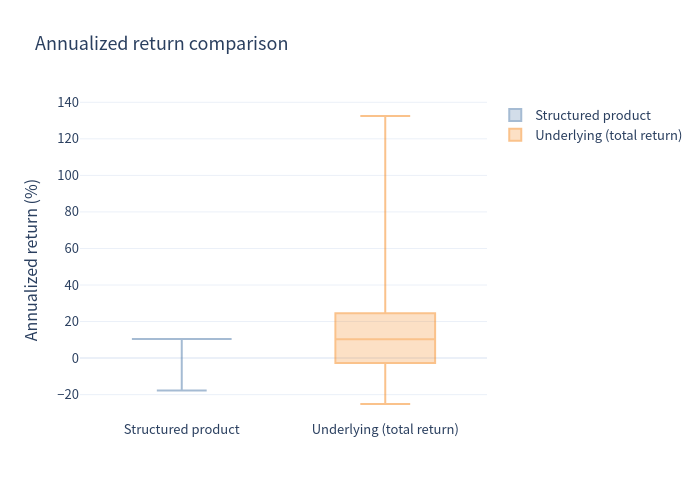
The structured product produces a much smoother return stream than the underlying (annualized volatility ≈2.5% vs ≈18.9%; 1-year VaR −6.4% vs −13.5%). This is a direct consequence of the structure — the note is redeemed early at a fixed amount in nearly every path, so returns cluster tightly around +10% p.a.
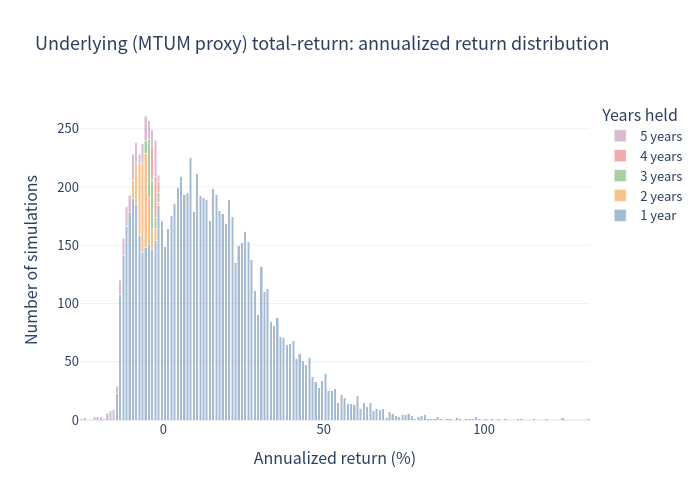
Underlying returns are measured over each path's realized holding period (the month in which the note terminated), for an apples-to-apples comparison. Because the note only ends early when the index is at or above 85%, the benchmark's measured downside is milder than a fixed 5-year buy-and-hold would show, and its distribution is strongly positively skewed and fat-tailed — so its 99% VaR (−13.52%) is materially better than a normal approximation of the same mean/volatility would imply.
4. Simulation Outcomes
Outcome Scatter
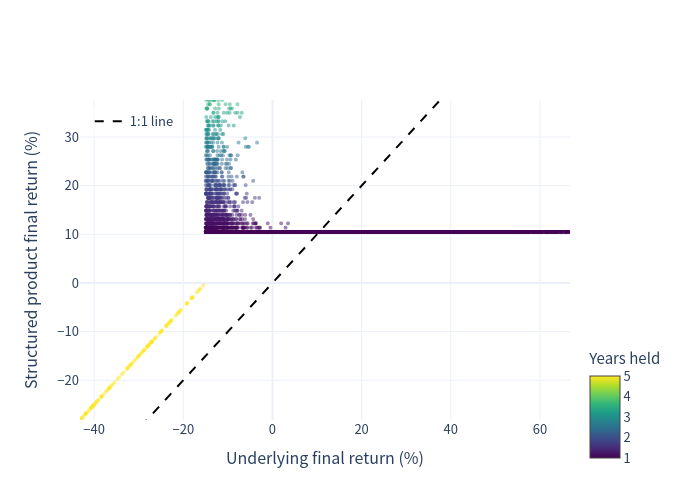
Each point is one simulation: the underlying's final return (x-axis) versus the structured product's final return (y-axis). Because the note is autocalled early almost everywhere, the product's return is pinned near +10% across a wide range of underlying outcomes — the payoff is essentially flat (capped) until the underlying falls far enough to breach the −15% level.
Underlying Return Distribution
Product Return Distribution
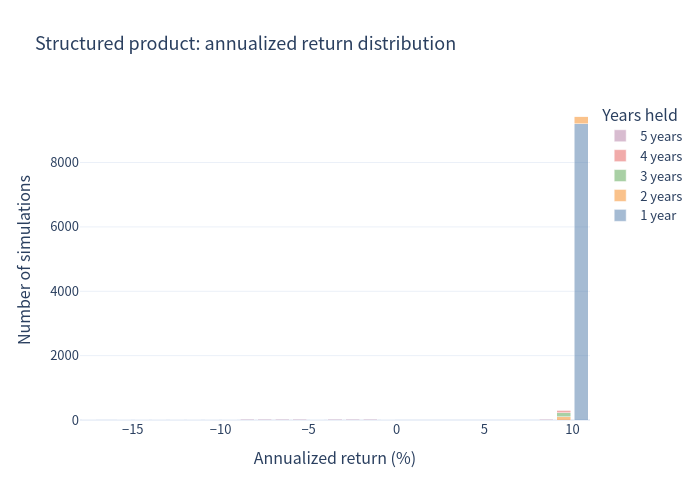
The underlying's annualized returns are wide and fat-tailed: the bulk lies between roughly −26% and +50%, with a thin tail reaching +133%. The structured product's returns are concentrated in a single spike near +10% (year-1 redemptions), with a small left tail from the ~2% of paths that reach maturity below the buffer.
Scenario Probabilities
Risk / Return Comparison
Annualized Return Box Plot
Holding Period Distribution
5. Investment Commentary
Potential advantages
- High probability of a positive, rate-beating outcome. In ≈98% of simulated paths the note redeems early at a fixed payout worth roughly +10% annualized, comfortably above the ~3.7% risk-free rate.
- Defined, capped upside with a buffer. Even if the note is never called, the 15% buffer protects against declines of up to 15% at maturity.
- Short expected holding period. The expected life is only ≈1.2 years, so capital is recycled quickly (assuming the issuer remains solvent).
- Low mark-to-market volatility in the simulation, since outcomes are dominated by the fixed early-redemption amount.
Risks and drawbacks
- Return is capped. The note captures only ~10% p.a. (or the +50% jump), so it materially underperforms the underlying in strong markets (the underlying proxy averages ~12.9% with dividends, and its upper tail reaches far higher).
- Asymmetric downside beyond the buffer. If the index is below −15% at maturity, losses accrue 1:1 and can reach −85%. There are no coupons to cushion this; the simulated average return of the paths that ran to maturity was negative.
- Early redemption is the base case, not the exception. With a trigger set at 85% (below the strike) and a positive drift, the note is called almost immediately, so the investor is very likely to be re-invested into a lower-rate environment after ~1 year.
- Issuer credit risk. Payments depend on Morgan Stanley; the estimated issue value ($906.30) is below par, reflecting embedded costs.
- Underlying-index caveats. SPUMP40 is a leveraged, volatility-targeted index (the term sheet flags "significant leverage" and a 4% p.a. decrement that reduces returns in all markets). The ETF proxy used here does not replicate that leverage or the 4% drag; the real underlying would be more volatile and drift lower, which would raise the probability of breaching the −15% level and reduce the note's expected return. Actual results would therefore likely be worse than simulated.
This analysis is a quantitative simulation for illustration only and is not investment advice or a suitability assessment.