
Buffered Jump Securities with Auto-Callable Feature — Investment Analysis
Headline Simulation Results
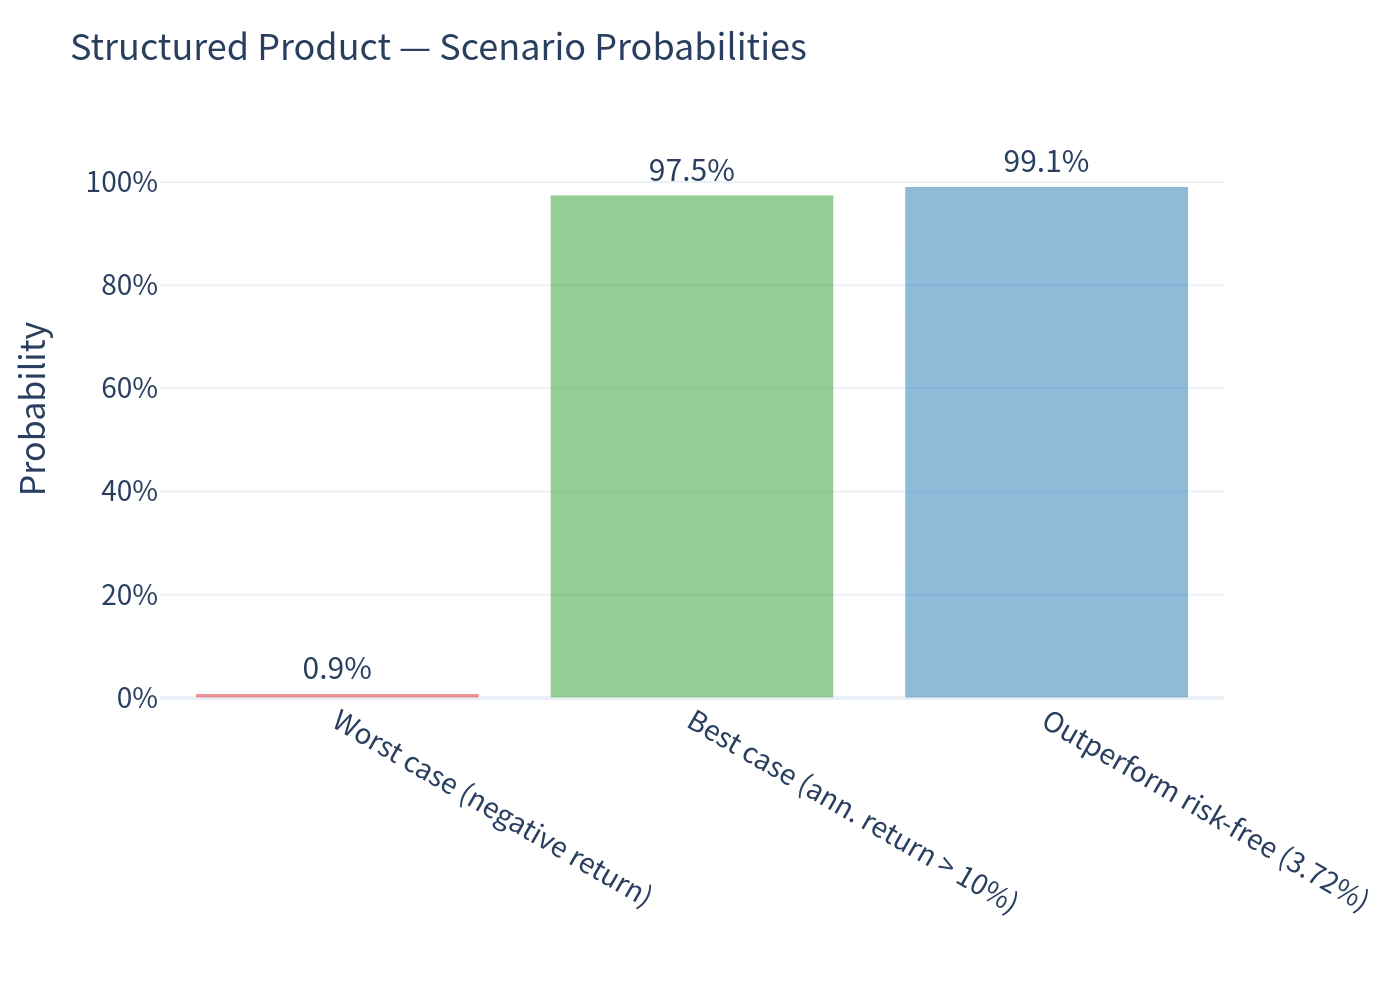
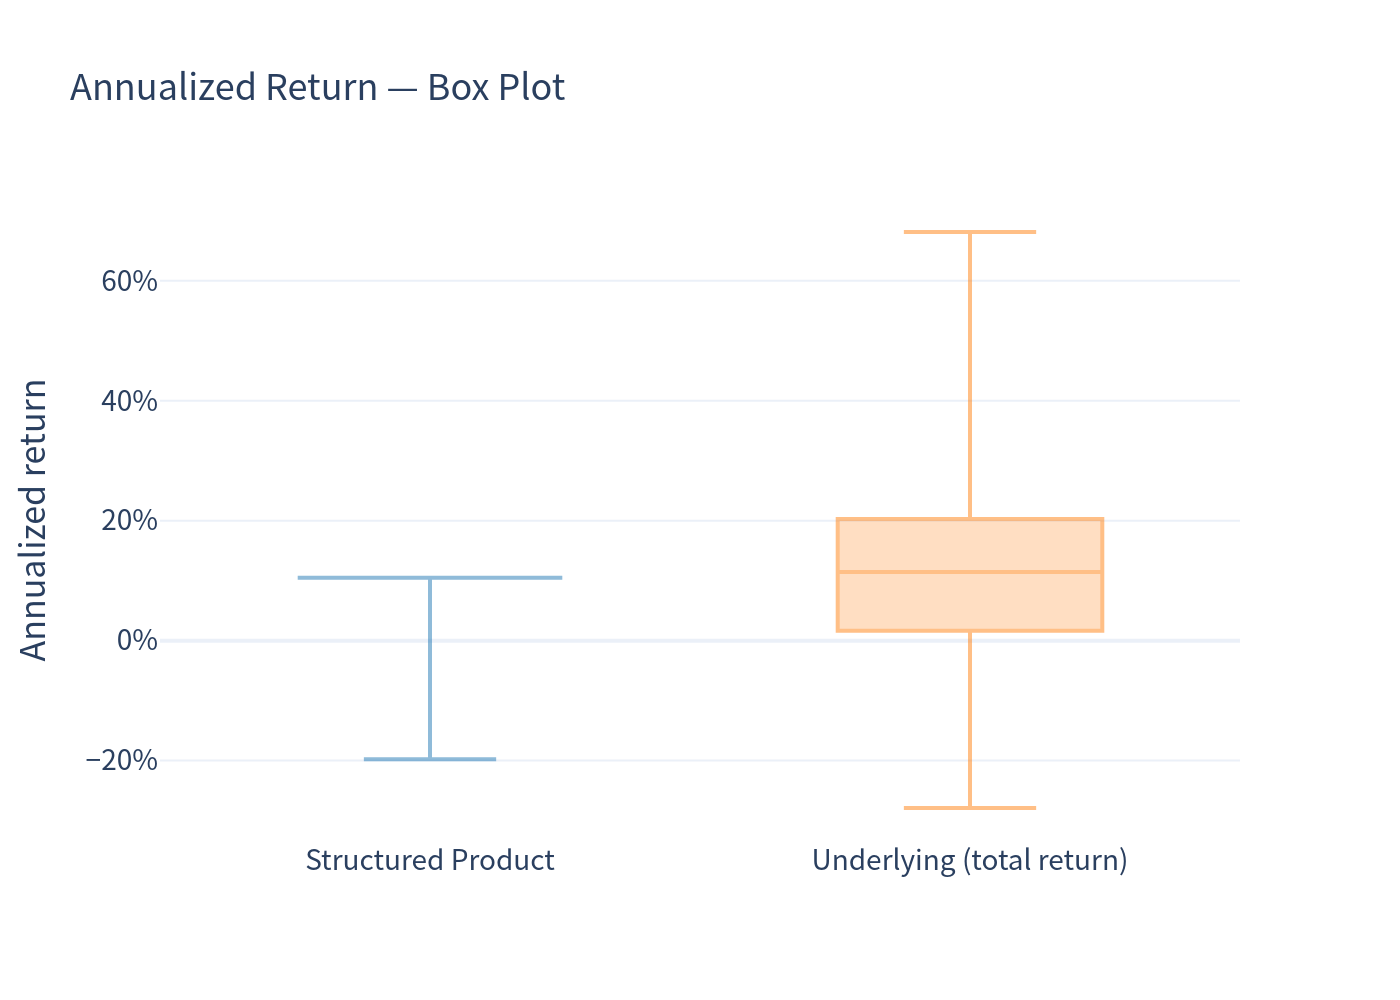
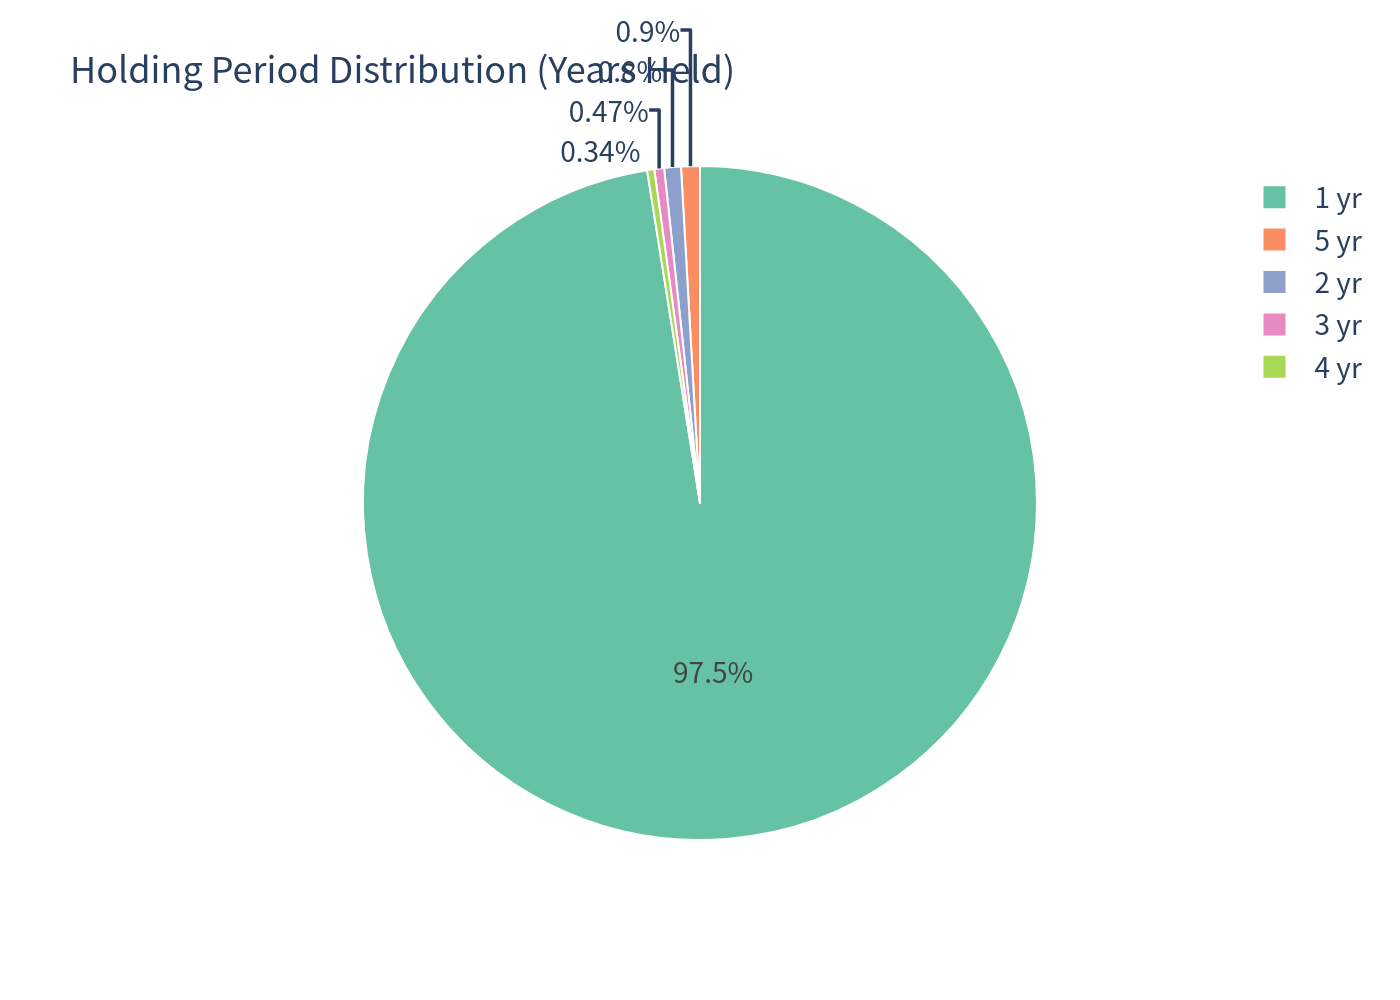
The simulated outcome distribution is highly skewed toward a quick, fixed positive result: in 97.5% of paths the note is auto-called and held for a single year, returning ~10.5%. Losses are rare (0.88% of paths) but, when they occur, they are driven by a deep, sustained equity drawdown and can be significant (worst simulated total return ≈ -66.8%).
Product Overview — How It Works
This is a 5-year, auto-callable "buffered jump" note linked to a single U.S. equity index. It pays no interest. Its payoff has three simple parts:
Auto-call (early redemption)
Each month, starting one year after issue, the note checks whether the index is at or above 85% of its starting level.
- If yes, the note redeems immediately and pays a fixed amount that grows the longer it stays outstanding — roughly a 10.0%–11.0% per-annum return (e.g., ≈ +10.5% if called after one year). Nothing further is paid.
- Because the call hurdle is low (85%) and equity markets drift upward, the note is very likely to redeem after the first year.
Maturity "jump" (if never called)
If the note survives to maturity and the index finishes at or above 85% of its start, the investor receives a fixed $1,500–$1,550 per $1,000 (a "jump" of +50% to +55%). There is no upside participation beyond this fixed amount.
Buffered downside (if the index finishes below 85%)
The investor loses 1% for every 1% the index falls beyond the first 15%. In other words the first 15% of decline is absorbed by a buffer. The payoff floor is 15% of principal ($150).
Key Statistics
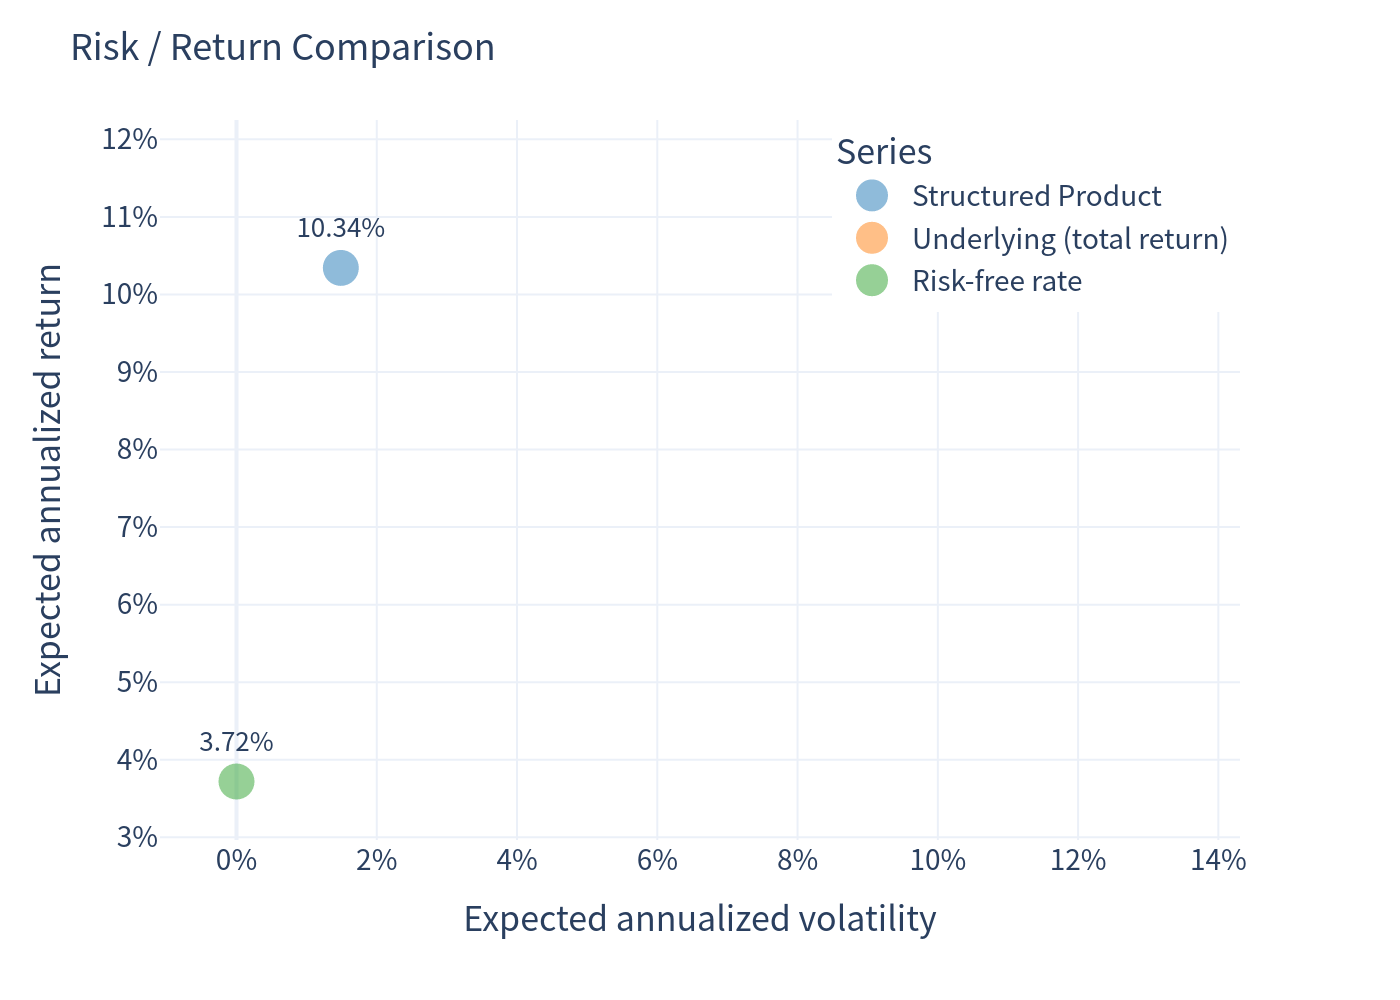
Annualized; based on 10,000 Monte-Carlo paths over the 60-month horizon. The broad U.S. equity index below serves as both simulation proxy for the underlier and as the comparison benchmark.
| Expected Annualized Return | Annualized Volatility | Probability of Loss | 99% VaR (1-yr) | |
|---|---|---|---|---|
| Structured Product | 10.34% | 1.49% | 0.88% | +8.95% |
| Underlying (price index) | 10.52% | 13.22% | 23.70% | -13.70% |
| Underlying (total return, incl. dividends) | 11.50% | 13.22% | 21.71% | -12.72% |
The structured product delivers a return close to the underlying's expected return but with dramatically less modelled volatility (~1.5% vs ~13%) and a far lower loss probability, because the auto-call feature locks in a fixed gain early and the 15% buffer cushions the downside at maturity.
Charts
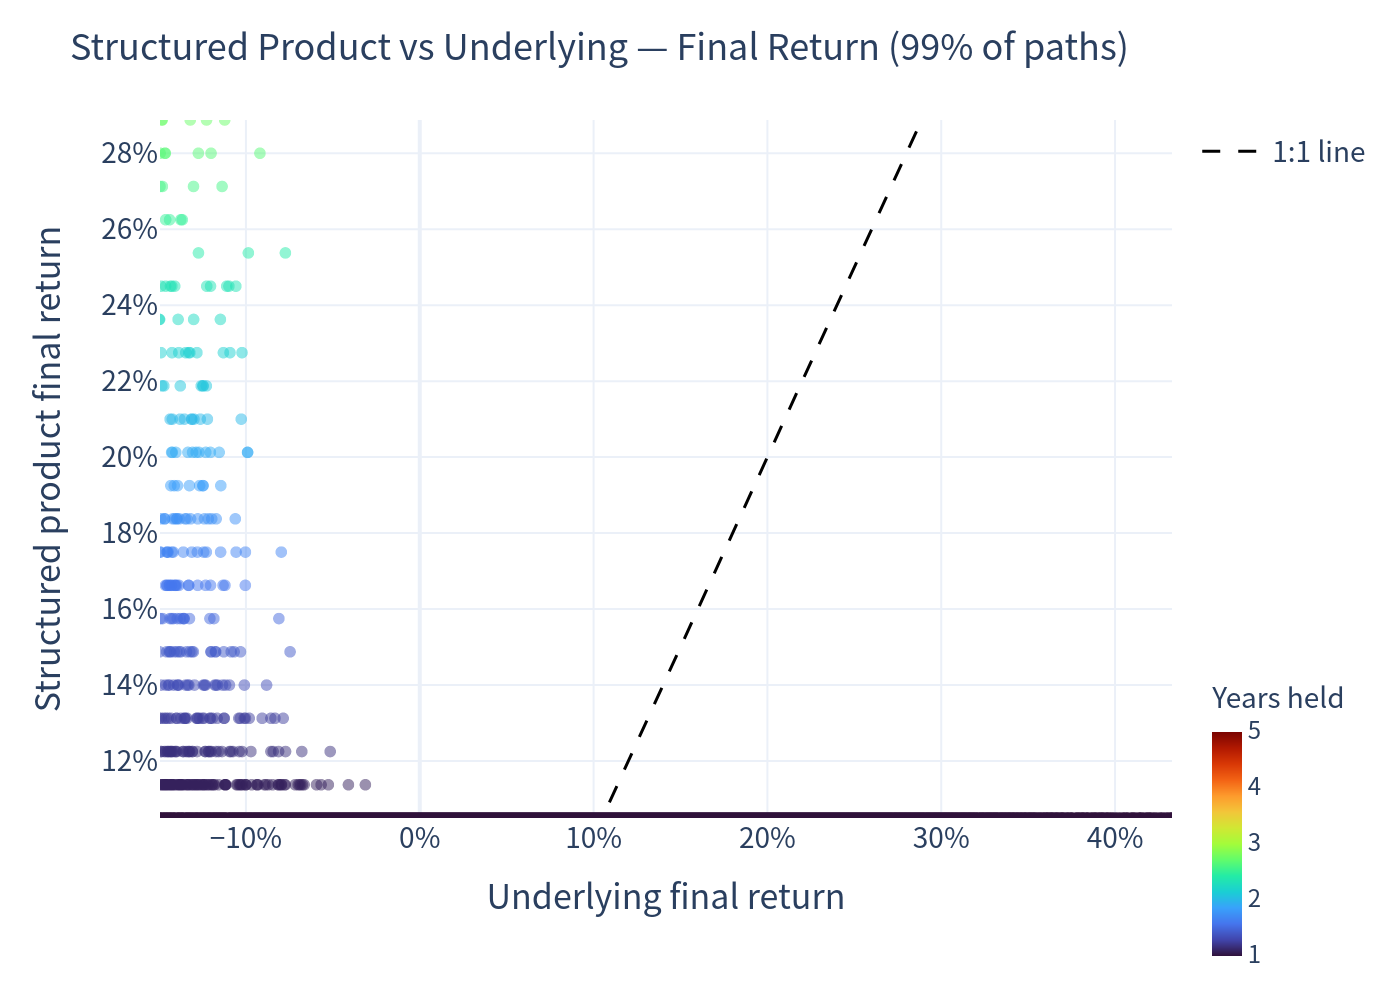
Final-return scatter — Product vs Underlying
Each point is one simulation; colour indicates the number of years held. The dashed line is 1:1.
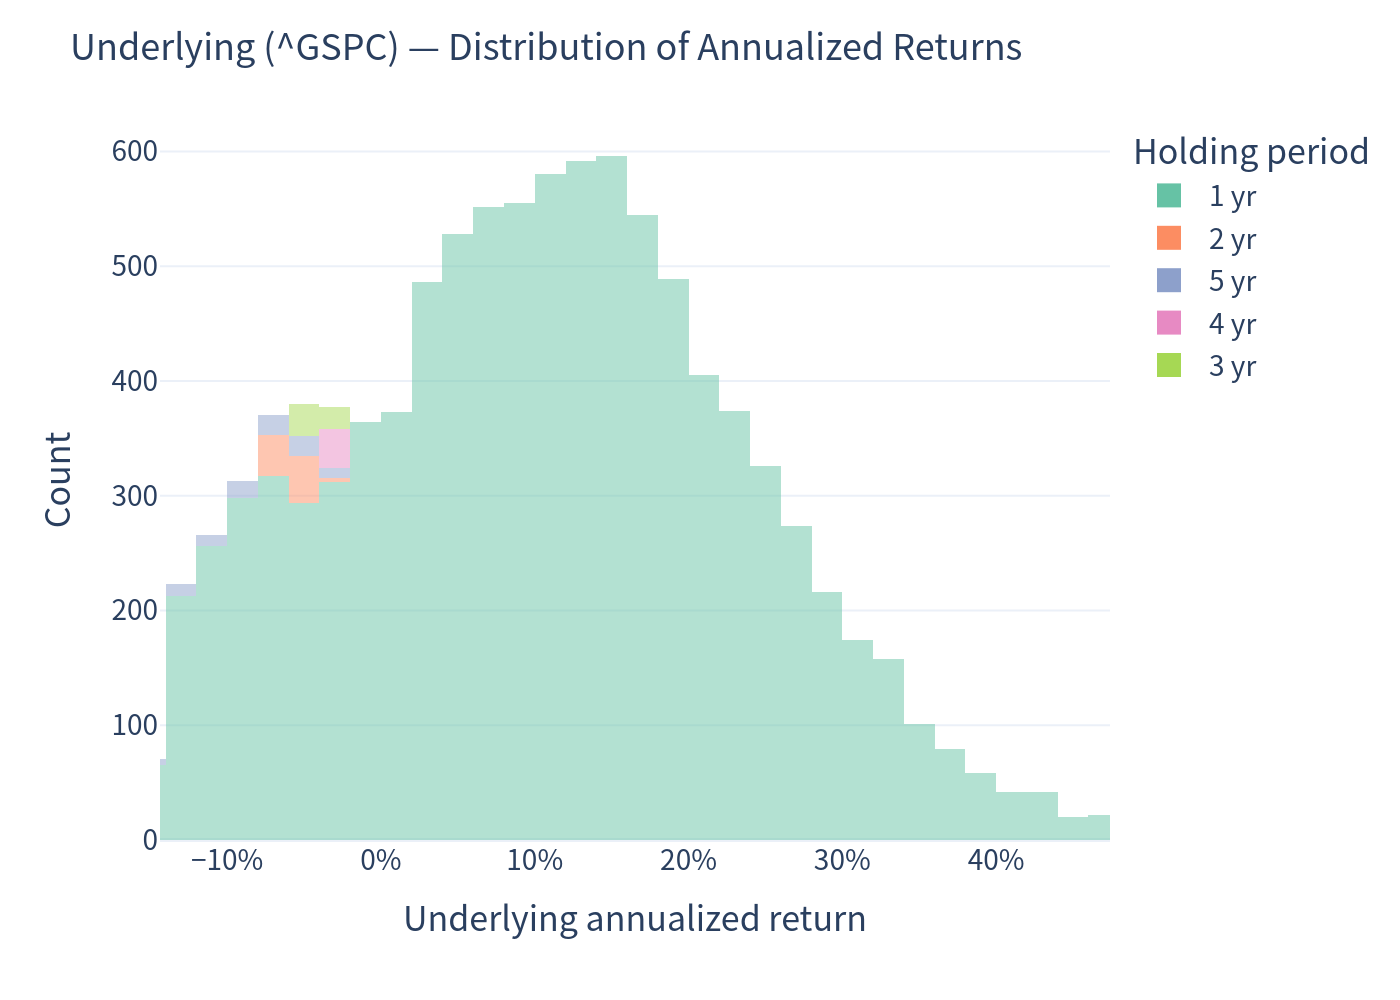
Distribution of annualized returns — Underlying
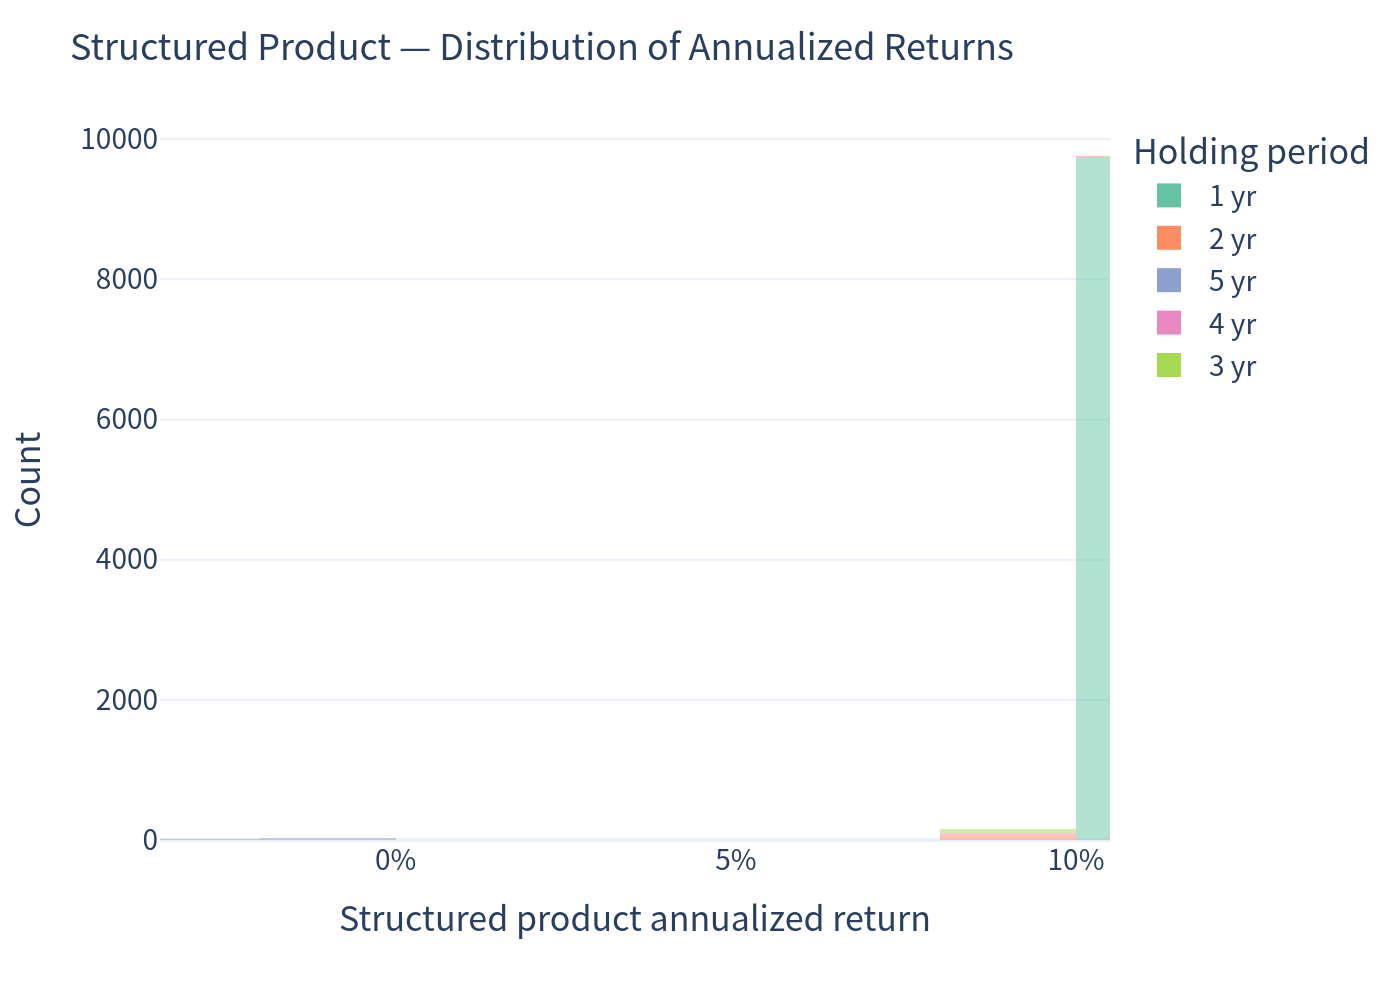
Distribution of annualized returns — Structured Product
The product's outcomes cluster tightly at ~+10.5% (the auto-call level); the small left tail captures the rare deep-drawdown paths.
Scenario probabilities — Structured Product
Risk / Return comparison
Annualized return — Box plot
Holding-period distribution
Investment Commentary
Favourable characteristics
- High modelled probability of a positive outcome. With a low 85% call hurdle, the note converts a modest equity rally into a locked-in ~10.5% annualized result, and outperforms cash (3.72%) in ~99% of simulated paths.
- Downside buffer. The first 15% of any index decline is absorbed, providing a defined cushion versus a direct index investment; the floor limits the very worst outcome to 15% of principal (before issuer credit risk).
- Attractive risk/return in the central case. The modelled return is close to the equity benchmark's while displaying a small fraction of its volatility — a profile suited to investors who want equity-like returns with a much smoother ride over a short holding period.
- Guaranteed by Morgan Stanley, providing the credit backing of a large global institution.
Considerations
- Upside is capped. Investors forgo all index appreciation above the fixed jump/auto-call amount, so a strong bull market is not captured.
- The benign profile depends on a benign, upward-drifting market. The low loss probability and positive VaR are a direct product of the drift assumption; in a prolonged bear market below 85% of the start, the buffer is exhausted and losses beyond 15% are fully felt (worst simulated path ≈ -66.8%).
- Return is front-loaded and short-dated. Because the note usually redeems after one year, the effective annualized return closely equals the ~10.5% one-year figure; reinvestment risk applies over the remaining term.
- Credit and liquidity. Repayment depends on the issuer/guarantor, and the notes are not listed — they may be difficult to sell before redemption.
This analysis is a quantitative simulation for informational purposes only and does not constitute financial advice, a recommendation, or a suitability assessment.