
8.00% p.a. Multi Barrier Reverse Convertible (Callable) on Avolta, Richemont & Flughafen Zürich
Headline Simulation Results
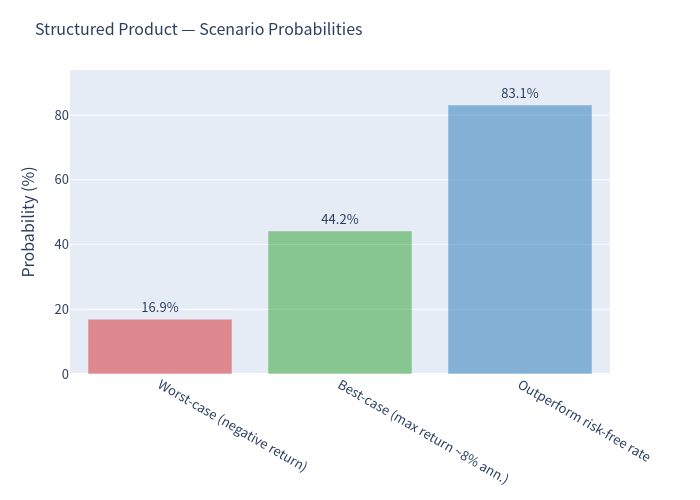
The product behaves like a high-coupon bond with a conditional capital-protection feature. In ~83% of simulated paths the total return is non-negative (the investor is repaid principal plus coupons and earns a smooth ~7.8%–8.0% annualized return); essentially all of the risk is concentrated in the ~17% of paths where a deep drawdown triggers the barrier and the redemption is delivered in the worst-performing stock.
Basic Product Information
| Feature | Detail |
|---|---|
| Type | Multi Barrier Reverse Convertible (Yield-Enhancement, SSPA 1230), Callable |
| Coupon | 8.00% p.a., paid quarterly (CHF 20.00 per CHF 1,000; 7 payments) |
| Underlyings | Avolta AG, Cie Financière Richemont SA, Flughafen Zürich AG (worst-of) |
| Strike / Barrier | Strike 100%; Barrier 55%, continuously observed (worst-of) |
| Early redemption | Issuer callable on 5 quarterly observation dates |
| Upside | Capped at 100% (par) — no participation in gains |
| Issuer / Guarantor | Leonteq Securities AG / Aargauische Kantonalbank (AA+) |
How it works (in plain terms)
- You receive 8% p.a. in cash coupons no matter what the stocks do — the coupons are paid unconditionally.
- At maturity you get your full 100% back unless one of the three stocks has, at any moment, traded at or below 55% of its starting level (a "barrier event").
- If no stock ever breaches 55% → you get par (100%) plus all coupons.
- If a stock does breach 55% and the worst-performing stock finishes below its start → you instead receive that worst stock (or its cash value at its final price), so you share the downside of the weakest name.
- If a stock breaches 55% but the worst stock still finishes at or above its start → you still get par.
- The issuer may call the note early on any quarterly observation date; if called you receive par plus the coupon, and the product ends.
Key Risk & Return Statistics
Expected values from 10,000 Monte Carlo scenarios (21-month horizon). "Benchmark" is an equal-weight basket of the three underlyings.
| Metric | Structured Product | Benchmark (same holding period) | Benchmark (21-month buy & hold) |
|---|---|---|---|
| Expected annualized return | 2.93% | 14.39% | 4.64% |
| Expected annualized volatility | 11.45% | 26.44% | 17.33% |
| Probability of loss | 16.91% | 32.66% | 40.97% |
| 99% VaR (1 year) | −33.60% | −32.11% | −32.16% |
| Expected total return | 1.64% | 6.68% | 10.20% |
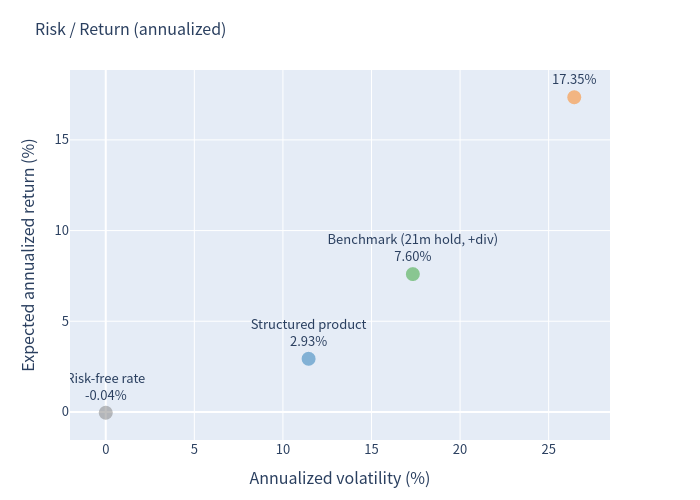
| Expected ann. return incl. dividends | — | 17.35% | 7.60% |
Reading the benchmark columns. Because the note is called early when the market is strong, the underlying basket's return measured over the note's same realized holding period is upward-biased (short, market-up windows annualized linearly), which is why its annualized figure (14.39%) exceeds the 21-month buy-and-hold figure (4.64%). The 21-month buy-and-hold column is the cleaner "hold the basket instead" comparison: over the note's full life the basket is expected to earn ~4.6% annualized (~7.6% with dividends), with ~41% chance of a loss and ~17% volatility.
Charts
Returns by simulation — product vs underlying
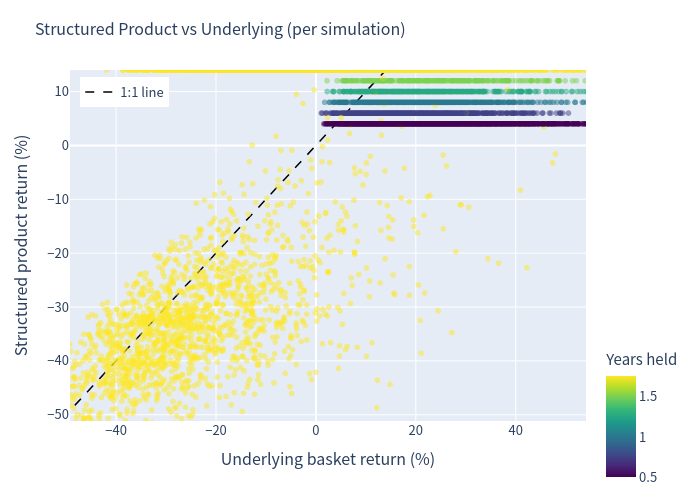
Each point is one scenario. The product's returns are pinned near a horizontal band (the coupon) and are capped well below the 1:1 line, while still sharing part of the underlying's downside. The 1:1 reference line highlights the give-up in upside.
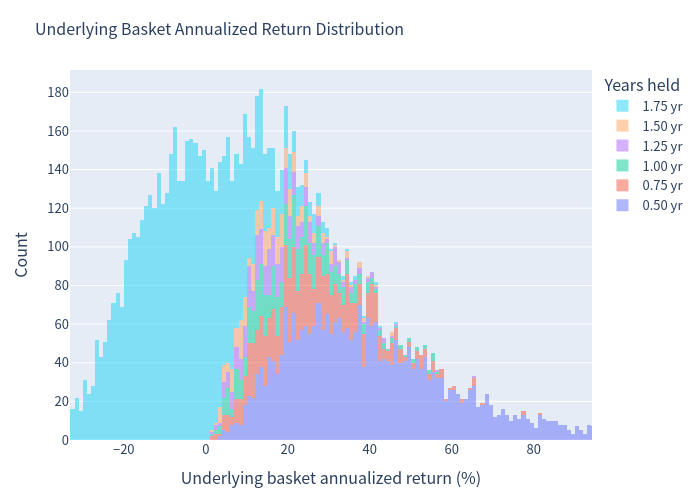
Underlying basket annualized-return distribution
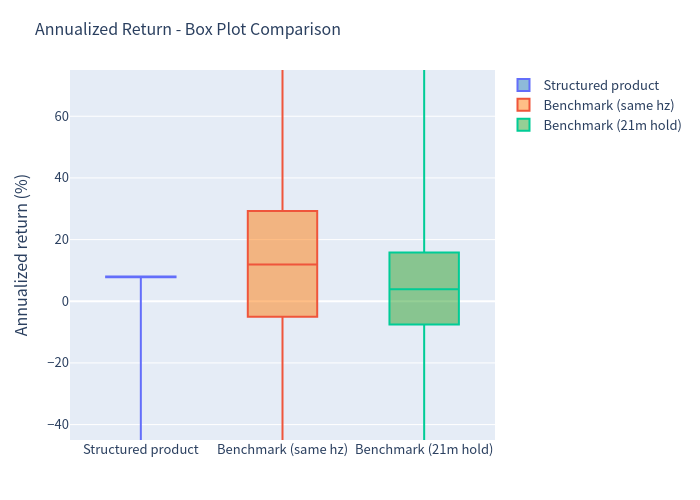
A wide, two-sided distribution driven by the underlying equities' volatility (annualized vol of the individual names ranges ~23%–44%).
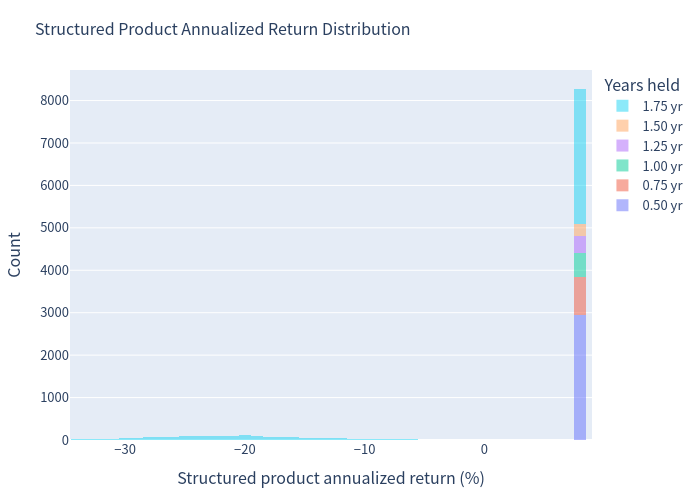
Structured product annualized-return distribution
A tight, heavily right-skewed distribution: the bulk of scenarios cluster near +8%, with a thin but meaningful left tail to about −34% when the barrier is breached.
Scenario probabilities
Risk / return profile (annualized)
The product sits far to the left of the benchmark points — substantially lower volatility — but also at a lower expected return, sitting above the (near-zero) cash rate.
Annualized-return comparison
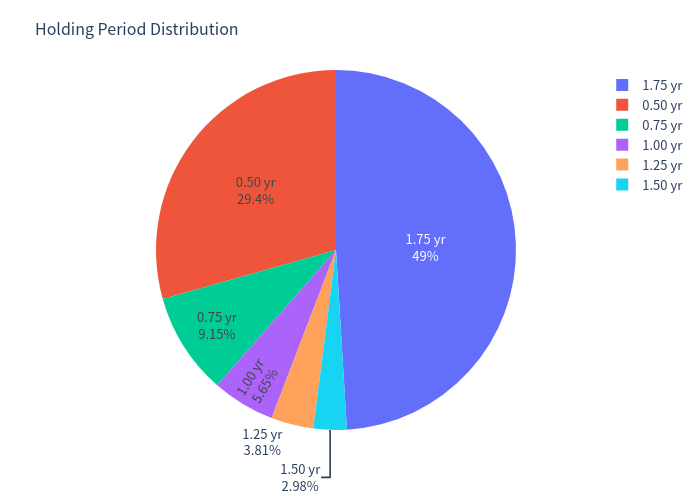
Holding-period distribution
Coupon distribution
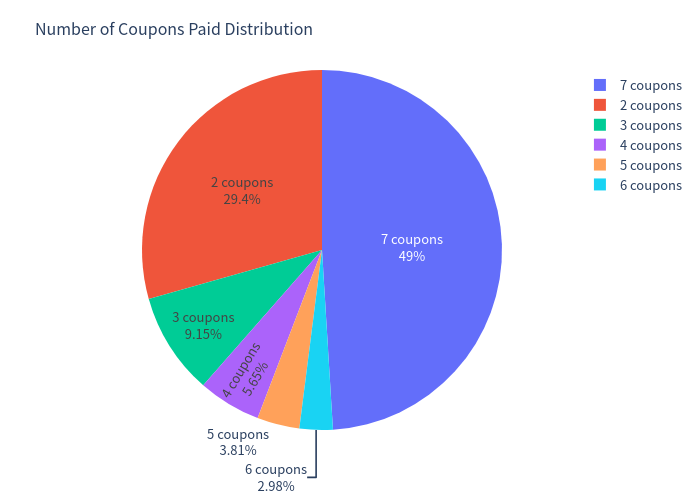
About 29% of paths are called at the first opportunity (0.5 yr) and 49% run full term (1.75 yr); the remainder are spread across the intermediate call dates.
Investment Commentary
Potential merits
- High, unconditional coupon of 8% p.a. in a CHF environment where the risk-free rate is ~0%. Coupons are paid even if the stocks fall, as long as the note is alive.
- Meaningful downside buffer: a position only suffers a capital loss if a stock first falls ≥45% (55% barrier) and the worst stock finishes below its start. This combination is uncommon, giving a loss probability of ~17% versus ~41% for holding the basket outright.
- Lower volatility than the underlying basket (~11% vs ~17% annualized) and a ~83% probability of beating cash.
- Contingent protection — many "worst-of" trauma scenarios (barrier touched but worst name recovers to ≥ its start) still redeem at par.
Points to weigh
- Upside is fully capped at par — there is no participation in the equity upside; strong rallies only get you called and returned to par.
- Worst-of exposure to three names: Avolta is the most volatile of the three (~44% annualized), so it dominates the barrier-risk profile.
- The expected return is below the basket's expected return — over the note's life the equal-weight basket is expected to out-earn the coupon, so the note is effectively a "sell volatility / cap upside" position.
- Continuous barrier: the 55% level is monitored at any time, which is materially harder to avoid than a fixing-date-only barrier.
- Early call works against the holder in strong markets — early redemption returns par plus fewer coupons, truncating the coupon stream and the total return.
- Credit risk sits with the issuer (Leonteq) and guarantor (Aargauische Kantonalbank).
Figures are expressed in percentage terms and rounded to two decimals. Returns are simulated on the underlying price index (dividends added separately for comparison, without compounding). This document is an analysis of simulated outcomes and is not investment advice or a suitability assessment.