
Worst-of INDU, SX5E and RTY Callable Contingent Income Securities due February 2, 2029
1. Headline Simulation Results
Based on a 10,000-path Monte Carlo simulation of the three underliers (monthly steps, worst-of linkage, quarterly observation):
| Metric | Structured Product | Underlying (equal-weight basket, total return) |
|---|---|---|
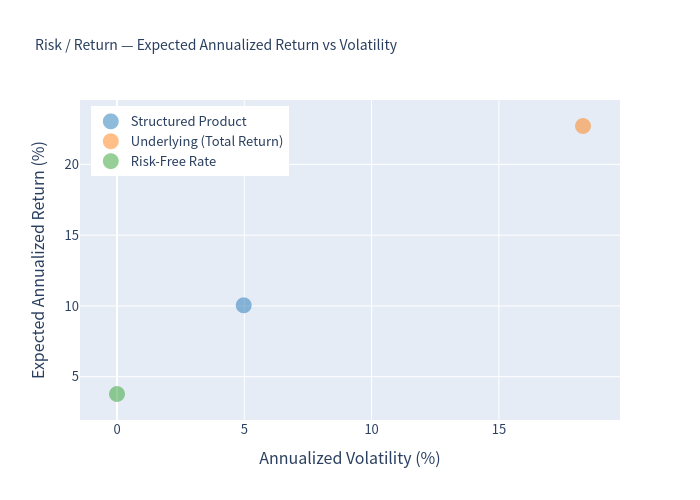
| Expected annualized return | 10.04% | 22.71% |
| Expected annualized volatility | 4.98% | 18.30% |
| Probability of negative return | 3.70% | 5.74% |
| 99% confidence VaR (1 year) | -16.64% | -10.55% |
| Probability of beating the risk-free rate (3.78%) | 94.37% | — |
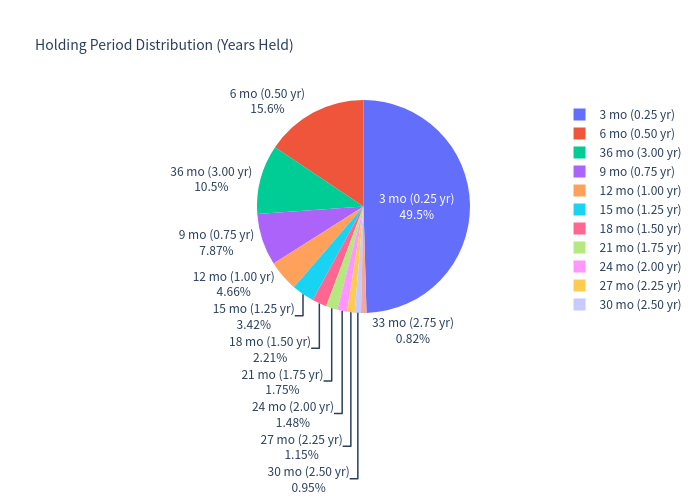
- Expected holding period: ~10.0 months (≈0.83 years). The call feature triggers early in the large majority of paths.
- Probability of being called before maturity: 89.47%.
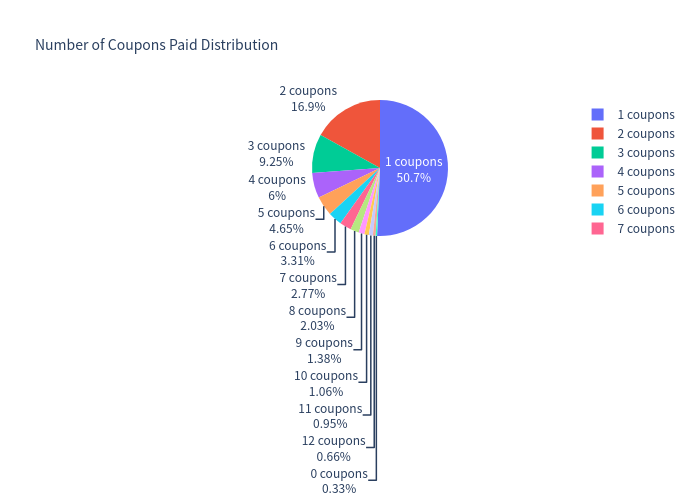
- Expected total (cumulative) return over the realized holding period: +5.79% (≈10.0 months), driven by ~2.6 quarterly coupons received on average.
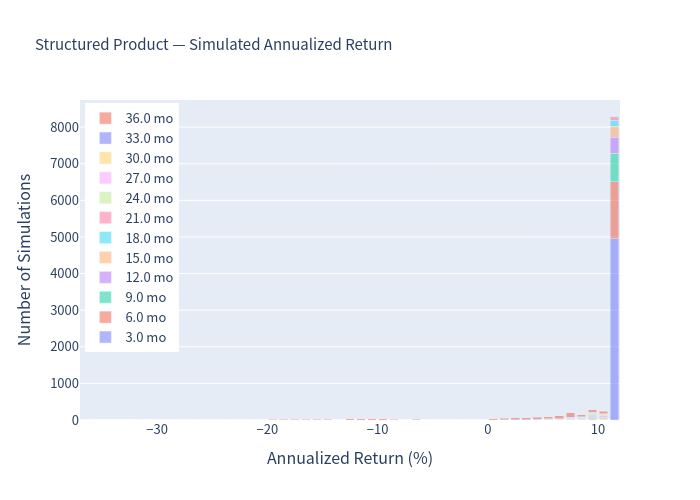
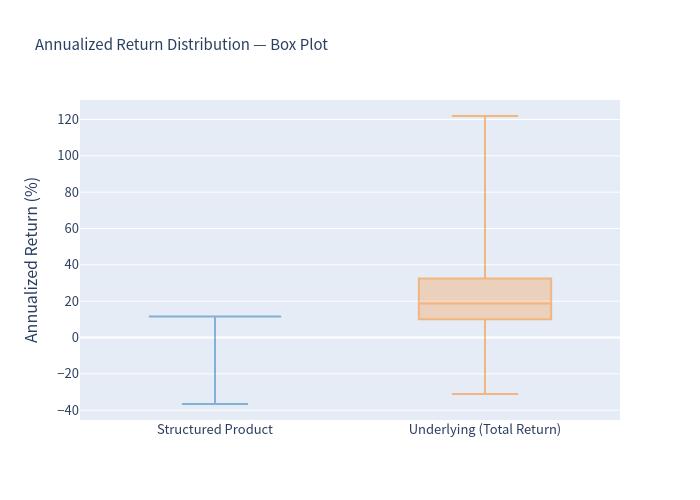
Because the note is callable and is redeemed as soon as the worst-of index is at/above its initial level, the product usually terminates within the first year. Annualizing a short, favourable holding period magnifies the annualized figure, so the 10.04% annualized expectation should be read together with the ~10-month average life and the +5.79% average cumulative return. The distribution is strongly bimodal: many short, positive outcomes (call) plus a small tail of severe negative outcomes (worst-of breach of the 70% downside threshold). The underlying-basket figures (return, volatility, VaR) are measured over the same per-simulation holding period as the note and annualized the same way; because the note terminates early precisely when markets are up, this horizon-selection effect lifts the basket's annualized figures above a full 3-year buy-and-hold would show. The product-vs-underlying comparison is therefore apples-to-apples (identical horizon per path).
2. How It Works (Plain Language)
- Quarterly coupon (contingent). Every quarter you receive 2.875 index points (11.50% p.a.) only if all three indices are at or above 80% of their starting level on that quarter's observation date. If any one index is below its 80% coupon barrier, you receive no coupon for that quarter.
- The note is callable each quarter (issuer's right). In this analysis, the note is redeemed early at par ($1,000) plus the coupon at the first quarter in which the worst-of index is at/above its initial level (~100%). This is a documented modelling assumption — the term sheet specifies only a “quarterly” call based on a risk-neutral valuation model, without a stated call level.
- Capped upside. You never participate in index appreciation. Your best principal outcome is $1,000 par.
- Downside at maturity. If the note is not called and, at the final observation date (Jan 30, 2029), the worst-performing index is at or above 70% of its initial level, you get par ($1,000) back. If the worst-performing index is below 70%, you lose 1:1 — e.g. −40% worst-of ⇒ $600; −60% ⇒ $400.
- All-or-nothing reference. Every test is based on the worst of the three indices, so a single weak index drags the whole payoff down.
3. Key Statistics on the Underlyings
| Underlier | 20-yr annualized volatility | Dividend yield | Benchmark weight |
|---|---|---|---|
| Dow Jones Industrial Average (INDU) | 18.44% | 1.42% | 1/3 |
| EURO STOXX 50® (SX5E) | 21.72% | 2.70% | 1/3 |
| Russell 2000® (RTY) | 24.96% | 0.98% | 1/3 |
| Equal-weight basket (benchmark) | ~18–19% | 1.70% | 100% |
Because the payoff is linked to the worst of three equity indices, the effective risk is that of the weakest performer at any decision point — materially higher than a single-index note.
4. Charts
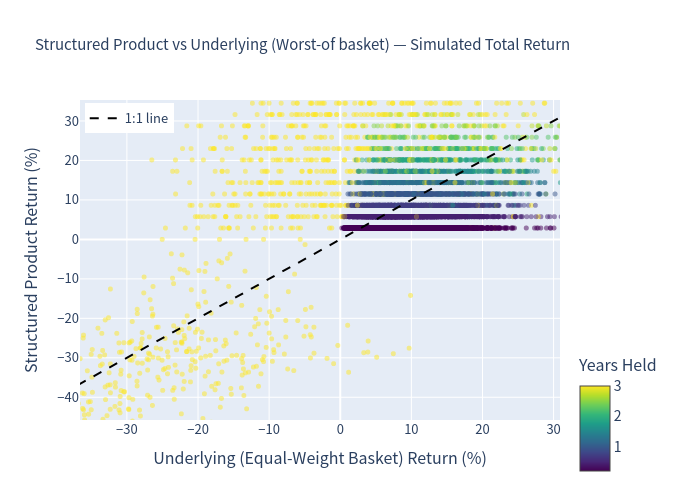
4.1 Simulation outcomes — Structured Product vs Underlying
Each point is one simulation; colour = years held; dashed line is 1:1.
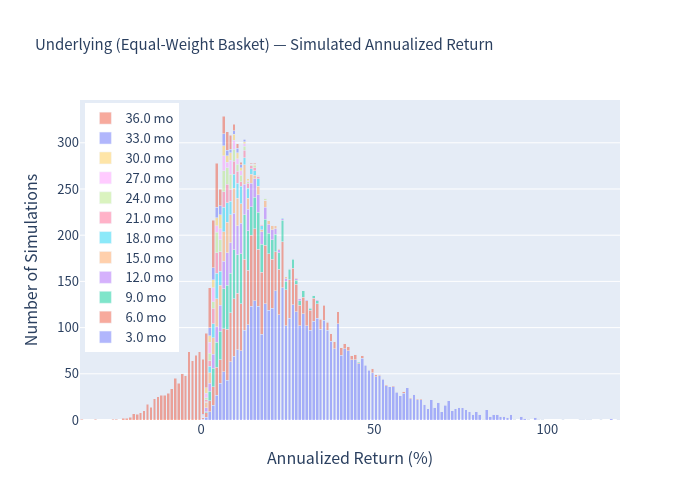
4.2 Underlying — simulated annualized return (stacked by months held)
4.3 Structured Product — simulated annualized return (stacked by months held)
4.4 Scenario probabilities
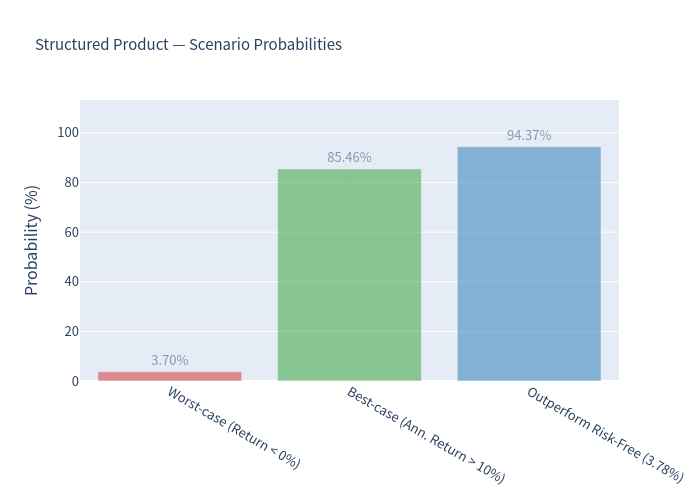
- Worst-case (annualized return < 0%): 3.70%
- Best-case (annualized return > 10%): 85.46%
- Outperform risk-free rate (>3.78%): 94.37%
4.5 Risk / Return map
4.6 Annualized return distribution — box plot
4.7 Holding-period and coupon-count distributions
5. Investment Commentary
Pros
- High headline coupon. An 11.50% p.a. contingent coupon is attractive versus the ~3.78% risk-free rate, and the note still has a 94.37% modelled chance of beating the risk-free rate, with only a 3.70% probability of a negative return.
- Conditional barrier, not a hard loss. Downside protection holds unless the worst-of index falls more than 30% (below 70% of initial) at maturity; between −30% and 0%, principal is still returned in full.
- Short expected life. With an ~89% call probability and a ~10-month average life, capital is typically returned quickly, and coupon income is collected along the way.
- Low realized return volatility of the product (4.98%) relative to the underlying basket (18.30%) in the modelled distribution.
Cons / Risks
- Capped upside with worst-of downside. Investors forgo all index appreciation while retaining 1:1 downside below the 70% threshold; on the identical horizon-adjusted basis the product's 99% VaR (-16.64%) is more negative than the underlying basket's (-10.55%), i.e. a fatter left tail despite the capped upside.
- Worst-of drag. A single weak index (e.g. small caps) can suppress every coupon and trigger the capital loss even if the other two indices are flat or up.
- Reinvestment / early-call risk. Because the note is very likely to be called within the first year, the 11.50% coupon is unlikely to be earned over the full 3-year term; expected total return is only ~5.79%.
- Coupon can be missed. If any index is below its 80% coupon barrier on an observation date, no coupon is paid for that quarter.
The structure offers an attractive high coupon with a short expected life and a low probability of loss in a benign scenario, but it caps upside while keeping a meaningful left-tail exposure driven by the weakest of three equity indices.
All figures are model-based estimates (10,000 Monte Carlo paths, monthly steps, equity risk premium of 6% over a 3.78% risk-free rate). They are not guarantees of future performance. This commentary provides analysis only and is not investment advice.