
info@tokenengine.ai
SPXFP Market-Linked Notes due February 28, 2030 — Simulation Analysis
Headline Simulation Results
| Metric | Result |
|---|---|
| Expected annualized return | 6.62% |
| Probability of a negative return | 0.00% (principal protected at maturity) |
| 99% confidence VaR (1 year) | 0.00% |
| Expected total return over the 4-year term | 30.21% |
| Expected holding period | 4.0 years (fixed) |
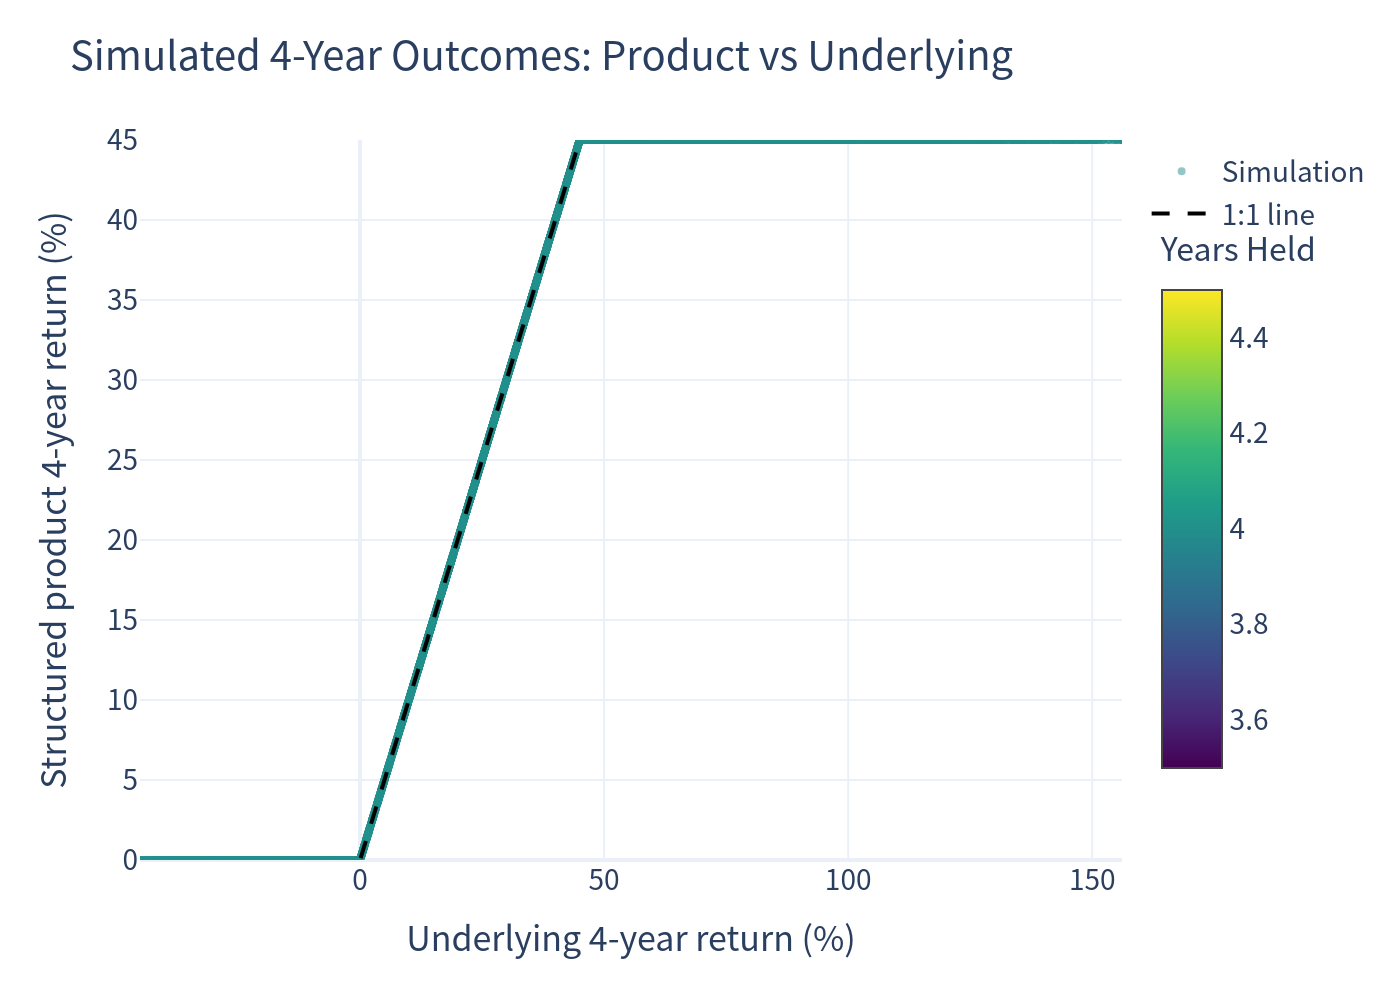
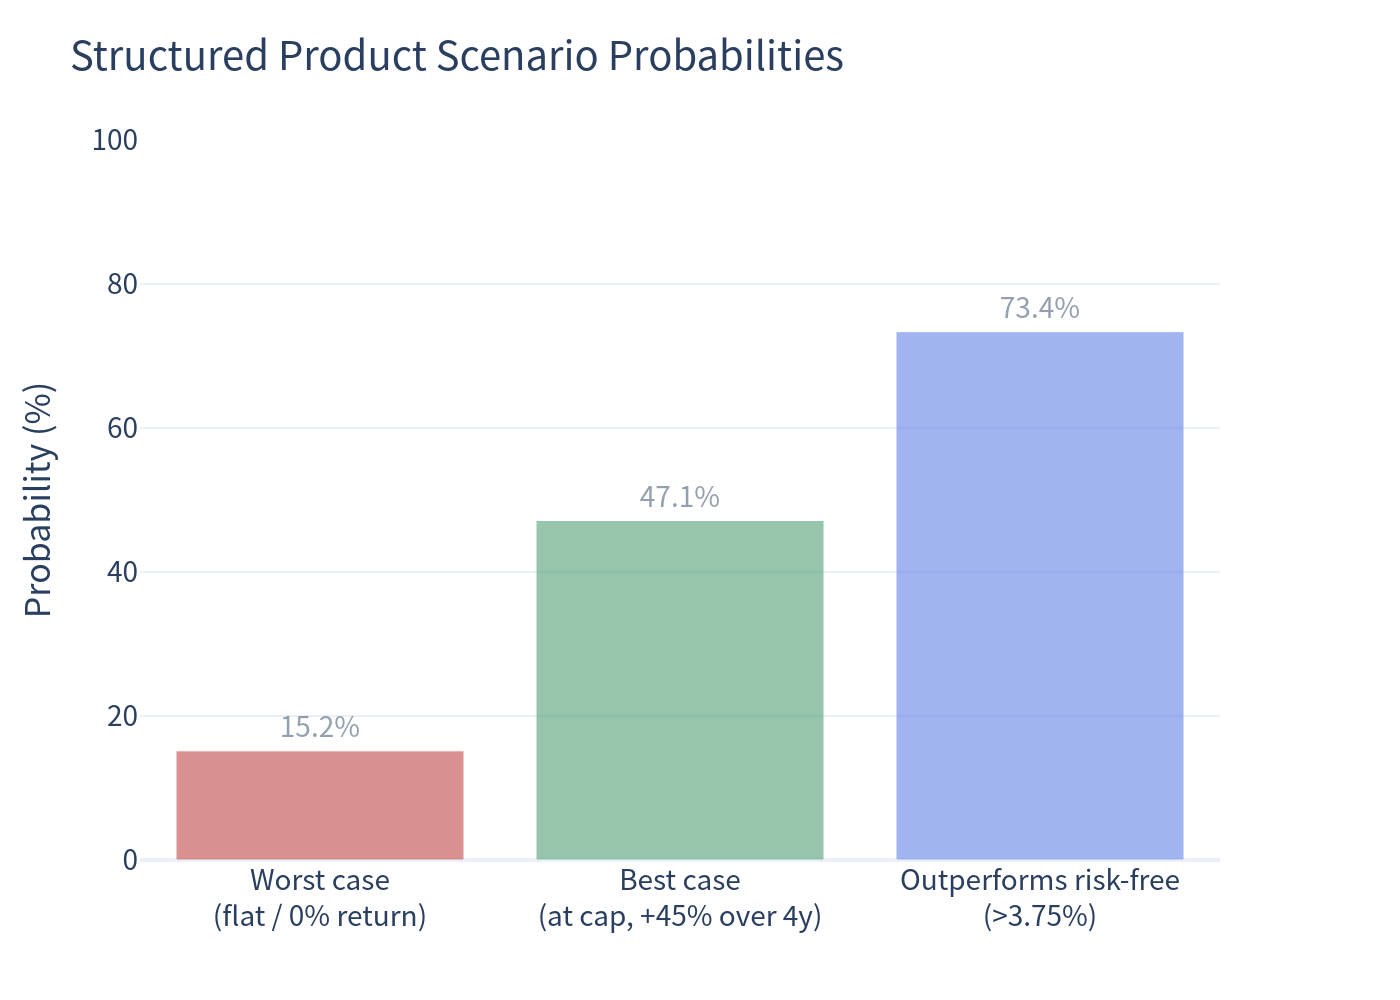
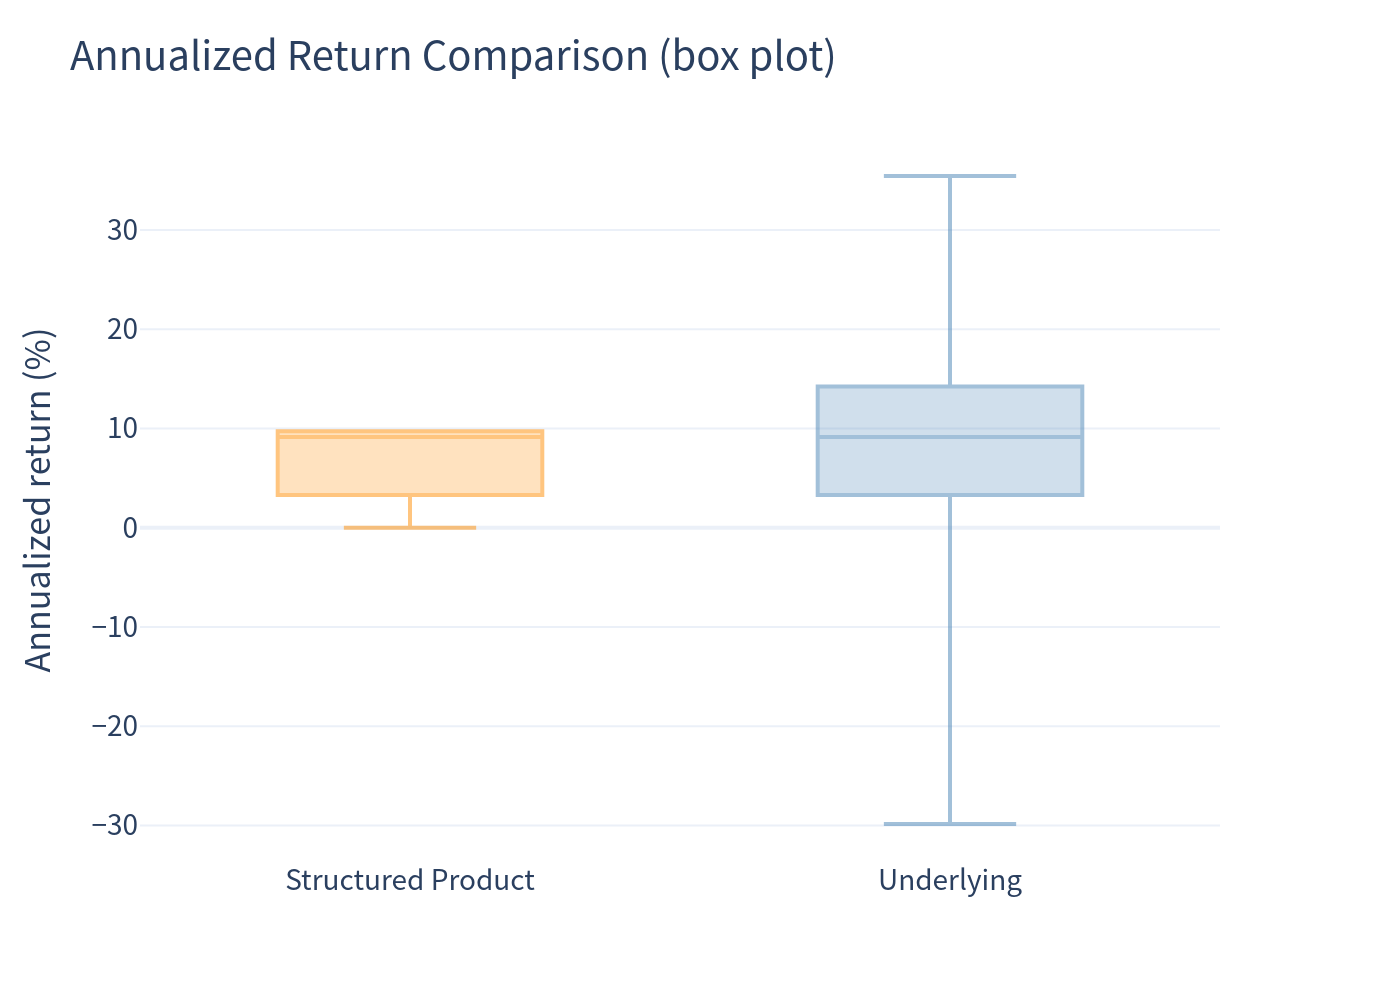
The note is fully principal protected at maturity, so no simulated path produced a loss: the worst simulated outcome is a flat 0% return (15.16% of paths), and the best is the +45% cap (47.15% of paths). The trade-off for that protection is a capped upside.
What the Note Is (in Plain Language)
You invest $1,000 per note for about four years. At maturity:
- If the index falls — you get your $1,000 back (principal protected, subject to Morgan Stanley's credit risk). No interest is paid along the way.
- If the index rises — you receive 100% of the gain, up to a maximum of +45% (i.e., at most $1,450 per note, 145% of principal). Any gain beyond +45% is given up.
There is no coupon, no early redemption and no barrier — it is a straightforward capital-protected, capped-participation note. (The illustrative payoff uses a 145% cap, i.e. +45%; the term sheet states the final cap will be set between 145% and 150%. If the cap is set at the 150% end, the annualized ceiling would be modestly higher than the figures shown below.)
Key Statistics
| Metric | Structured Product | Underlying (SPXFP proxy) | Underlying Total Return (+ dividends) |
|---|---|---|---|
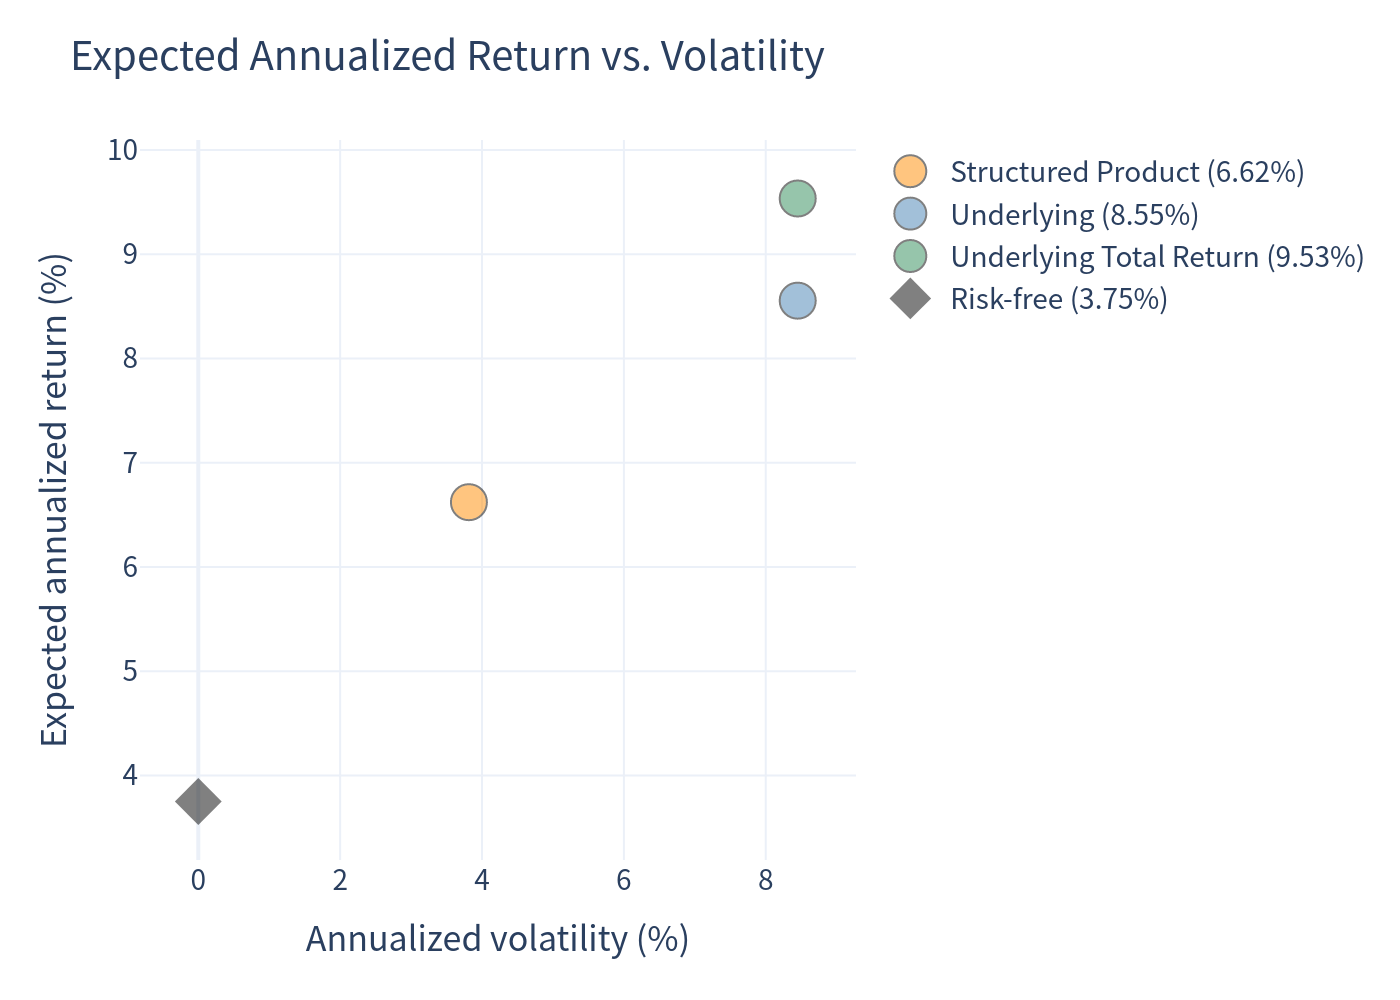
| Expected annualized return | 6.62% | 8.55% | 9.53% |
| Expected annualized volatility | 3.82% | 8.45% | 8.45% |
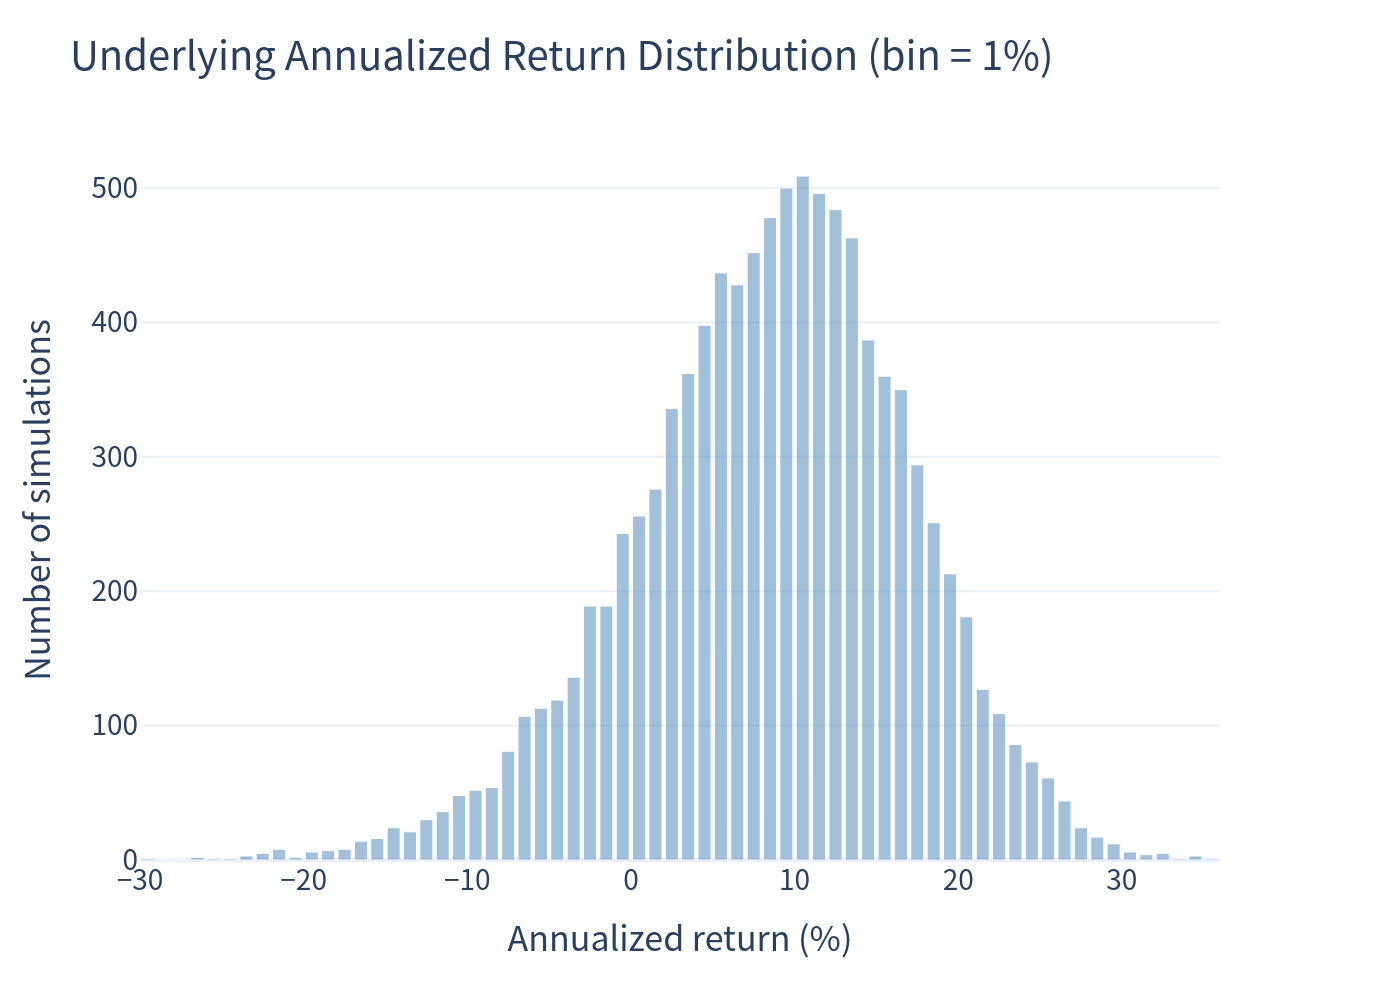
| Probability of loss | 0.00% | 15.16% | 12.79% |
| 99% confidence VaR (1 year) | 0.00% | -13.91% | -12.93% |
| Risk-free rate (1-yr average) | 3.75% | — | — |
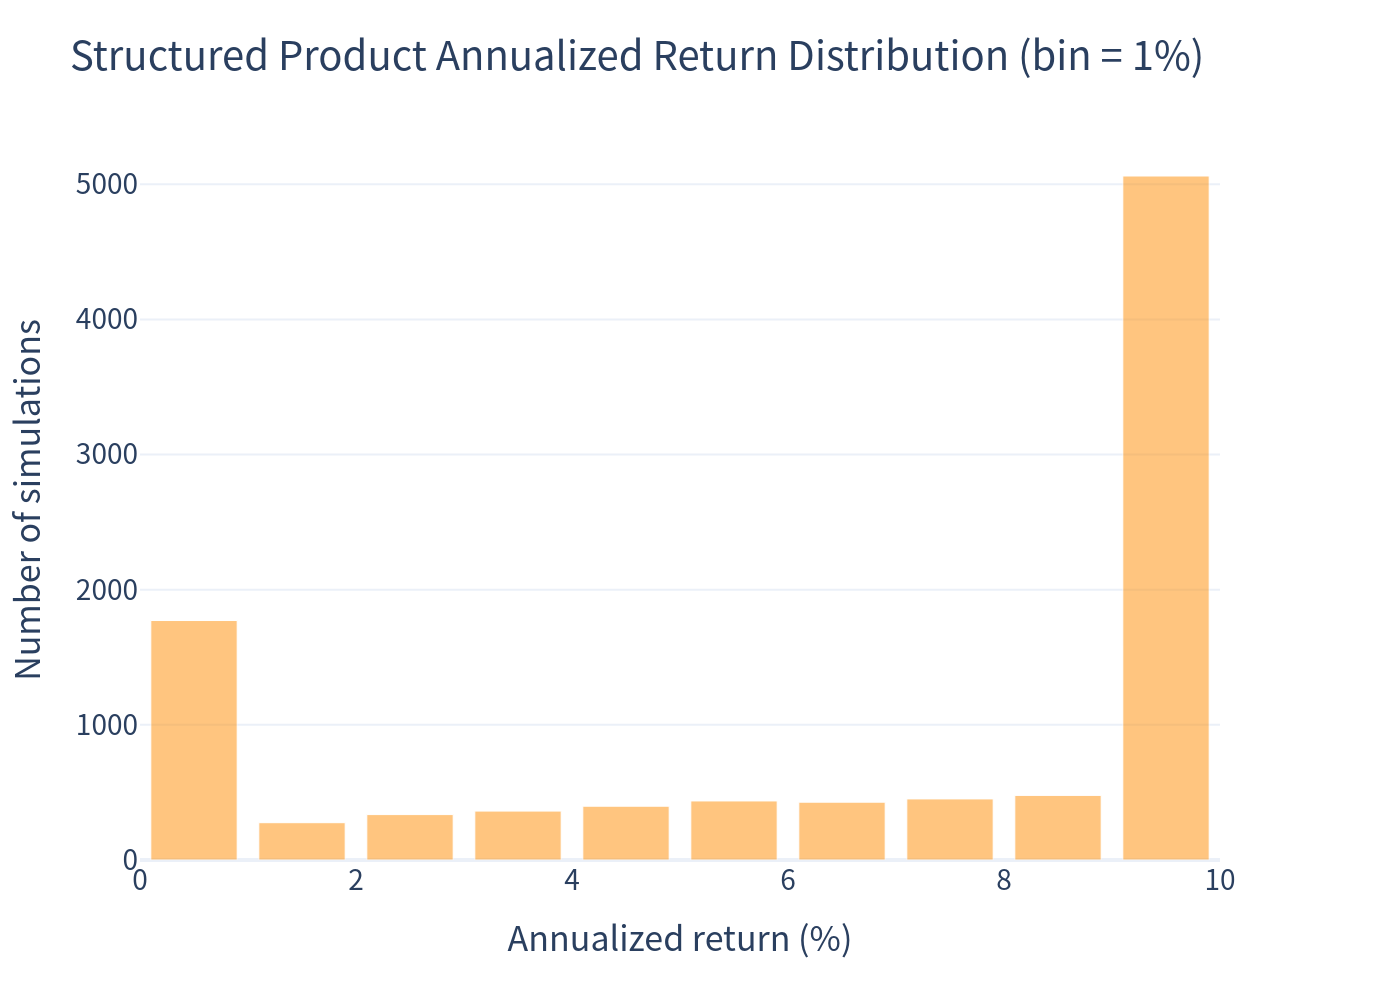
Additional simulation outcomes for the note: it outperforms the risk-free rate (3.75%) in 73.38% of paths, and its annualized return is capped at 9.73%.
Charts
Simulation outcomes — product vs underlying
Each point is one simulation (4-year holding). The dashed line is the 1:1 line; the note plots below it whenever the underlying rises more than ~45% (upside given up to the cap) but never below zero.
Underlying annualized return distribution
Structured product annualized return distribution
The note's distribution is bounded between 0% and +9.73% annualized, with a large spike at the cap.
Scenario probabilities
Risk vs return
Annualized return comparison (box plot)
Investment Commentary
Pros
- Full principal protection at maturity: the simulation shows a 0% probability of a negative return and a 0% 1-year 99% VaR (before considering issuer credit risk).
- Expected annualized return of 6.62% comfortably exceeds the ~3.75% risk-free rate, with an expected total return of 30.21% over the term.
- Roughly a three-in-four chance (73%) of beating cash, with equity-linked upside.
Cons
- Upside is capped at +45% over four years (a ~9.73% annualized ceiling); in about 47% of simulations the cap is reached and further index gains are forgone.
- In expected terms the note underperforms simply holding the index (8.55% price / 9.53% total return), which is the cost of the downside protection.
- Returns depend on Morgan Stanley's creditworthiness; the note is subject to issuer credit risk.
- The estimated value of $952.50 per $1,000 note is below the issue price, reflecting embedded structuring costs.