
Structured Product Evaluation — Callable Multi Barrier Reverse Convertible on Nestlé, Novartis & Roche
Monte-Carlo based assessment · 10,000 simulated paths · CHF-denominated, Leonteq (guaranteed by PostFinance)
Headline Simulation Results
| Metric (annualized) | Value |
|---|---|
| Expected annualized return | 5.58% |
| Probability of negative return | 13.09% |
| 99% confidence VaR (1 year) | −15.95% |
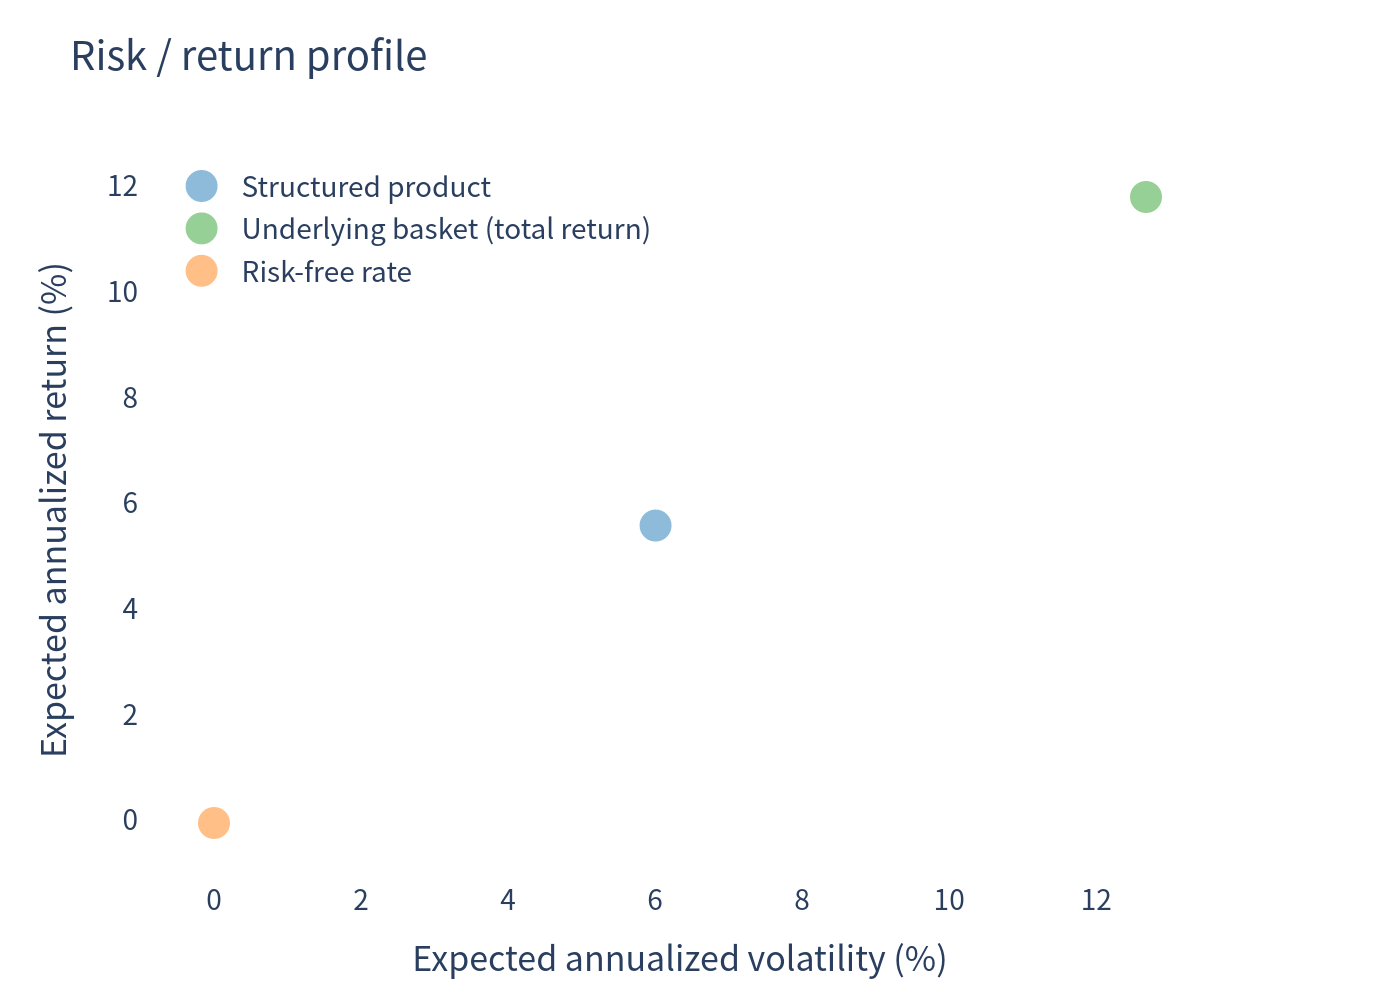
| Expected annualized volatility | 6.01% |
| Probability of outperforming the risk-free rate | 86.92% |
| Expected holding period | 18.43 months (1.54 years) |
| Expected total return over the realized holding period | 7.83% |
| Maximum achievable annualized return (cap) | 8.00% |
Because the product can be redeemed early, the total return is reported together with the annualized return and the average holding period. Each quarter the note pays 2% of notional (CHF 20.00 per CHF 1,000) for as long as it is outstanding, with capital returned at par; the average simulation received 6.14 of the 8 quarterly coupons (CHF 122.80 per CHF 1,000).
Basic Product Information (plain language)
- What it is: a 2-year, CHF-denominated yield-enhancement note issued by Leonteq (guaranteed by PostFinance) that pays a fixed 8.00% p.a. coupon, paid quarterly (CHF 20.00 per CHF 1,000).
- Underlyings: the worst-of three Swiss blue chips — Nestlé (NESN), Novartis (NOVN) and Roche participation certificates (ROP).
- How the coupon works: the coupon is paid unconditionally every quarter, whatever the underlyings do.
- How the capital works (the "barrier"): as long as none of the three underlyings ever trades at or below 69% of its starting level (observed continuously) during the life of the note, the investor gets 100% of capital back at maturity. If that 69% barrier is breached, the investor no longer receives par: if the worst-performing underlying is below its starting level at maturity, the investor is delivered that worst-performing share (worth less than par); if it is back at or above its starting level, the investor still receives par.
- The call feature: the issuer has the right (not the obligation) to redeem early at par + the then-current coupon on any of four quarterly observation dates (months 12, 15, 18 and 21). This caps the investor's upside if markets rally and shortens the life of the note.
- Upside is fully capped: the investor never receives more than par plus the fixed coupons; there is no participation in any rise of the underlyings.
Key Statistics
| Statistic (annualized) | Structured Product | Underlying basket (total return) |
|---|---|---|
| Expected return | 5.58% | 11.80% |
| Expected volatility | 6.01% | 12.68% |
| Probability of loss | 13.09% | 18.08% |
| 99% VaR (1 year) | −15.95% | −12.96% |
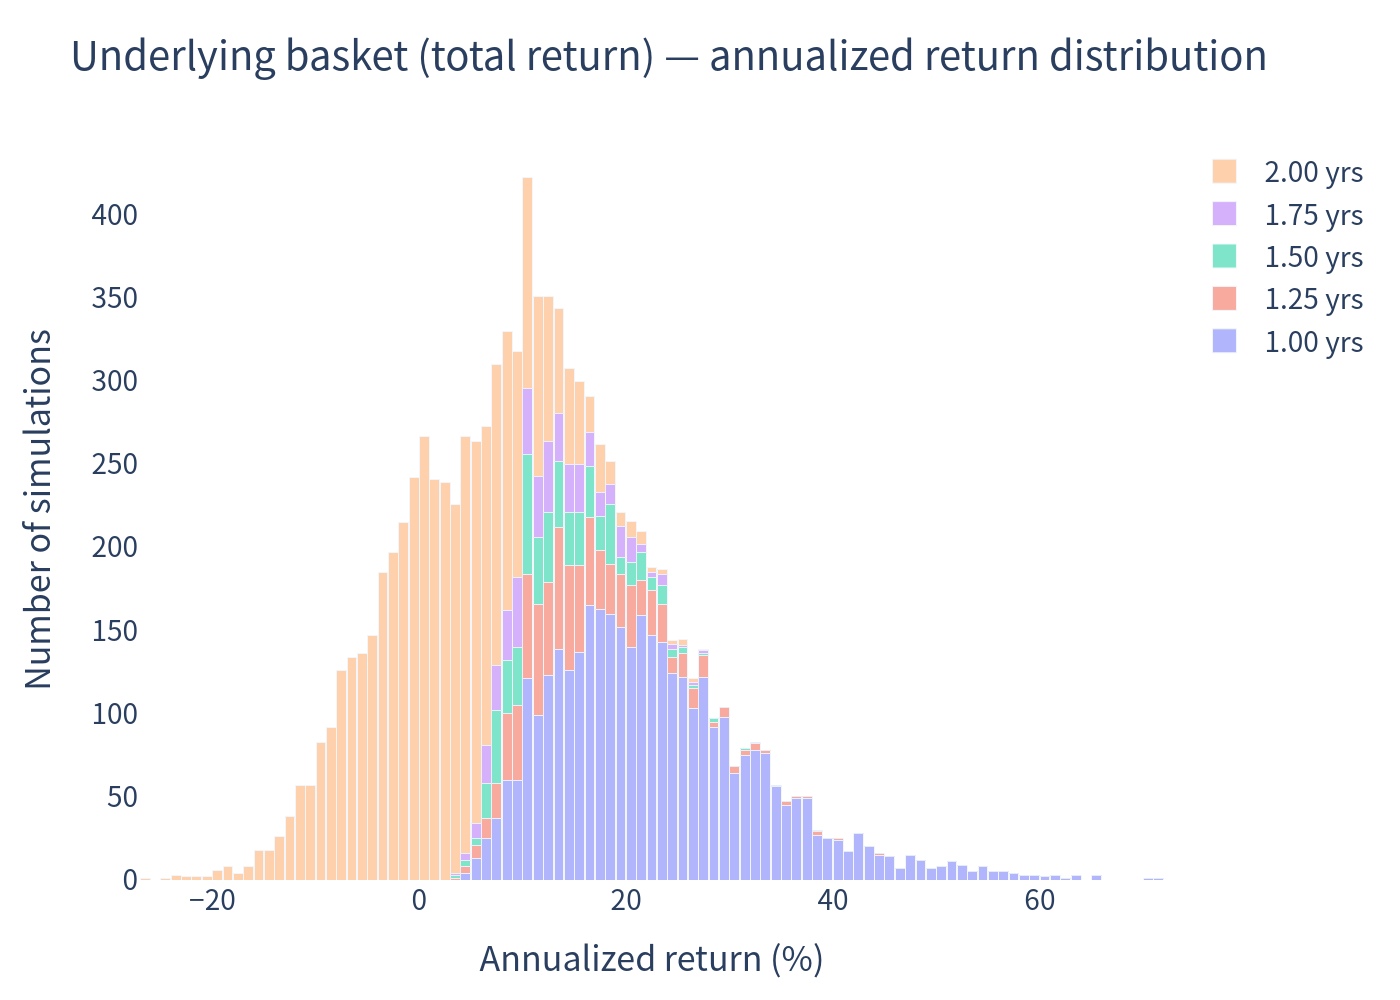
The benchmark is an equal-weighted basket of the three underlyings (Nestlé / Novartis / Roche) with its dividends added (average dividend yield ≈ 3.28%). Consistent with the "same-horizon" convention, the benchmark is measured over the same number of months that each simulated product position was held — since the note is redeemed early precisely when the underlyings are up, this flatters the benchmark's annualized figure somewhat.
Simulation Charts
Final return: product vs underlying basket
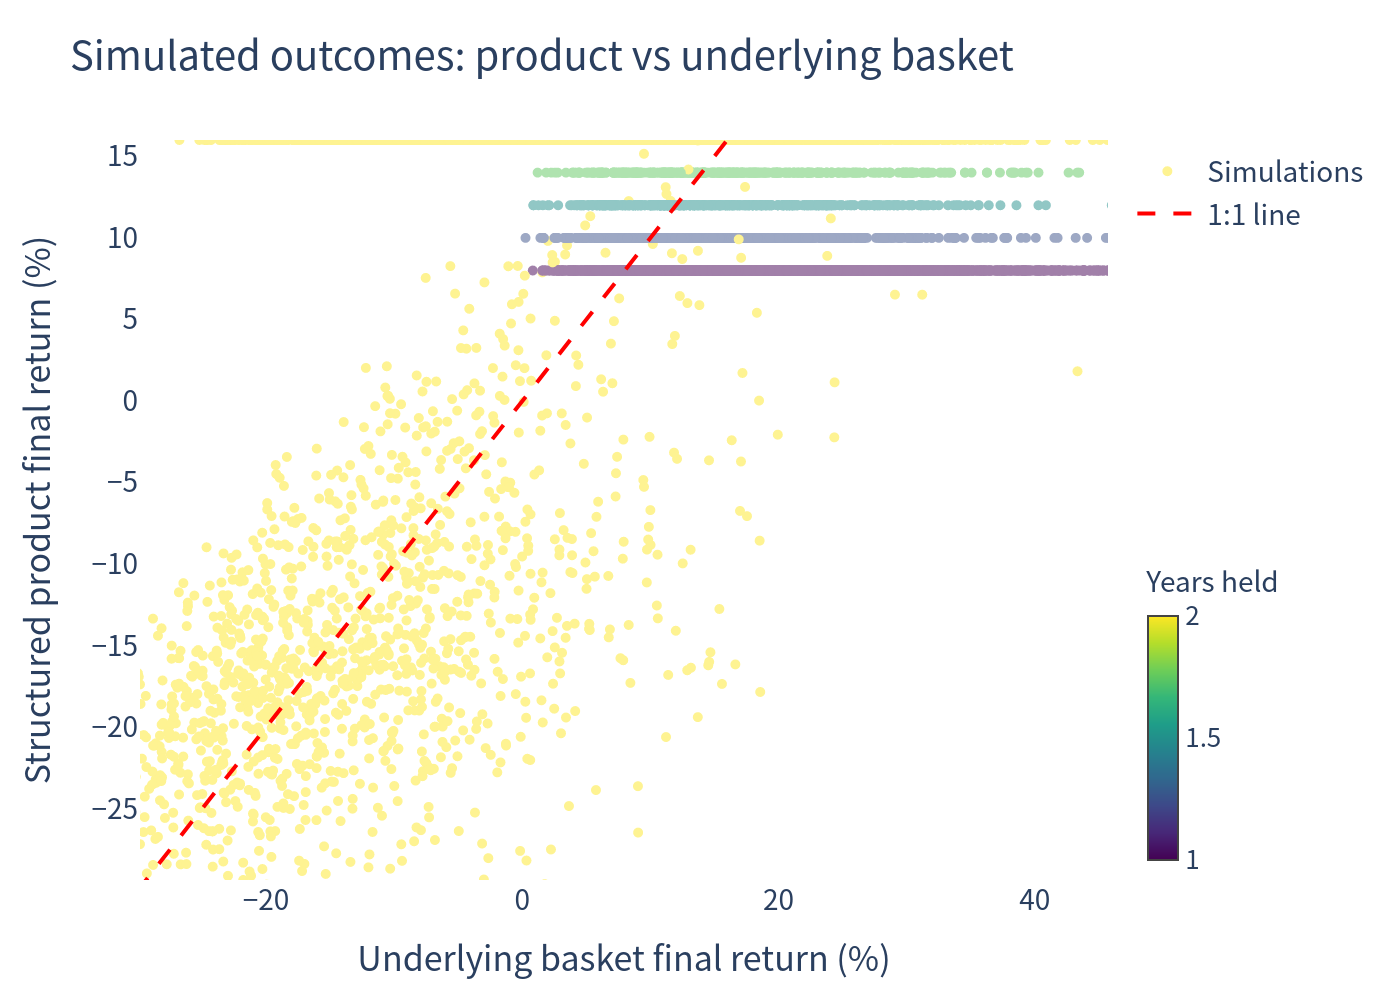
Each point is one of 10,000 simulations. The product's return is squeezed between the fixed-coupon floor and the fully capped ceiling, while the underlying basket has a much wider spread; points below the dashed 1:1 line in the left half show where the barrier bites and the product underperforms the basket.
Underlying basket — annualized return distribution
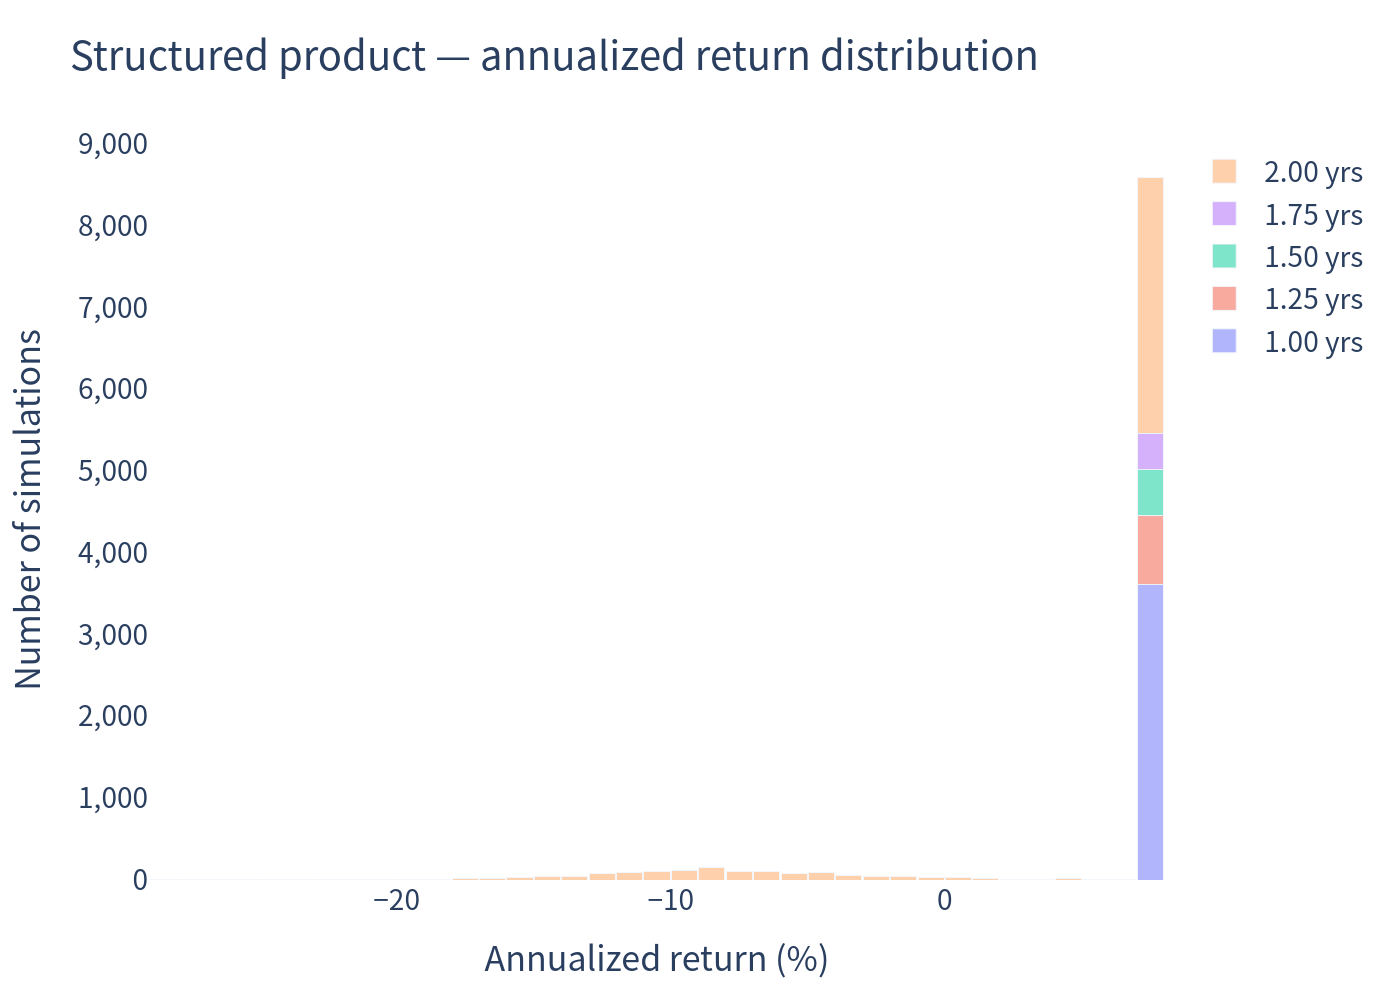
Structured product — annualized return distribution
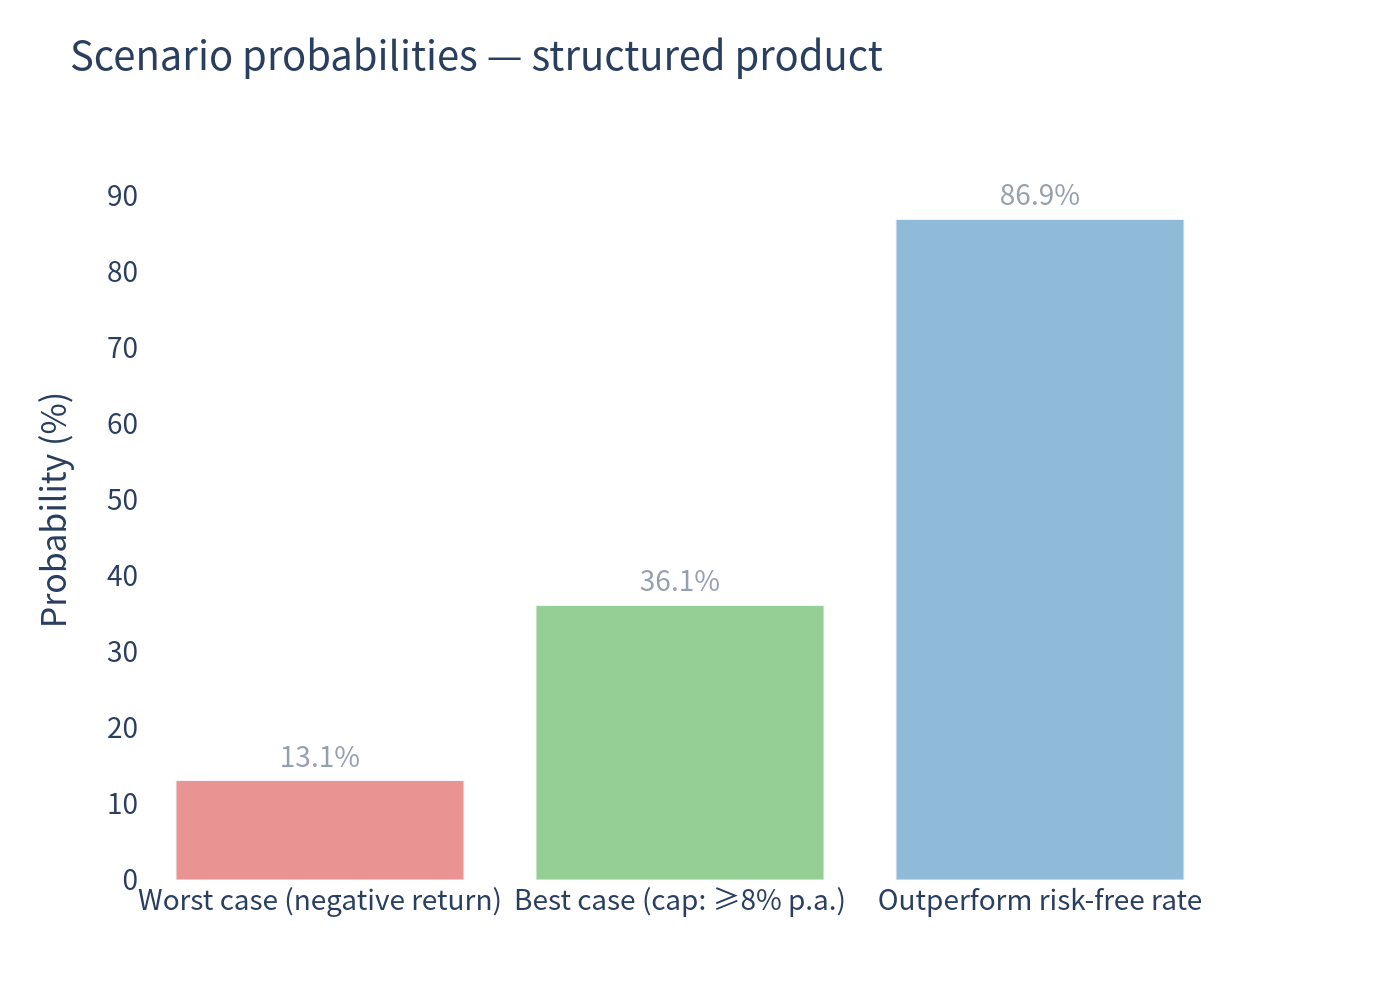
Scenario probabilities
The product loses money in 13.09% of simulations, beats the risk-free rate in 86.92%, and reaches its capped best case (a first-date call, i.e. exactly 8.00% p.a.) in 36.12% of paths. It can never exceed 8% p.a. because upward participation is fully capped.
Risk vs return
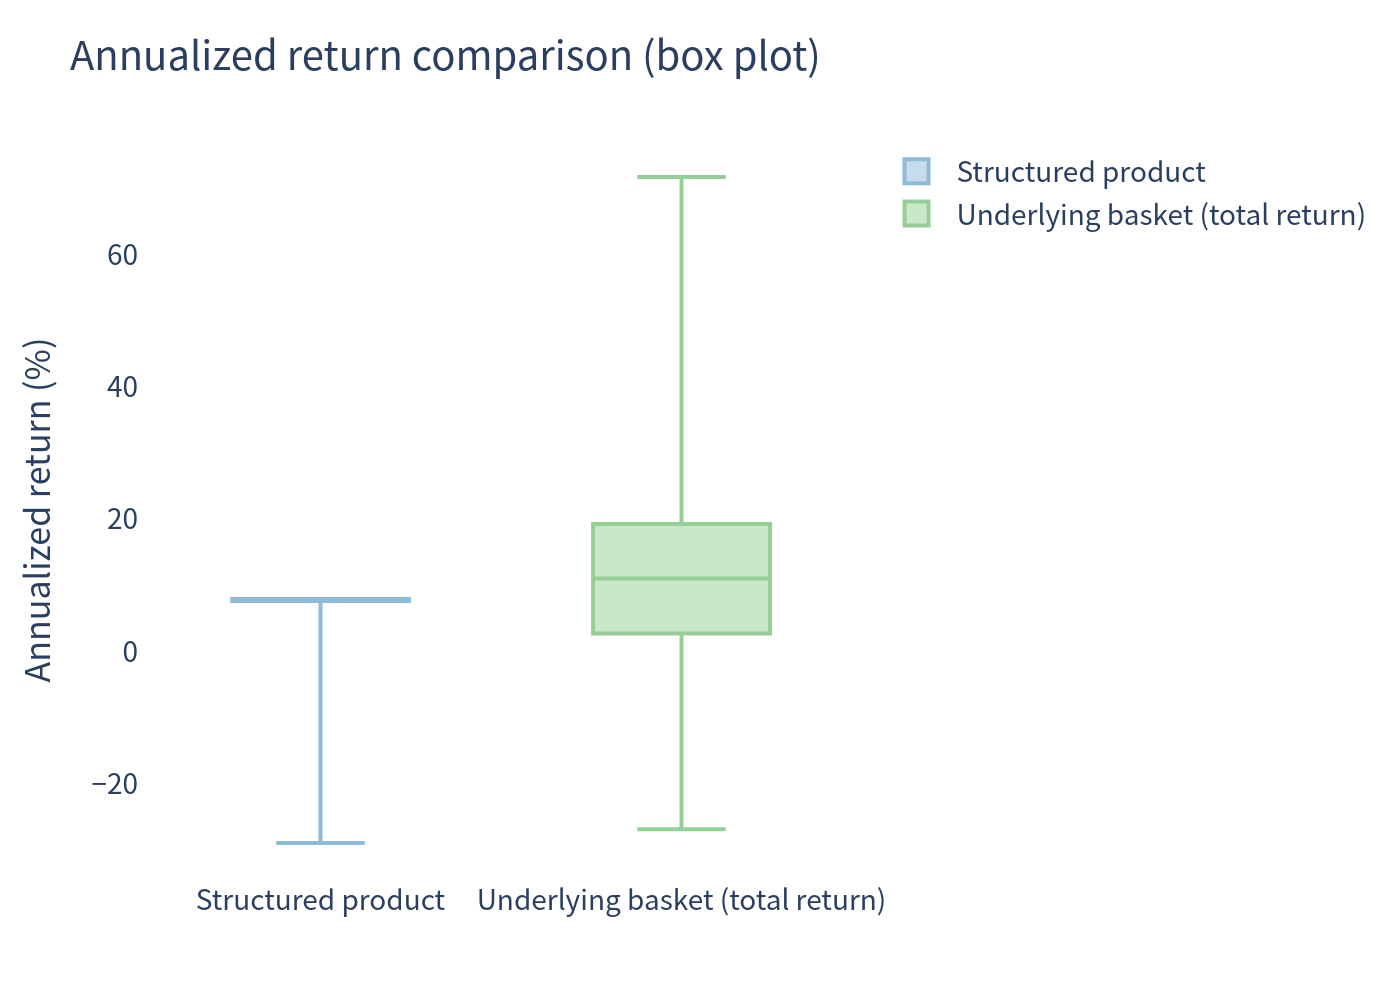
Annualized return comparison (box plot)
The structured product's distribution is tightly clustered just under 8% with a small downside tail; the underlying basket has a similar median but far wider dispersion in both directions.
Holding period and coupon profile
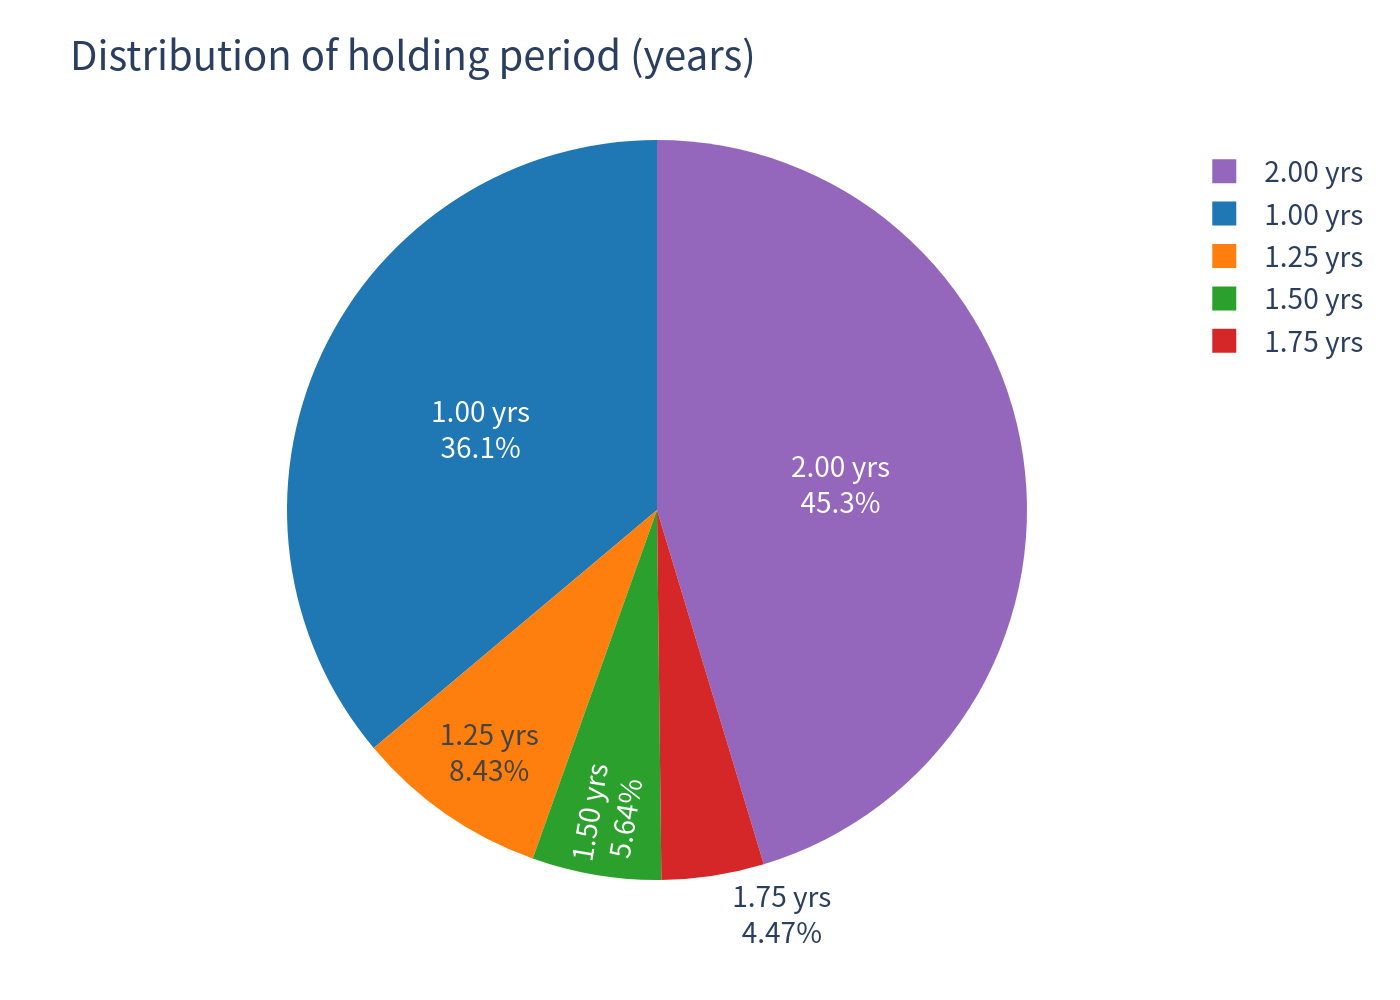
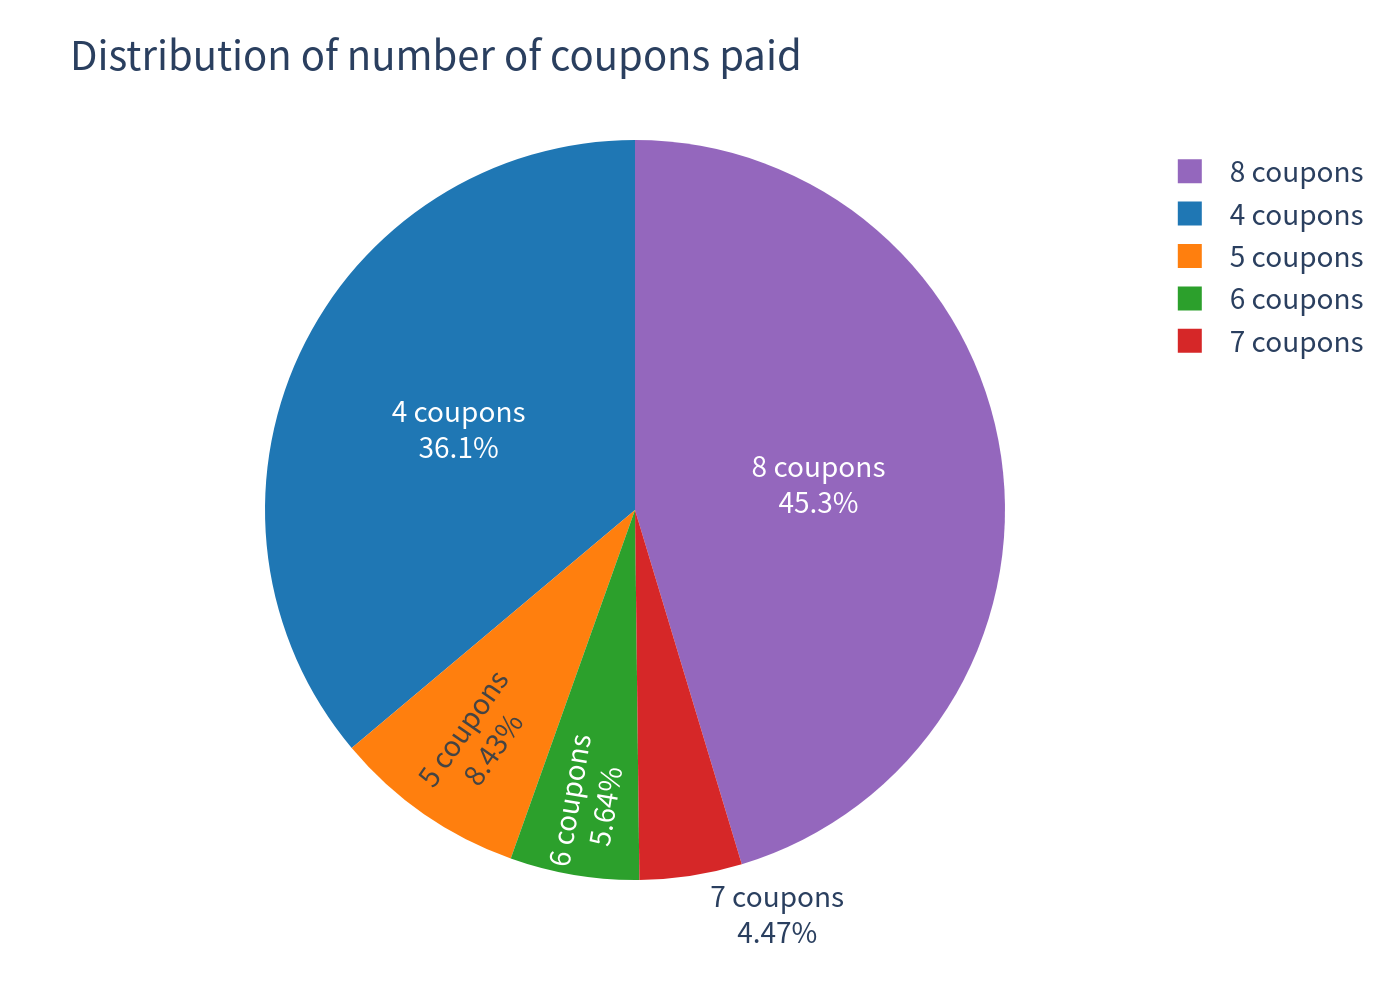
The note is called early in 54.66% of simulations (most often at the very first observation, month 12) and runs the full 24 months in 45.34%; in 14.18% of paths the 69% barrier is breached, which is when coupons continue but capital can be impaired.
Investment Commentary
Simulation basis: 10,000 Monte-Carlo paths (GJR-GARCH(1,1) with Student-t innovations) calibrated to ~20 years of monthly data for Nestlé, Novartis and Roche; barrier approximated by monthly monitoring; Swiss risk-free rate ≈ −0.05% (1-year average of the 3-month interbank rate); equity risk premium 6%; equal-weighted-basket benchmark with dividends added (≈3.28%). Figures are model-based estimates, not guarantees.
Strengths
Things to watch