
7.50% p.a. Multi Barrier Reverse Convertible — Simulation Analysis
Headline Simulation Results
Over the realized holding period the product returned +10.09% on average (expected holding 1.64 years). Because holding periods vary between 12 and 24 months, annualized figures should be read together with these total-return and holding-period numbers (see the note below).
Basic Product Information
| Item | Detail |
|---|---|
| Product | Callable Multi Barrier Reverse Convertible (Yield-Enhancement) |
| Underlyings | Kühne + Nagel, Nestlé, Novartis, Roche (all SIX Swiss, CHF) |
| Coupon | 7.50% p.a., paid quarterly (CHF 18.75 per CHF 1,000) |
| Barrier (continuous) | 55% of each stock's initial level (worst-of) |
| Strike / redemption reference | 100% of initial level (worst performer) |
| Currency / Denomination | CHF / CHF 1,000 |
| Maturity | ~2 years (final fixing 03/11/2028) |
How it works (in plain terms)
You invest CHF 1,000 and receive a fixed 7.50% per year coupon paid quarterly, regardless of how the four Swiss blue-chips perform — as long as the note is outstanding. Your capital is returned at par unless a "barrier event" has occurred, i.e., any one of the four stocks trades at or below 55% of its starting price at any moment during the two-year life.
- No barrier, or worst stock recovers to ≥ start at maturity → you get your CHF 1,000 back (plus all coupons). This is the outcome in the large majority of simulations.
- Barrier hit and the worst-performing stock finishes below its start → you receive that worst stock (or its cash value), so you participate fully in its downside — this is where losses occur.
- Issuer call: on four quarterly dates starting at month 12, the issuer may redeem early at par plus the day's coupon. In practice this happens when all four stocks are above their starting levels (the note becomes "safe" and the issuer refinances more cheaply), which cuts the remaining coupon stream short.
Upside is capped: the maximum total return is +15% over two years (eight coupons plus par, ≈7.5% p.a.); there is no participation in stock gains beyond the coupon.
Key Statistics: Structured Product vs Benchmark
The benchmark is an equal-weight basket of the four underlyings (total return, dividends included).
| Metric | Structured Product | Benchmark (total return) |
|---|---|---|
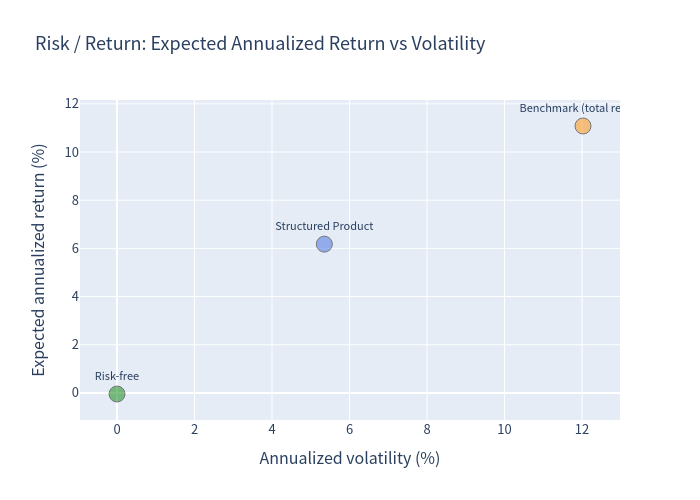
| Expected annualized return | 6.18% | 11.08% |
| Expected annualized volatility | 5.35% | 12.02% |
| Probability of loss | 4.70% | 18.08% |
| 99% VaR (1-year, 1st percentile) | −20.74% | −13.21% |
- Expected total return over realized holding: product +10.09% vs benchmark +9.83% (same horizons).
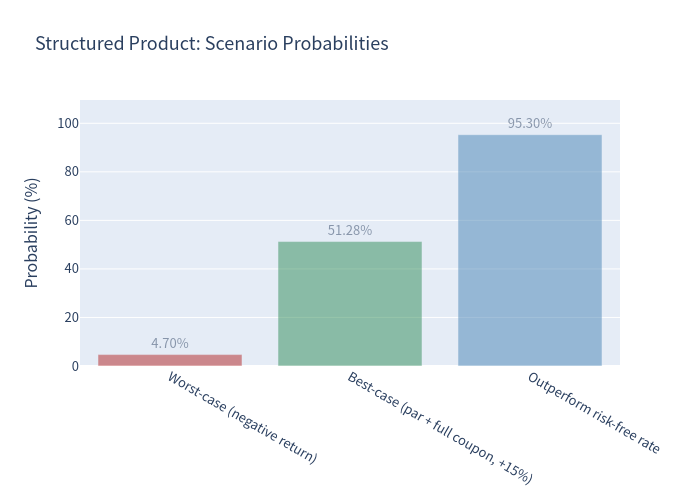
- Probability product beats risk-free rate: 95.30%. Probability product beats the basket (total return): 45.02%.
- Maximum / minimum total return achieved: +15.00% / −60.15%.
Simulation Charts
Product vs Underlying outcomes (per simulation)
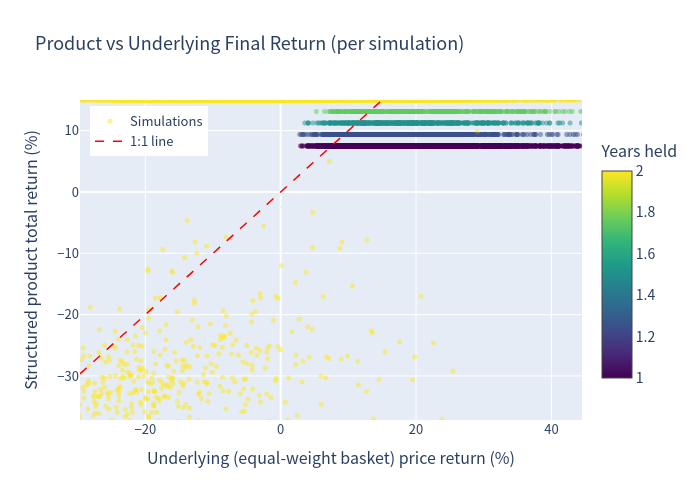
Each dot is one simulation: the underlying basket's price return (x) against the structured product's total return (y), colored by years held. The clustered ceiling near +15% shows the capped upside; losses are concentrated in the bottom-right region where the worst stock fell hard.
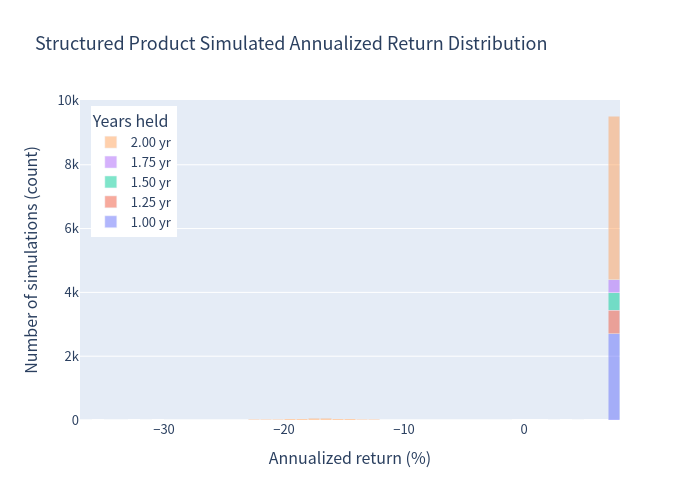
Structured product — annualized return distribution
Returns are strongly concentrated near the 7.2%–7.5% coupon cap (≈95% of paths), with a distinct ~4.7% loss tail stretching to deep negative returns.
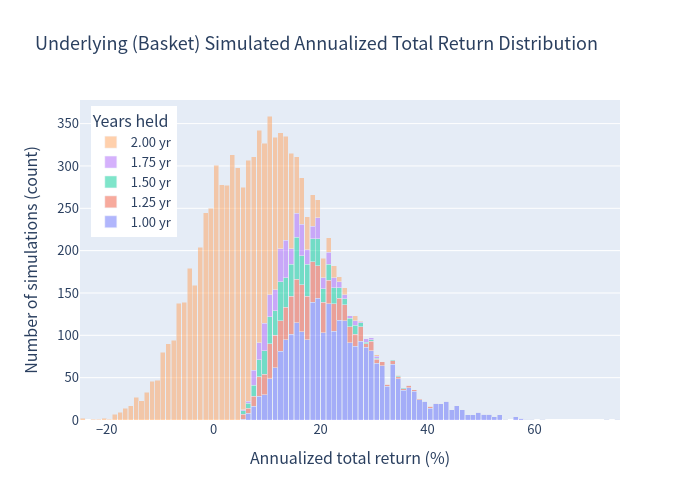
Underlying basket — annualized return distribution
The basket distribution is wide and roughly symmetric, with substantial probability of loss — much more dispersed than the product.
Risk / Return profile
The product sits at lower return but far lower volatility than the benchmark; the risk-free rate is near 0%.
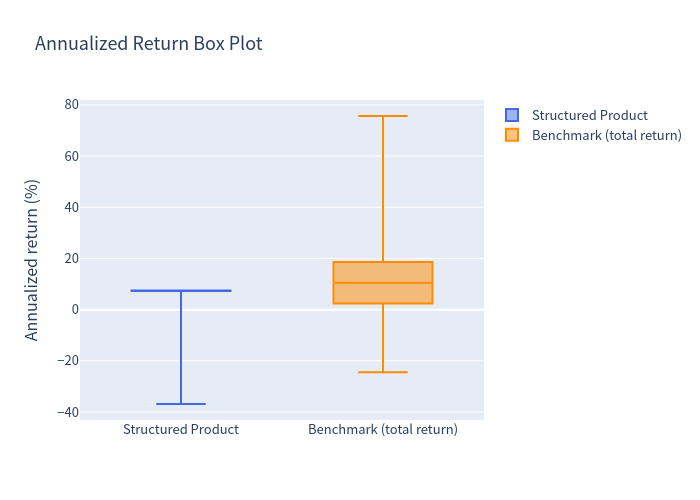
Annualized return box plot
The product's box is tightly packed near its cap with a long lower whisker; the benchmark has a wider interquartile range.
Scenario probabilities
Worst-case (any negative return), best-case (par + the full eight-coupon stream = +15%), and outperforming the near-zero risk-free rate.
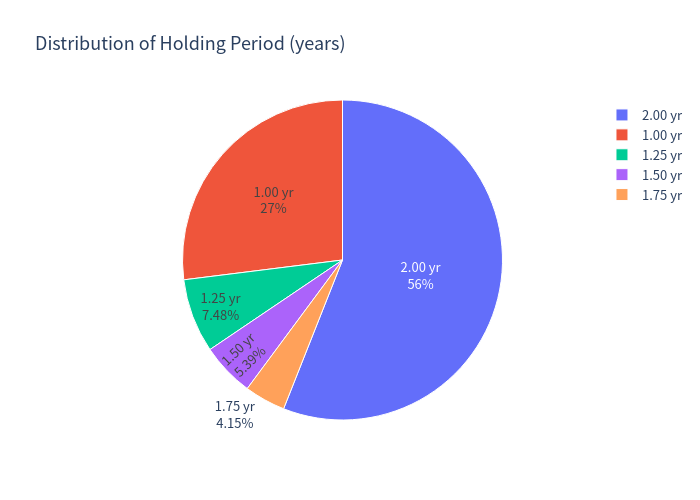
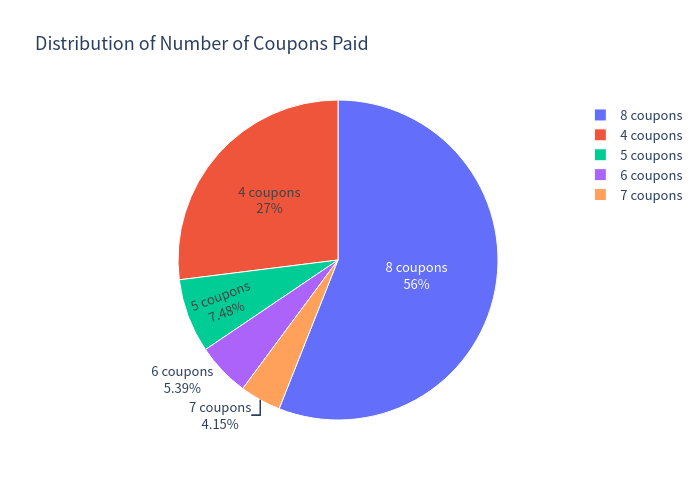
Holding period and coupon distribution
The product is called before maturity in roughly a quarter of scenarios, and otherwise runs the full two years.
Investment Commentary
Strengths
- High, largely unconditional income: the 7.50% p.a. coupon is paid throughout the note's life regardless of underlying performance (coupons continue in essentially all non-default paths), and the deep 55% barrier means ordinary market pullbacks do not interrupt coupons. As a result, ~95% of simulations finish with a positive total return.
- Low volatility and low hit-rate on losses: only ~4.7% of simulations produce a loss, versus ~18% for holding the basket directly; day-to-day return volatility (~5.4%) is less than half that of the stocks.
- Buffered — but only until the barrier is touched: capital is protected as long as no stock ever trades at/below 55% of its start; moderate weakness that stays above 55% is tolerated with par returned. However, because observation is continuous, even a brief dip to 55% followed by a recovery can still force a principal loss if the worst-performing stock finishes below its starting level at maturity.
Trade-offs to be aware of
- Capped upside: total return cannot exceed +15% over two years regardless of how strongly the stocks perform; you forgo equity upside.
- Worst-of tail risk: when the barrier is breached and the worst performer keeps falling, losses can be severe (down to −60% in the worst simulations). The 99% VaR (−20.74%) is therefore worse than the basket's (−13.21%) despite the lower average volatility — the risk is concentrated in a rare but deep left tail.
- Callable structure: the issuer redeems early when all stocks are up, so the favourable scenarios are truncated — you typically do not collect the full coupon stream when markets rally (max achieved return in rallying scenarios is ~7.5% annualized).
- Issuer/credit exposure: the return of capital depends on the issuer (mitigated by triparty collateralisation described in the terms).
This analysis is a quantitative evaluation of simulated outcomes and does not constitute financial advice or a suitability assessment.