
SPXF40D4 Contingent Income Memory Auto-Callable Securities — Simulation Report
Headline simulation results
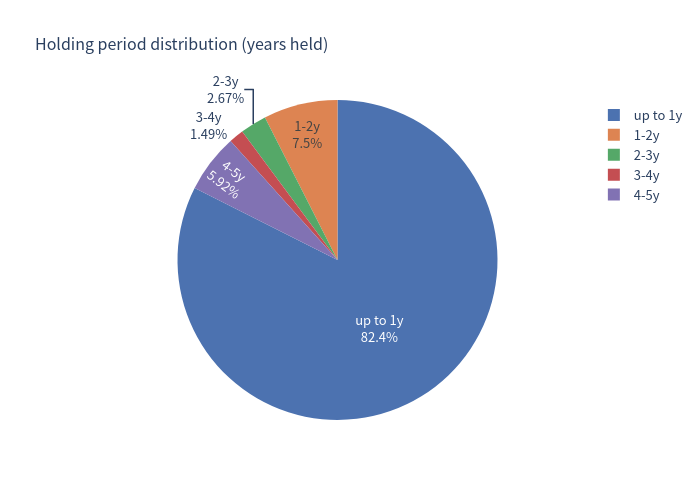
Monte Carlo simulation, 20,000 paths. Because 95% of simulated paths auto-call early (median holding period only 6 months), the annualized figures reflect a very short, coupon-dominated holding period and should be read together with the total-return and holding-period numbers. The 1st-percentile outcome is still positive because a loss requires the underlier to finish below 60% of its start and coupons received to fail to cover that fall.
Detailed simulation metrics
| Metric (Monte Carlo, 20,000 paths) | Value |
|---|---|
| Expected annualized return | 12.34% |
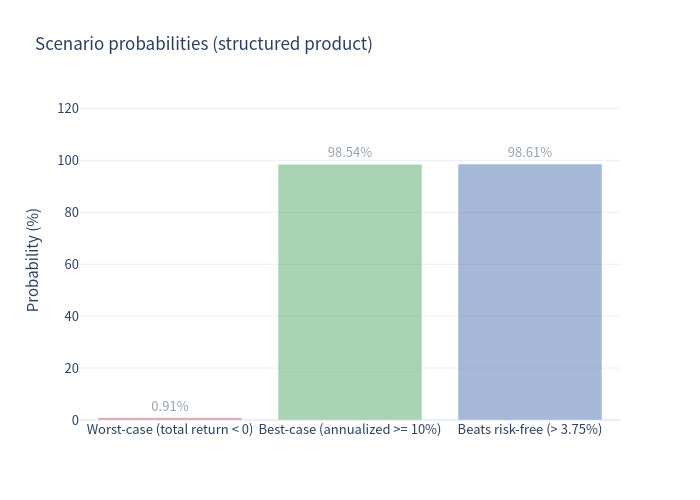
| Probability of a negative return | 0.91% |
| 99% confidence VaR (1 year, 1st-pct annualized return) | +0.95% |
| Expected holding period | 11.6 months (median 6 months) |
| Probability of early auto-call | 95.16% |
| Expected total return over the realized holding period | 11.22% |
How the product works (plain language)
- The security is linked to a single index, the S&P 500 Futures 40% Intraday 4% Decrement VT Index (SPXF40D4) — an S&P 500 futures index that deducts 4% per annum from its level.
- Contingent monthly coupon of 12.25%–13.25% p.a. (midpoint 12.75% p.a. modelled), paid only on a month in which the index closes at or above 60% of its initial level. A memory feature repays any previously skipped coupons once the 60% test is met again.
- Automatic early redemption: from month 6, on any monthly date the index is at or above 100% of its start, the note redeems at par ($1,000) plus accrued coupons and stops.
- If never called: at maturity the index ≥ 60% ⇒ par + coupons; the index < 60% ⇒ 1:1 downside off the initial level (e.g. −60% ⇒ $400, −100% ⇒ $0). Upside is capped — the investor never participates in index gains.
- Issuer credit risk applies to every payment.
Key statistics (annualized, 60-month horizon)
| Series | Expected return | Expected volatility | Probability of loss | 99% VaR (1 yr) |
|---|---|---|---|---|
| Structured product | 12.34% | 2.09% | 0.91% | +0.95% |
| Underlier (SPXF40D4 decrement index) | 10.95% | 11.95% | 4.75% | −11.45% |
| S&P 500 (price) | 15.31% | 12.19% | 3.40% | −7.77% |
| S&P 500 Total Return (dividends added) | 16.29% | 12.19% | 3.01% | −6.79% |
| Risk-free rate (1-yr avg repo/T-bill ≈ 3.75%) | 3.75% | 0.00% | 0.00% | 0.00% |
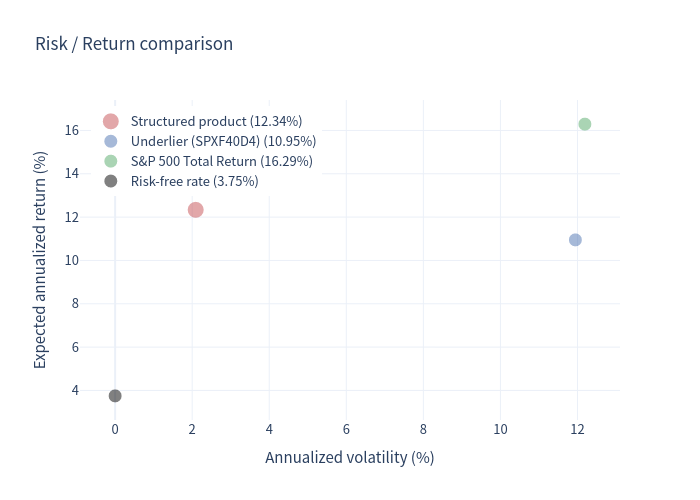
The coupon structure turns a volatile equity exposure into a low-volatility, high-coupon payoff: the product's expected return (12.34%) exceeds the underlier it references (10.95%) and dwarfs cash (3.75%), at a fraction of the underlier's volatility (2.09% vs 11.95%). It trails the un-decremented S&P 500 total return (16.29%), because the product caps upside and the referenced index gives up 4% per year.
Charts
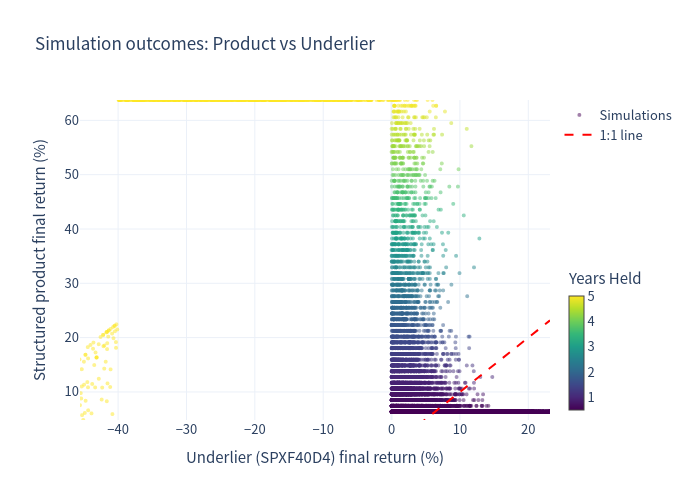
Simulation outcomes (product vs underlier, coloured by years held)
Each simulated path plotted by outcome, with the years held shown by colour.
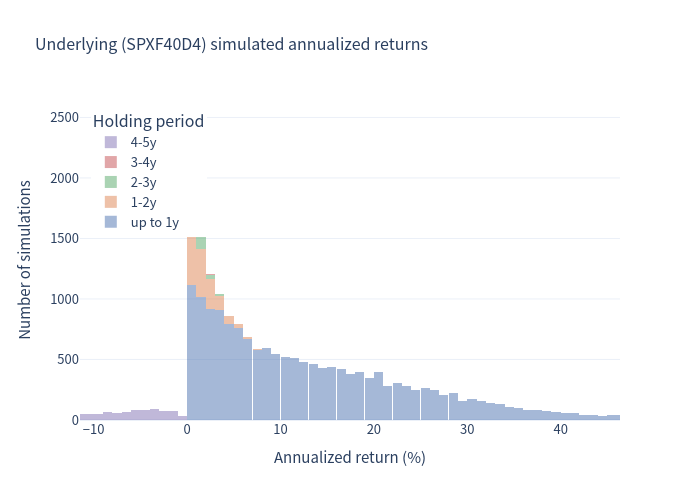
Underlying (SPXF40D4) simulated annualized returns
Distribution of annualized returns for the referenced decrement index.
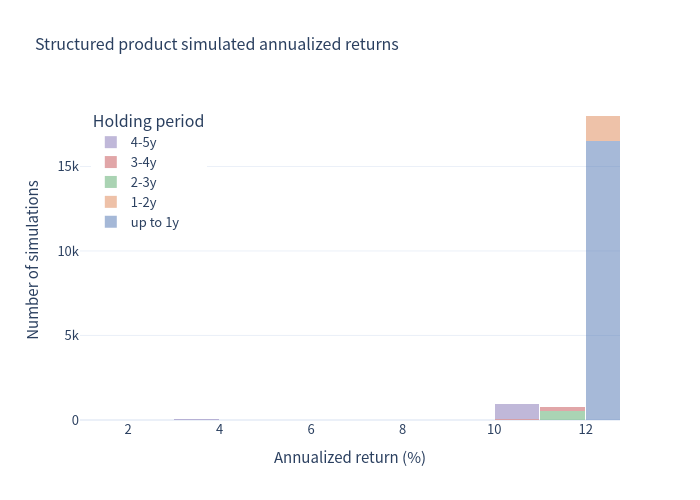
Structured product simulated annualized returns
Distribution of annualized returns for the contingent income memory auto-callable security.
Risk / return comparison
Expected return versus expected volatility across the product, the underlier, the S&P 500 and cash.
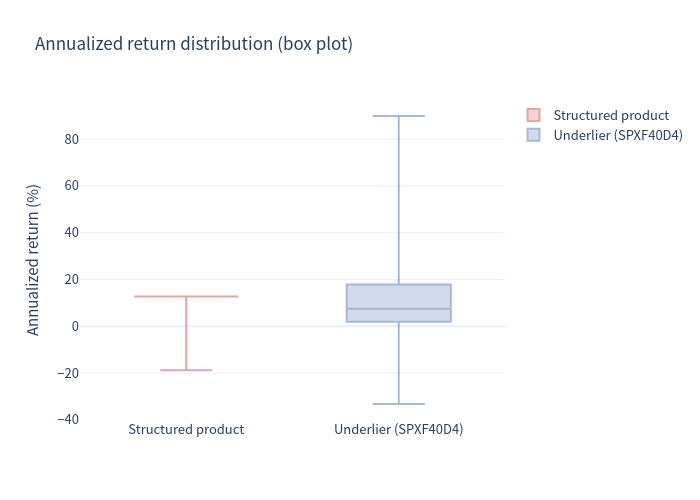
Annualized return distribution (box plot)
Box plot comparison of annualized return distributions across series.
Scenario probabilities
Probability of each outcome scenario (auto-call, par redemption, capital loss).
Holding-period distribution
Distribution of how long the security is held before redemption or maturity.
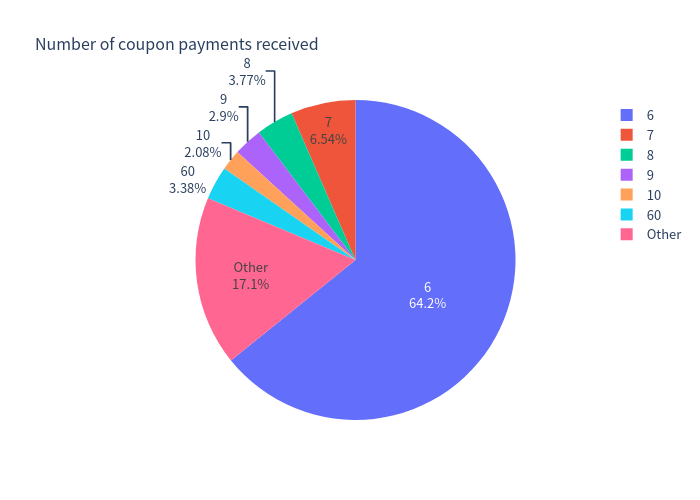
Number of coupon payments received
Distribution of the number of monthly coupon payments collected.
Investment commentary
Points in favour
- Attractive headline income: a 12.25%–13.25% p.a. coupon in a structure that, in most paths, returns to par within roughly a year.
- Memory feature materially improves the odds of eventually collecting skipped coupons versus a non-memory structure.
- Low realized volatility (≈2%) and a positive 1st-percentile outcome: the coupon buffer means losses are rare in the simulation, and only appear when the underlier collapses below 60%.
- Short expected life (~12 months) limits exposure to the 4% annual decrement drag.
Risks to be aware of
- Capped upside — the investor receives no participation in index appreciation; returns are limited to par plus coupons.
- Decrement drag — the referenced index loses 4% every year whether the market rises or falls, so the 100%/60% thresholds sit on a level that erodes over time.
- Contingent, not guaranteed, coupon — coupons stop if the 60% barrier is breached; a deep event also triggers the 1:1 downside, and the worst simulated outcome is about −65%.
- Early-redemption / reinvestment risk — a 95% auto-call rate means the investor is likely to have capital returned early and face reinvestment at then-prevailing rates.
- Issuer credit risk — all payments depend on Morgan Stanley's ability to pay.
- Deep-tail outcomes: while rare in the simulation, a severe equity decline (below 60% of start on the decrement index) produces a large capital loss.
Figures are simulation-based estimates over a 60-month horizon and use a 12.75% p.a. coupon (midpoint of the 12.25%–13.25% range); the actual coupon will be fixed at pricing.