
Structured Product Analysis Report
11.60% p.a. Multi Barrier Reverse Convertible on Honda Motor / IHI Corp / Kawasaki Heavy Industries
| Metric | Value |
|---|---|
| Expected annualized return (mean) | 4.12% |
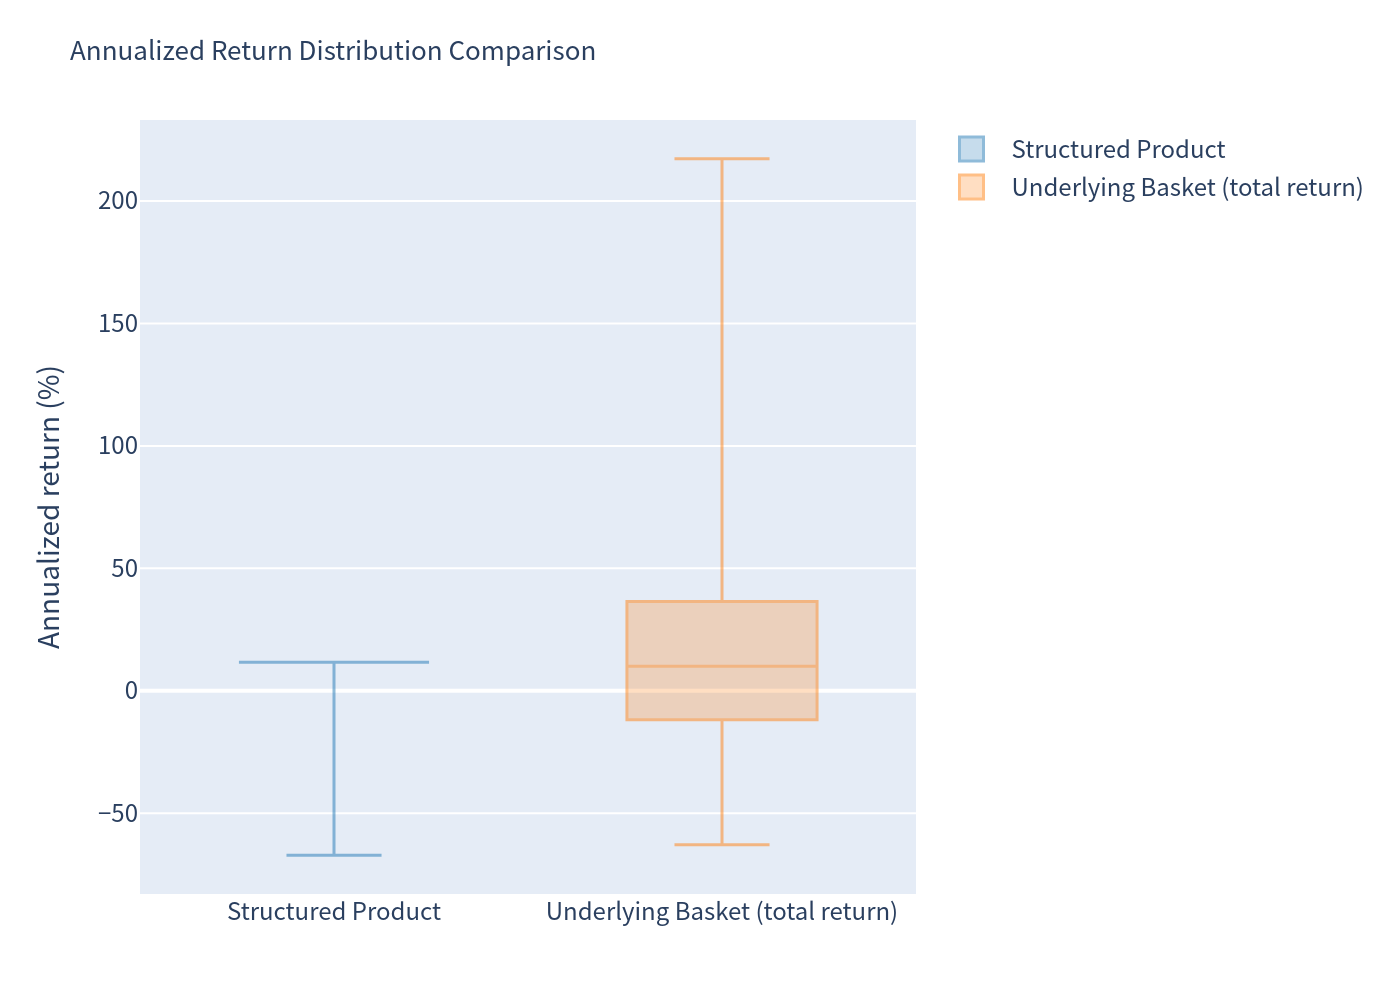
| Median annualized return | 11.60% |
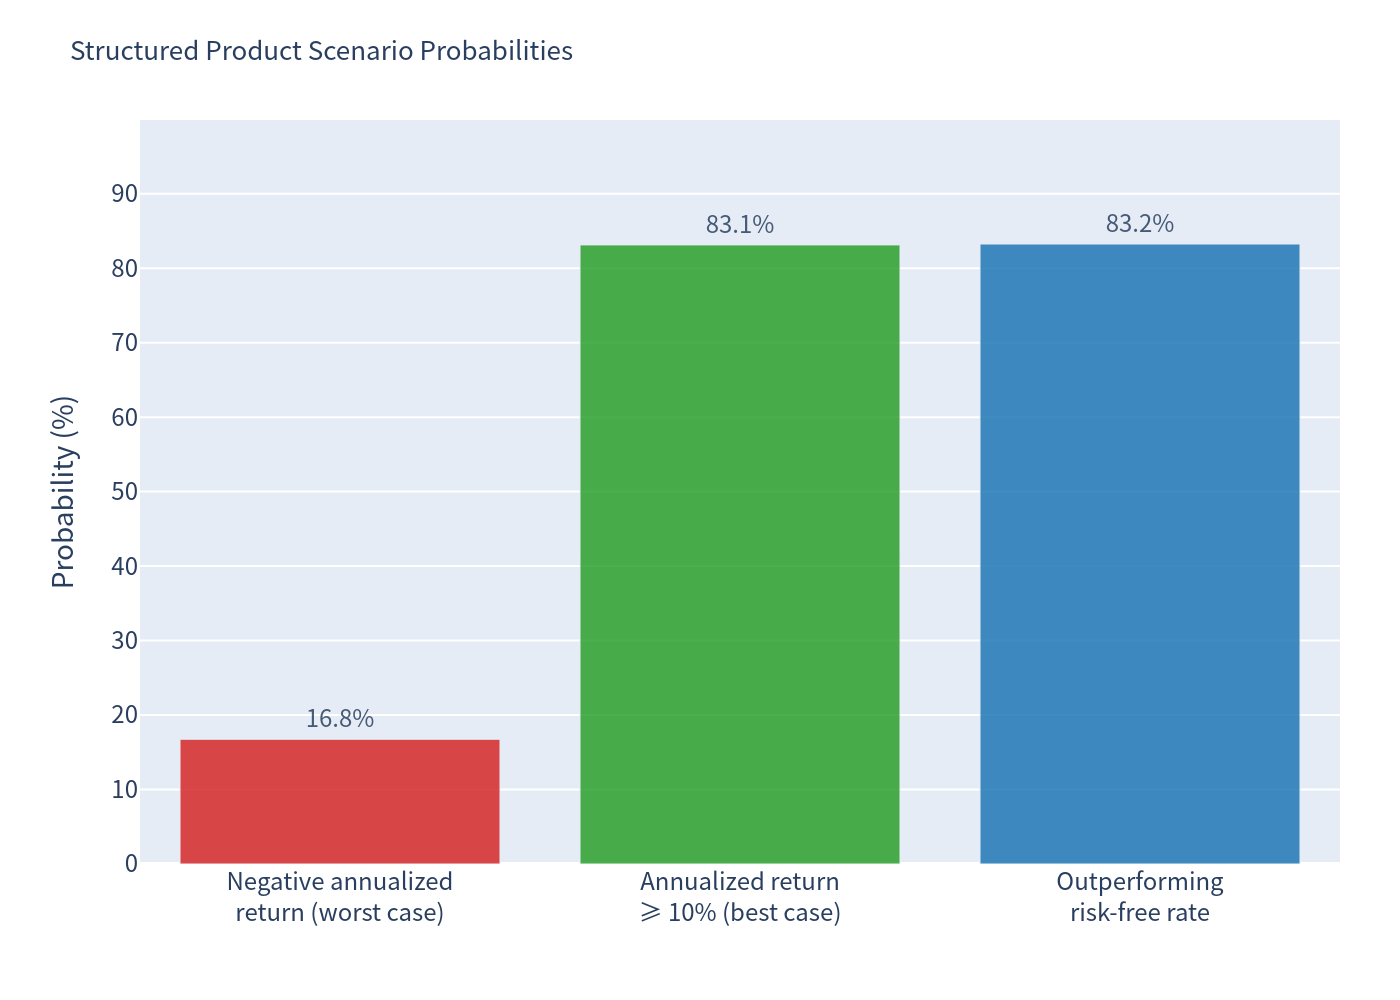
| Probability of negative annualized return | 16.75% |
| 99% confidence VaR (1 year) | -47.33% |
| Expected total return over realized holding period | 2.23% |
| Expected holding period | 10.04 months (~0.84 years) |
The product pays a fixed coupon of 11.60% p.a. (CHF 29.00 per CHF 1,000 every quarter) regardless of underlying performance, and returns par at maturity unless one of the three underlying Japanese stocks falls by more than 41% from its starting level at any point (59% barrier) and the worst performer finishes below its start. Under the simulated scenarios, 83.25% of paths finish with a positive return, but the average outcome is pulled down by severe losses in the tail (~17% of paths where capital is impaired, average total loss ≈ -33% of the invested amount).
How it works (in plain terms)
- You receive a high quarterly coupon (2.90% per quarter, i.e. 11.60% per year) regardless of what the three stocks do.
- The note matures in about 1 year (September 2027). As long as none of Honda Motor, IHI or Kawasaki Heavy Industries ever trades at or below 59% of its starting level during the observation period, you get your full CHF 1,000 back at maturity.
- If one of the three stocks does breach the 59% barrier, your redemption depends on the worst-performing stock at maturity:
- worst stock still at/above its starting level → full par back;
- worst stock below its starting level → you receive shares of that worst stock, worth less than par (loss of capital proportional to the drop).
- The issuer may call the note early (after ~6 or ~9 months); if called you receive par plus the coupon for that period. Modeling assumption: the issuer is assumed to call when all three underlyings are at or above their initial levels (i.e. when refinancing is cheaper for the issuer). Results are conditional on this assumption.
- The product is Quanto CHF: the underlying stocks are in JPY but the payout is fully currency-protected (no FX exposure).
- Upside is capped at the coupon; the strike level equals 100% of the initial fixing level.
Key terms at a glance
| Item | Detail |
|---|---|
| Underlyings (worst-of) | Honda Motor (7267), IHI Corp (7013), Kawasaki Heavy Industries (7012) — Tokyo Stock Exchange |
| Coupon | 11.60% p.a. fixed = CHF 29.00 per quarter per CHF 1,000 (11.6 index points p.a.) |
| Coupon dates | Months 3, 6, 9, 12 (Dec-2026, Mar/Jun/Sep-2027) |
| Barrier | 59.00% of initial level, any underlying, observed throughout the term |
| Strike | 100.00% of initial level |
| Issuer call dates | Month 6 (10/03/2027) and Month 9 (10/06/2027) |
| Maturity | Final fixing 10/09/2027; redemption 16/09/2027 |
Benchmark = equally-weighted basket of the three underlyings. Figures below are computed on the same holding-period horizon as each product simulation and annualized (see notes).
| Statistic | Structured Product | Underlying basket (incl. dividends) |
|---|---|---|
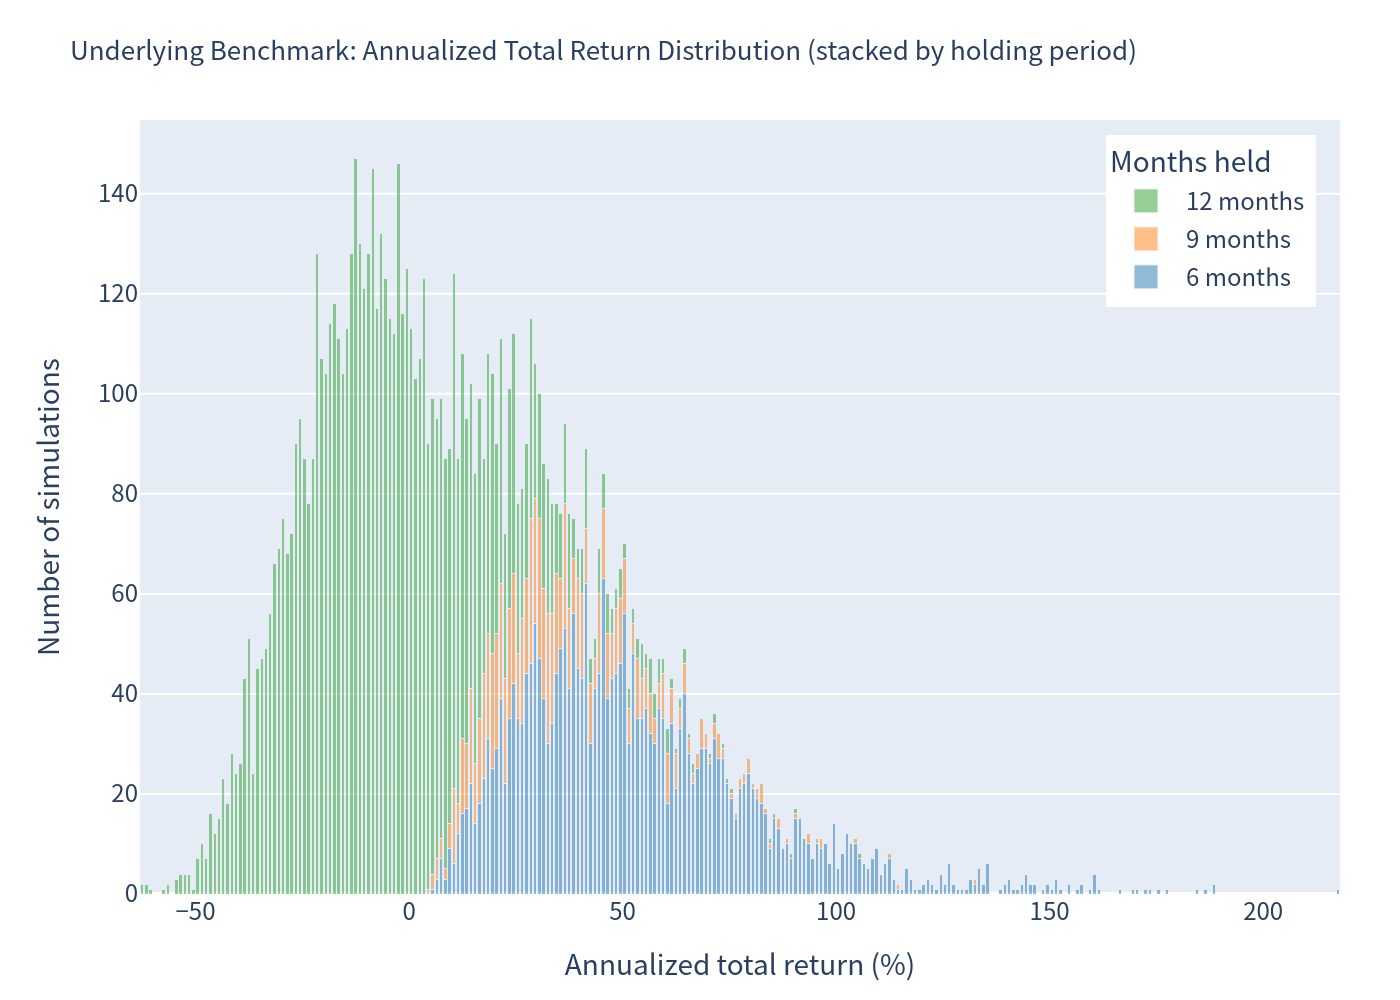
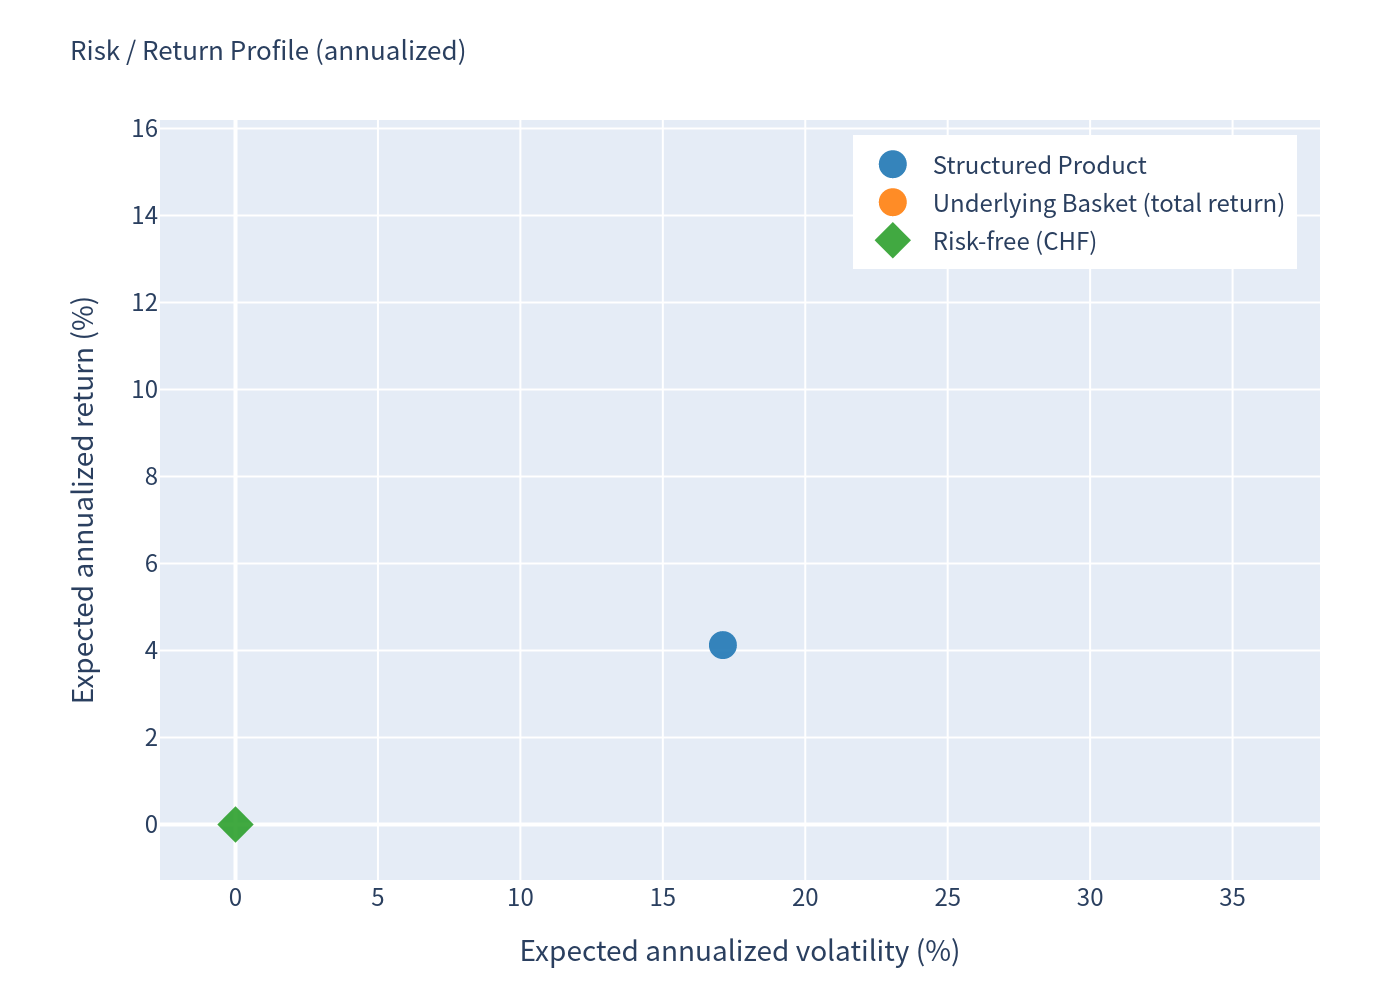
| Expected annualized return | 4.12% | 14.92%* |
| Expected annualized volatility | 17.11% | 35.42% |
| Probability of loss | 16.75% | 39.96% |
| 99% VaR (1 year, annualized) | -47.33% | -43.69% |
Product outcome distribution
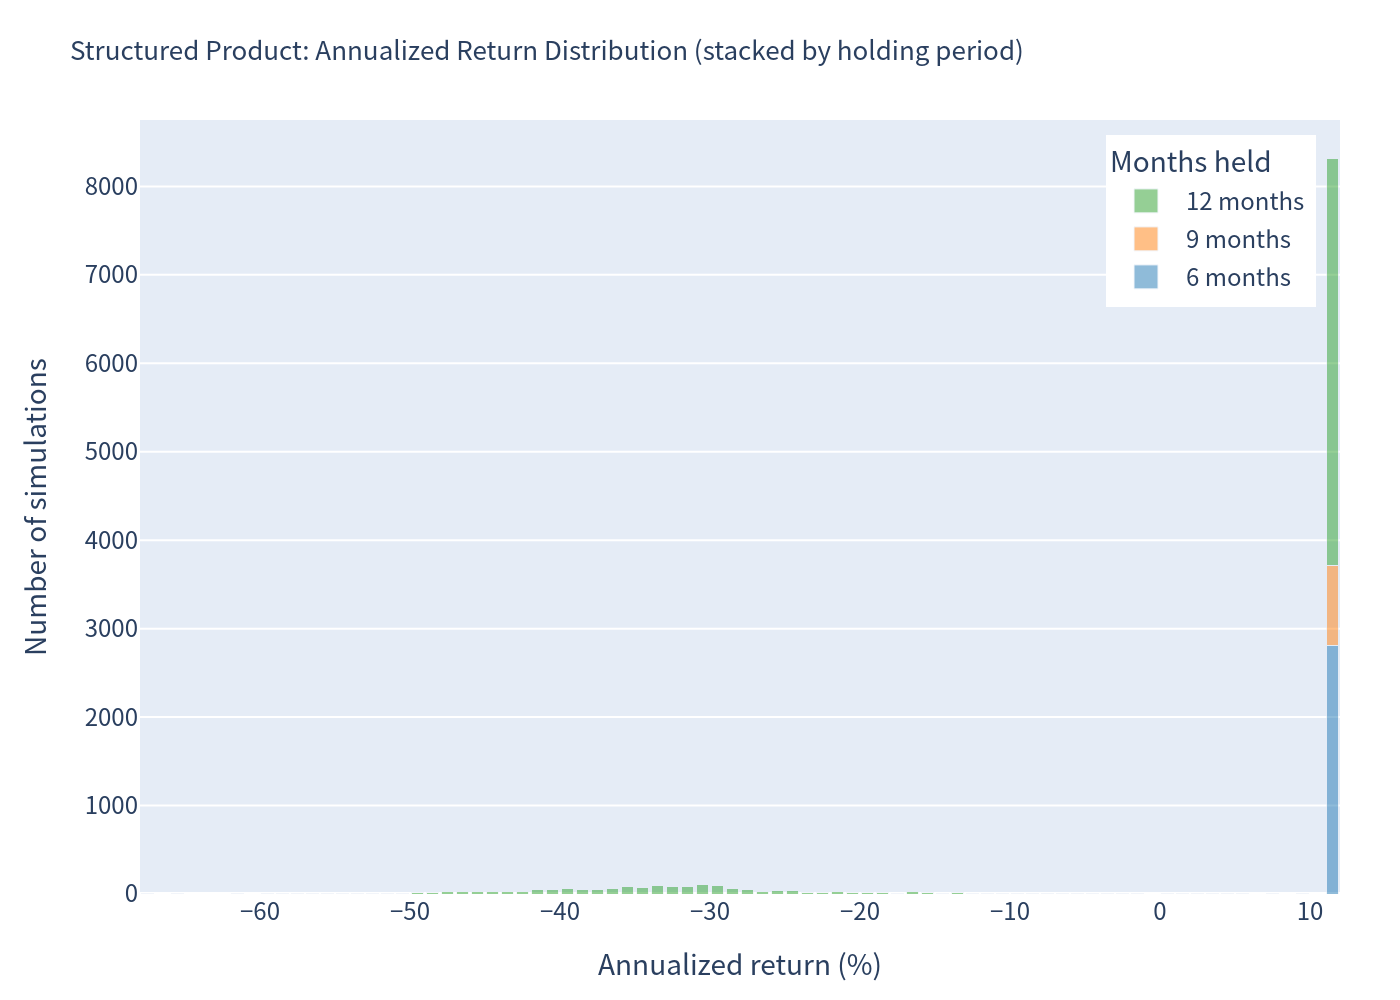
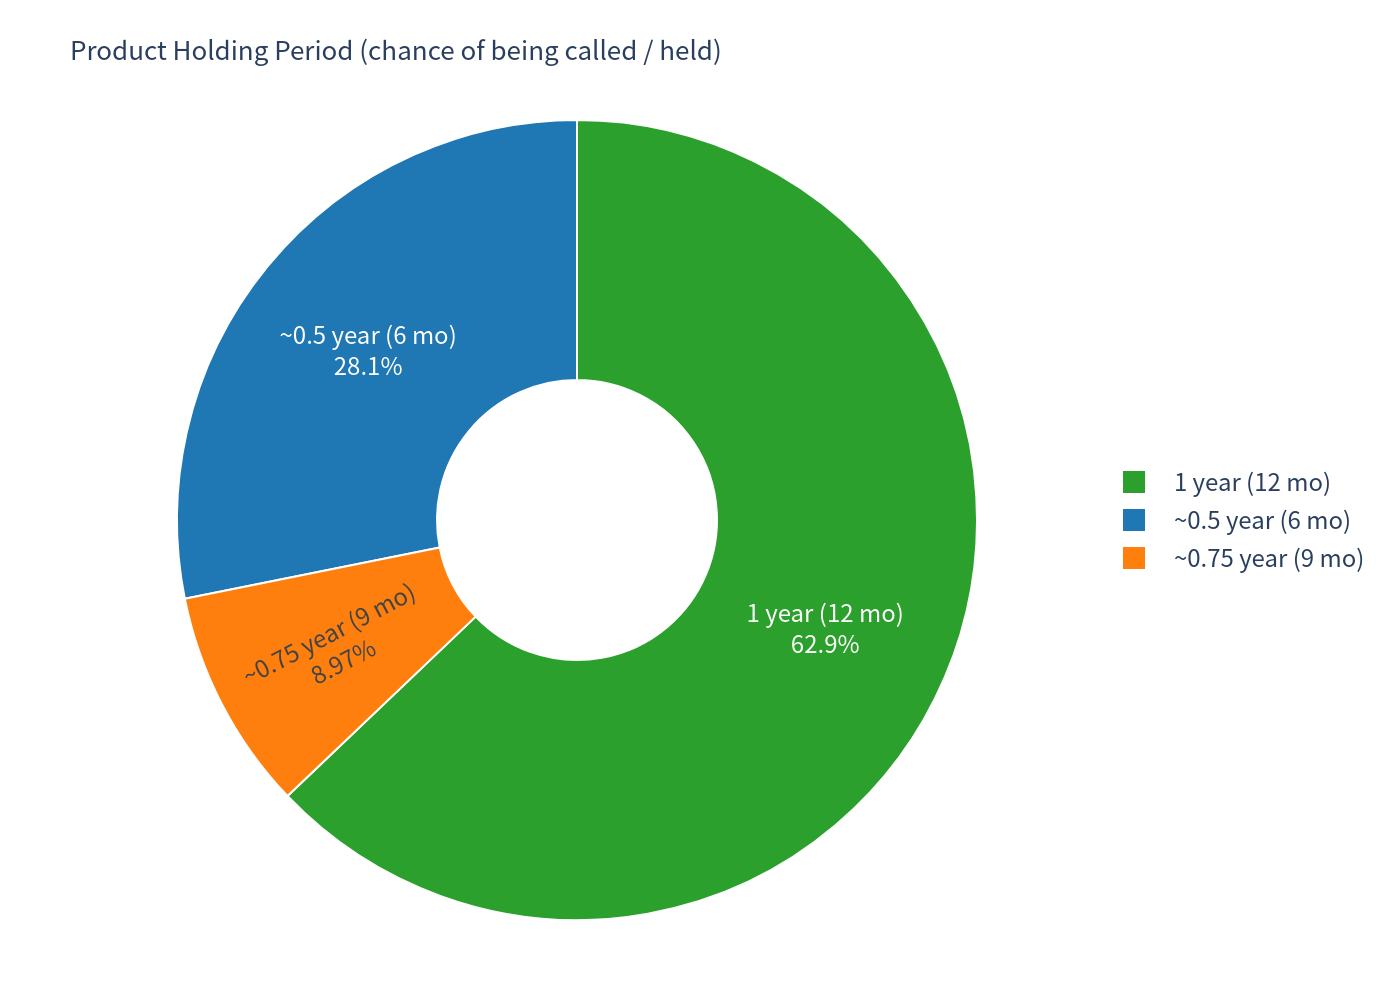
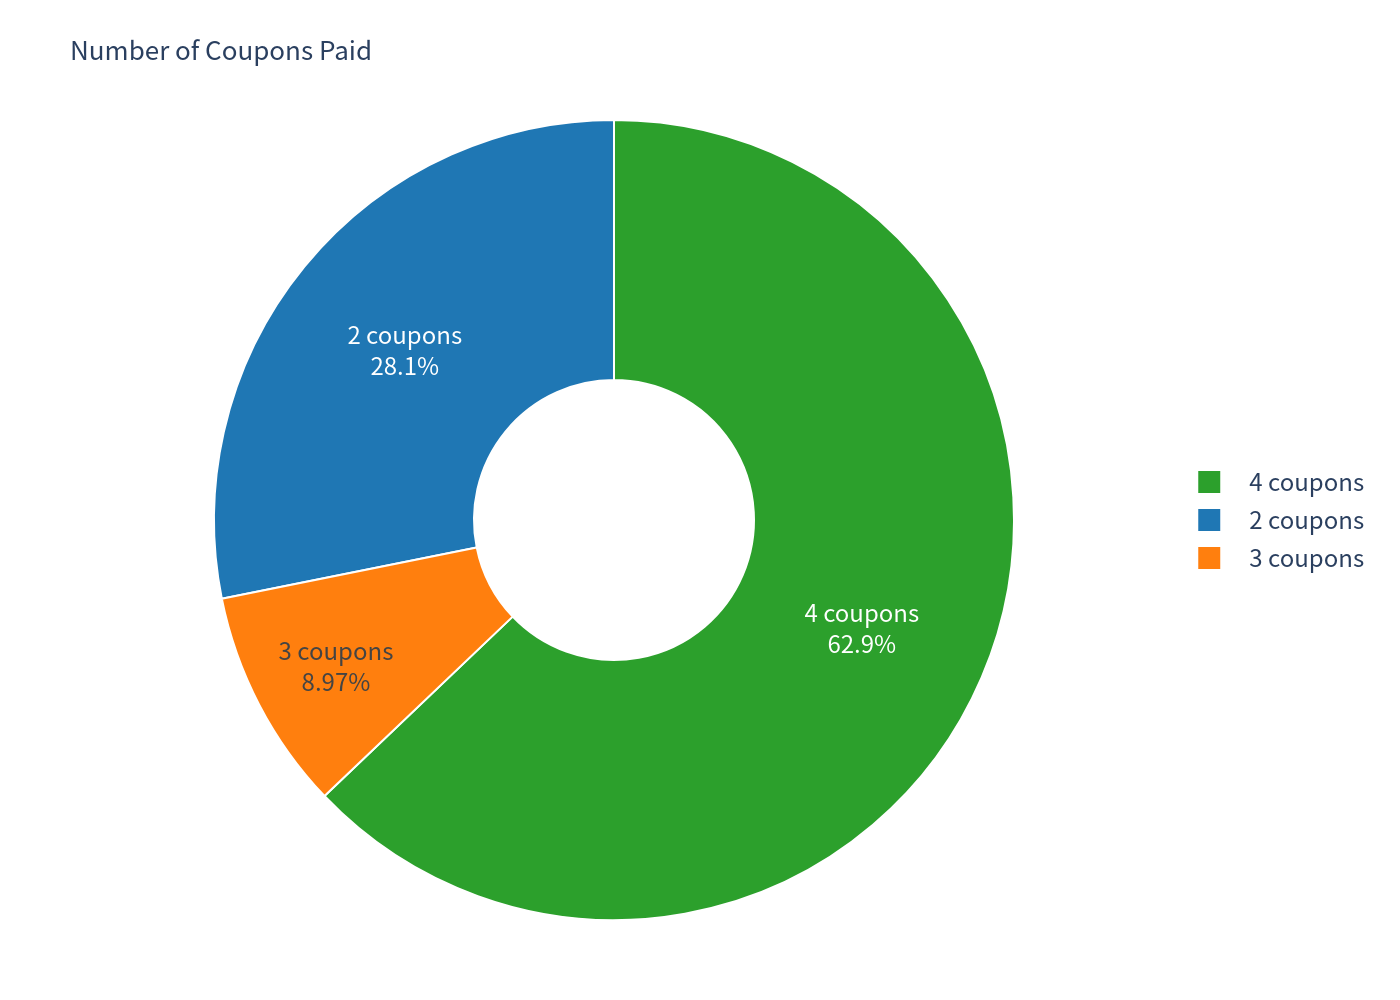
- Holding period: ≈28.15% called after 6 months (2 coupons), ≈8.97% called after 9 months (3 coupons), ≈62.88% held to maturity (4 coupons).
- Average number of coupons paid: 3.35 (≈ 9.7 coupon index points).
- Barrier breached in ≈ 17.09% of scenarios; ≈ 16.87% of scenarios end in physical share delivery (capital impaired).
- When capital is impaired (≈16.8% of paths — always paths held to maturity, so all 4 coupons of 11.6 index points are still received), the average total payoff (share-delivery value plus the 11.6 coupon points) is ≈ 67.0 index points, i.e. an average total loss of ≈ -33% of the 100 invested.
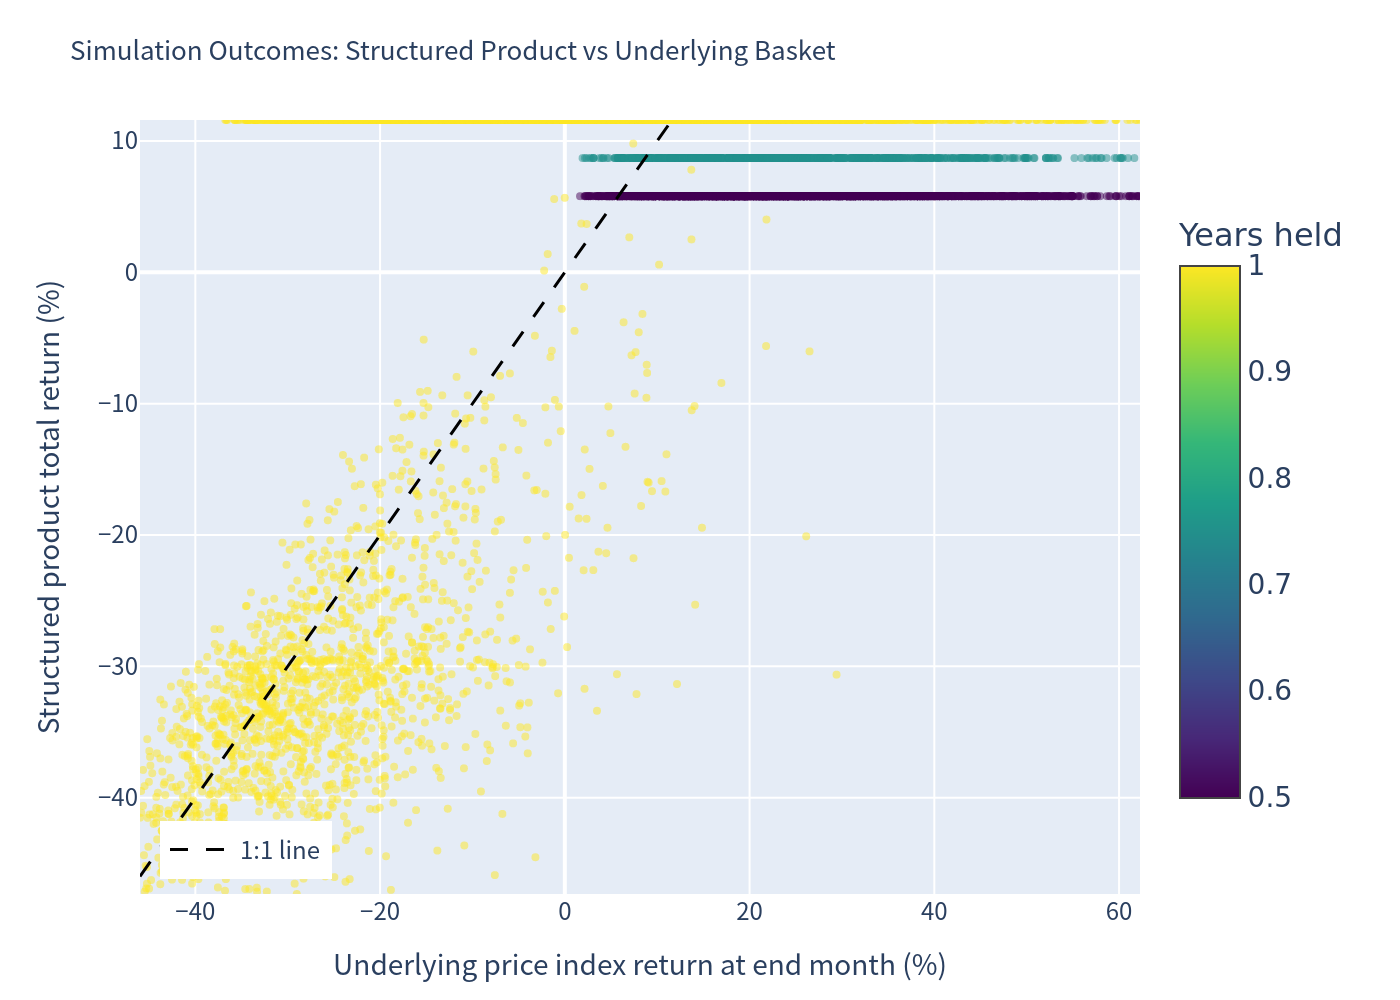
4.1 Simulation Outcomes — Product vs Underlying
Scatter of simulated annualized outcomes comparing the structured product with the underlying basket.
4.2 Annualized Return Distributions (stacked by holding period)
Distribution of product annualized returns (stacked by call / maturity holding periods).
4.2 Annualized Return Distributions (continued)
Distribution of underlying benchmark annualized returns.
4.3 Scenario Probabilities
Probability of each terminal scenario: full redemption, issuer call and capital-impaired (physical delivery) outcomes.
4.4 Risk / Return Profile
Risk-return trade-off of the product versus the direct underlying investment.
4.5 Return Distribution Comparison (Box Plot)
Box-plot comparison of annualized return distributions for the product and the underlying benchmark.
4.6 Holding Period & Coupon Outcomes
Distribution of realized holding periods across simulated scenarios.
4.6 Holding Period & Coupon Outcomes (continued)
Distribution of the number of coupons paid across simulated scenarios.
Attractive features
- High fixed coupon (11.60% p.a.) paid regardless of underlying performance — among the higher coupons available on barrier products with a 59% barrier.
- Deep barrier (59%) means the product absorbs moderate-to-significant market declines (up to ≈ 41%) without impairing capital — probability of loss ≈ 17%, versus ≈ 40% for a direct stock-basket investment on the same realized-horizon basis (≈47% measured unconditionally over the full year).
- Coupon is paid on early redemption dates — even if the issuer calls the note after 6 or 9 months, the investor has received all coupons due to that point (median annualized outcome 11.60%).
- Quanto CHF structure removes JPY/CHF currency risk for a CHF-based investor.
- ≈83% of simulated scenarios deliver a positive total return.
Points to consider
- Upside is capped: in rising markets the return is limited to the coupon stream, whereas a direct equity investment captures the full upside (early-called up-market paths illustrate this trade-off).
- Capital is at risk in tail scenarios (worst-of barrier): a breach by a single stock followed by a weak finish can produce severe losses (average total loss ≈ -33%; 99% VaR ≈ -47%).
- Issuer call feature truncates the coupon stream when markets are strong, shortening the average holding period to ≈ 10 months; annualized figures for short holding periods can look extreme and should be read together with total return and holding period.
- Returns are subject to issuer credit risk (Leonteq Securities AG, Guernsey Branch).
Note: Simulation-based statistics are estimates and depend on modeling assumptions, including the issuer-call behavior, volatility/correlation inputs and monthly discretization of the continuous barrier. Figures are rounded to 2 decimal places.