
Morgan Stanley SPXFP Market-Linked Notes due June 3, 2031 — Investment Analysis
Headline Simulation Results
| Metric | Structured Product | Underlying Benchmark (total return) |
|---|---|---|
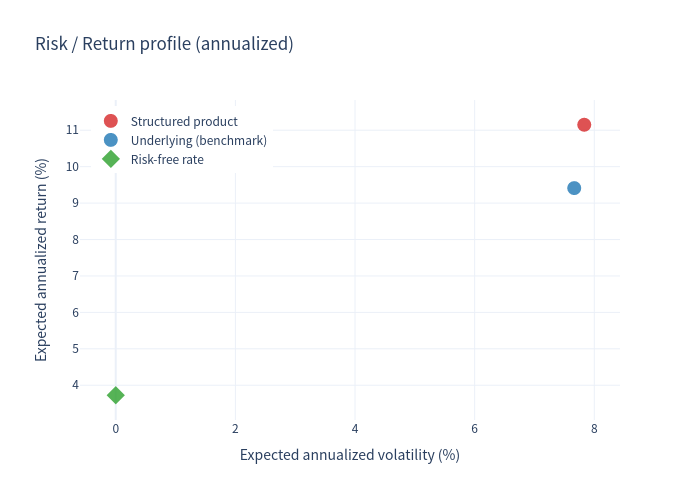
| Expected annualized return | 11.15% | 9.41% |
| Probability of negative return | 0.00% | 11.56% |
| 99% confidence VaR (1 year, annualized) | 0.00% | -9.99% |
| Expected annualized volatility | 7.83% | 7.66% |
- Expected holding period: 5.0 years (60 months) — the notes are always held to maturity (no early redemption feature exists).
- Expected 5-year total return (mean of per-simulation total returns): 78.26% for the note, versus 57.25% for the underlying price-index return.
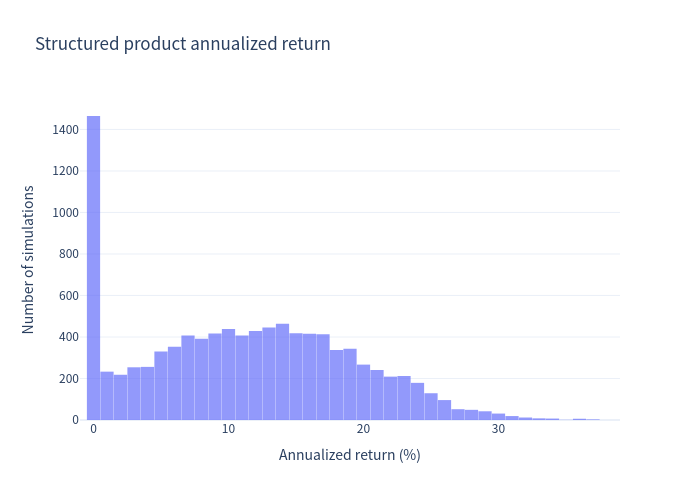
- Because the note is principal-protected at maturity, its annualized return is never negative (0.00% probability of loss) — 13.73% of paths return exactly par.
Basic Product Information
- Issuer / Guarantor: Morgan Stanley Finance LLC / Morgan Stanley (all payments subject to issuer credit risk)
- Product type: Principal-protected Market-Linked Note — no coupons, no early redemption, 5-year term
- Notional: USD $1,000 stated principal amount per note
- Underlier: S&P 500® Futures Excess Return Index (SPXFP), a single index (a futures-based excess-return index, not a dividend-paying total-return index)
- Participation rate: 130.50% – 134.50% (analysis assumes 130.50%, the rate used in the term-sheet payoff table)
- Estimated value at issue: $965.60 per note (below the $1,000 principal)
How it works (in plain terms)
You invest $1,000 and receive no interest along the way. At maturity (June 3, 2031) the payoff depends only on how the reference index performed over the 5-year term:
- If the index is UP by X%, you receive $1,000 × (1 + 130.5% × X) — 130.5% of any upside gain (e.g., +20% index → $1,261; +40% → $1,522).
- If the index is FLAT or DOWN, you receive $1,000 back — principal is protected at maturity regardless of how far the index falls.
In short: full downside protection at maturity, plus leveraged and uncapped participation in positive index performance — in exchange for no income/dividends during the term and issuer credit exposure.
Key Statistics (annualized, 10,000 simulations)
| Statistic | Structured Product | Underlying Benchmark (total return) |
|---|---|---|
| Expected annualized return | 11.15% | 9.41% |
| Median annualized return | 11.11% | 9.87% |
| Expected annualized volatility | 7.83% | 7.66% |
| Probability of loss | 0.00% | 11.56% |
| 99% VaR (1-year, annualized) | 0.00% | -9.99% |
| 99th percentile annualized return | 29.02% | 25.33% |
- The note's expected annualized return (11.15%) exceeds the benchmark's (9.41%) because the par floor removes the downside tail while the 130.5% participation amplifies upside.
- Why par probability and benchmark loss probability differ: 13.73% of note paths end exactly at par (index price return ≤ 0). The benchmark "probability of loss" (11.56%) is computed on total returns including the ~0.98% dividend proxy, so paths with a small index-price decline are still profitable once dividends are included — hence a smaller loss probability than the par share.
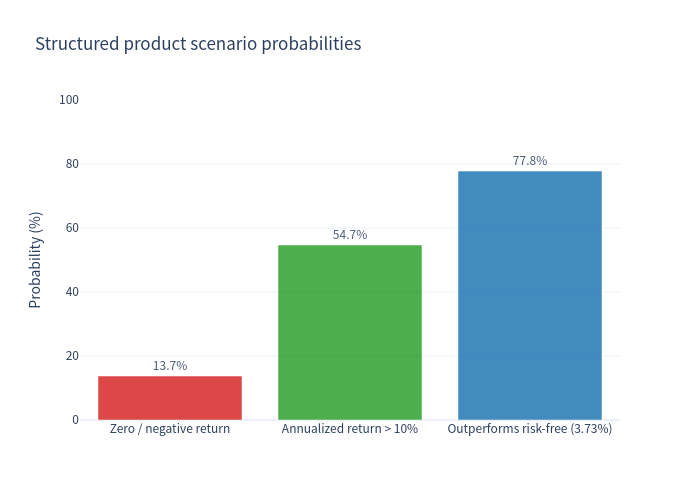
- Scenario probabilities (note): 13.73% of paths end at par (zero return), 54.68% achieve an annualized return above 10%, and 77.78% outperform the risk-free rate of 3.73%.
Charts
Simulation outcomes: structured product vs underlying (5-year returns)
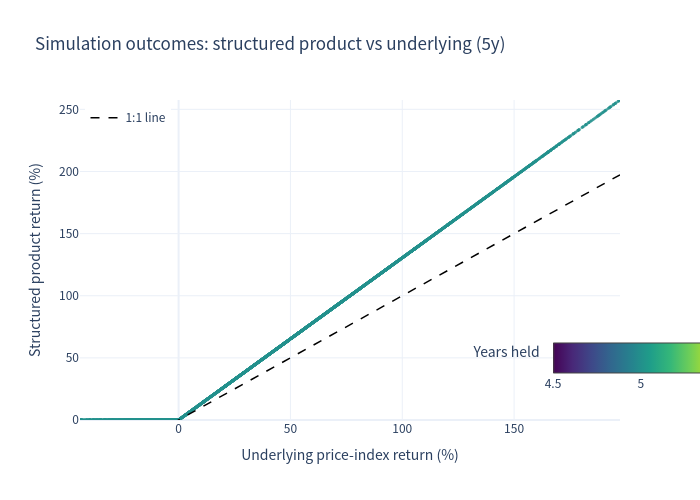
Each point is one simulated 5-year outcome; the x-axis is the underlying price-index return (the value the note references). The dashed 1:1 line marks where note return equals underlying return — points above it benefit from the structure. Outcomes cluster on the 0% floor (par) and fan out above the 1:1 line due to the 130.5% participation.
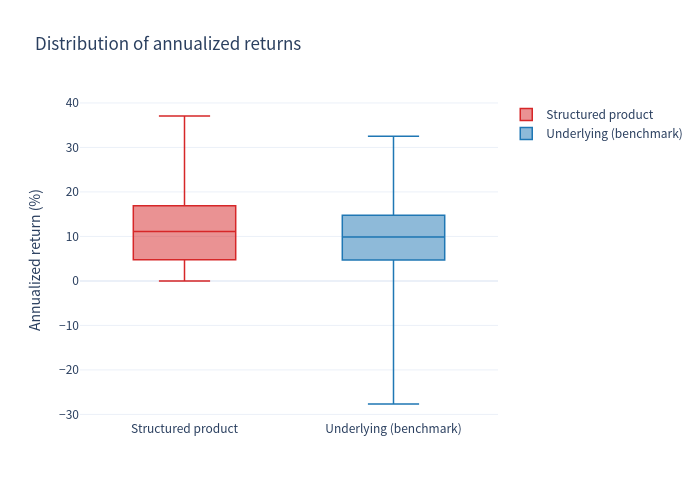
Annualized return distributions
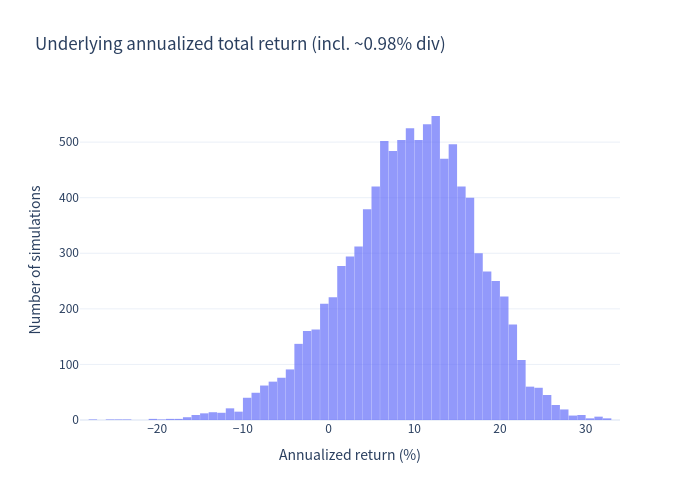
The note's distribution is left-truncated at 0% (principal protection), whereas the underlying benchmark retains a wide left tail of loss outcomes.
Scenario probabilities
Share of simulated paths ending at par, above the 10% annualized return threshold, and outperforming the risk-free rate of 3.73%.
Risk / return profile
Expected annualized return versus volatility for the structured product and the underlying benchmark.
Return distribution comparison
Boxplot comparing the dispersion of annualized returns between the structured product and the underlying benchmark.
Investment Commentary
What the structure offers
- Principal protection at maturity: index declines (even severe ones) do not reduce the amount repaid — par is returned in every downside scenario. This is the core attraction versus direct equity investment.
- Uncapped, leveraged upside: 130.5% participation on any positive index gain, with no upside cap.
- Broad market exposure with simple terms: single U.S. large-cap index, USD-denominated, no autocall/barrier complexity, no quanto/FX features.
Points to keep in mind
- The note pays no interest or dividends; a direct S&P 500 investment (e.g., an ETF) would additionally provide roughly 1% per year of income, which the note forgoes.
- The reference index is a futures excess-return index; its realized performance can differ from the S&P 500 spot index because futures roll and cash-financing mechanics are embedded in the index.
- All payments are subject to Morgan Stanley credit risk, and the initial estimated value ($965.60) is below the $1,000 issue price, reflecting structuring and distribution costs.
- The participation rate is set at pricing within 130.50%–134.50%; the lower bound is assumed throughout.