
Morgan Stanley Worst-of RTY & SPX Trigger PLUS due June 3, 2030
Headline Simulation Results
Note on return metrics: the expected annualized return (mean of the per-path annualized returns) and the expected total return (mean of the per-path 4-year total returns) are not directly convertible to each other, because each simulated path compounds at its own path-specific rate. All paths are held the full 48 months, so no short-horizon distortions are present.
Product Overview
| Type | Worst-of Trigger PLUS (no coupons, no early redemption) |
|---|---|
| Underlyings | Russell 2000 Index (RTY) and S&P 500 Index (SPX) |
| Term | ~4 years (Pricing May 29, 2026; Observation May 29, 2030; Maturity June 3, 2030) |
| Coupon | None |
| Upside | Leveraged participation at 147% (range 147%–157%), uncapped |
| Downside protection | 25% buffer: par if worst index declines ≤ 25% at maturity |
| Principal at risk | Below -25% on the worst performer (1:1 loss participation) |
How it works (layman's terms)
At maturity the payoff depends only on the worst performing of the two U.S. equity indices on the observation date:
- If the worst index is up (above its starting level), you receive your principal plus 147% of that gain — with no cap on the upside.
- If the worst index is down by up to 25%, you simply get your money back (a 25% buffer absorbs the decline).
- If the worst index is down by more than 25%, you lose about 1% of principal for every 1% decline of the worst index.
The security pays no interest during its life and all outcomes are determined by the two index levels on a single observation date.
Key Statistics — Structured Product vs Underlying Benchmark
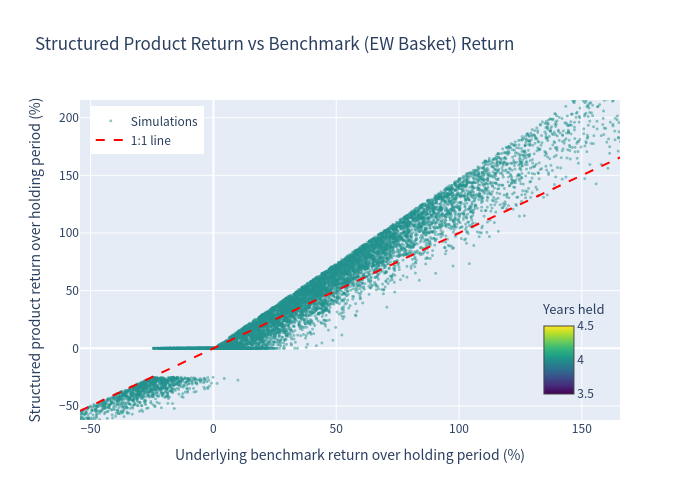
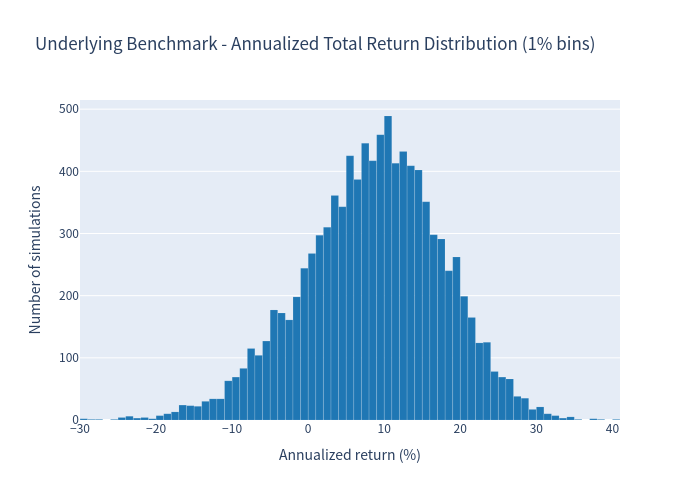
The underlying benchmark is an equal-weight basket of RTY and SPX (not the worst-of leg), measured on a total-return basis (price change plus ~0.94% average dividend yield).
| Metric | Structured Product | Underlying Benchmark (total return) |
|---|---|---|
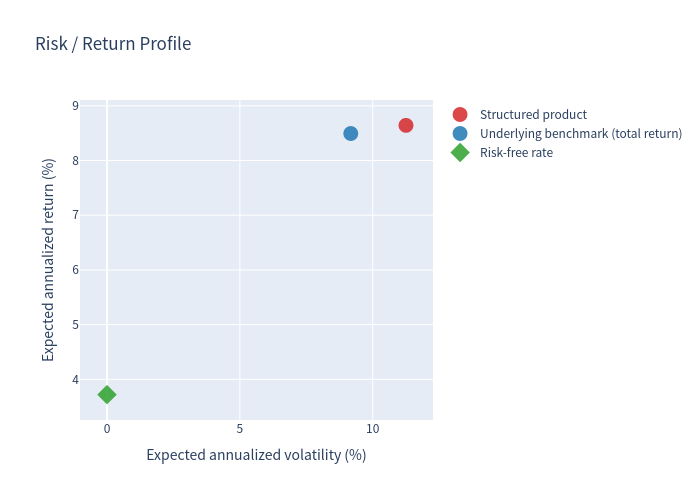
| Expected annualized return | 8.64% | 8.49% |
| Expected annualized volatility | 11.25% | 9.17% |
| Probability of loss | 10.51% | 17.31% |
| 99% confidence VaR (1 year) | -18.95% | -15.01% |
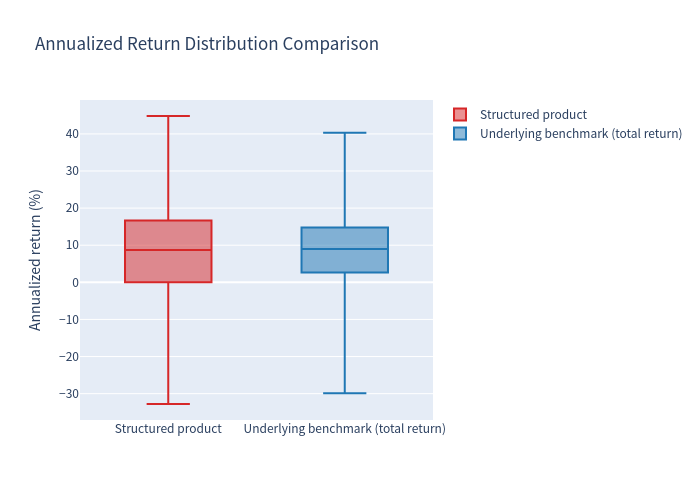
| Median annualized return | 8.75% | 9.02% |
| Expected total return over 4 years | 48.21% | 43.34% |
Charts
Product vs Benchmark Returns — Scatter
Simulated product return vs equal-weight benchmark return over the 4-year holding period (1st–99th percentile range shown, with 1:1 line).
Underlying Benchmark Returns — Histogram
Distribution of the underlying benchmark's simulated annualized total returns (1% bins).
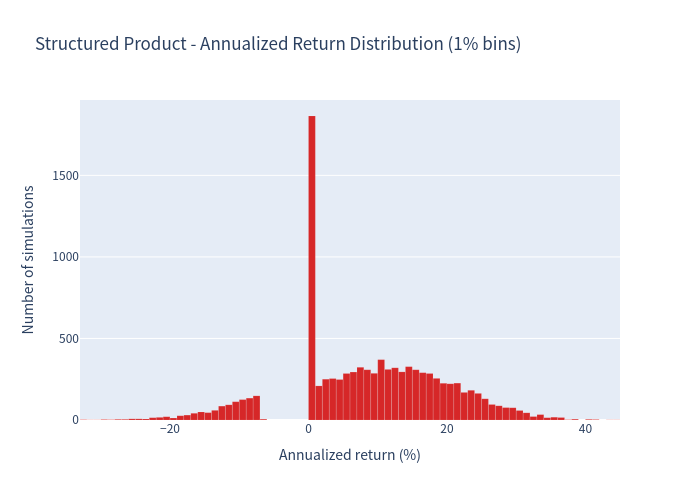
Structured Product Returns — Histogram
Distribution of the structured product's simulated annualized returns (1% bins).
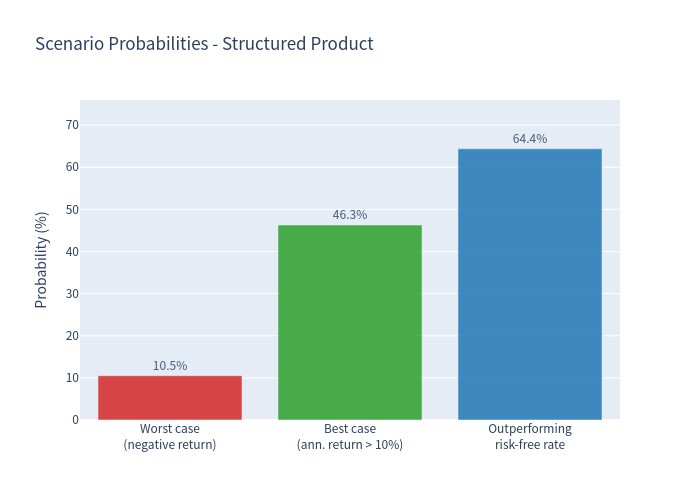
Scenario Probabilities
Probability of a loss, of an annualized return above 10%, and of outperforming the risk-free rate (~3.72%).
Risk-Return Profile
Expected annualized return vs annualized volatility for the structured product, the benchmark and the risk-free rate.
Return Distribution Comparison — Box Plot
Distribution of annualized returns — structured product vs underlying benchmark.
Investment Commentary
Pros
- Leveraged, uncapped upside: 147% participation in the gain of the worst-performing index with no stated cap — the simulated expected annualized return (8.64%) is above the benchmark's (8.49%) while the probability of loss is lower (10.51% vs 17.31%), reflecting the effect of the 25% buffer combined with leverage.
- Meaningful downside buffer: the first 25% decline of the worst index is absorbed (par return), which materially reduces the probability of a negative outcome relative to a direct investment.
- Clean payoff profile: a single, transparent maturity observation with no coupon path-dependency; credit to the issuer is the principal residual risk.
Cons
- Principal is fully at risk if the worst performer falls more than 25%, with 1:1 participation in the decline (worst simulated outcome ≈ -33% annualized).
- Because payoff depends on the worst of two indices, the product is more vulnerable to one weak index than a diversified basket investment.
- No income is paid during the 4-year term; an investor is exposed to the issuer's credit for the entire holding period.
This report is a quantitative simulation analysis only and does not constitute investment advice or a suitability assessment.