Full Analysis Report
9.12% p.a. Multi Barrier Reverse Convertible on Alcon, Roche, Sonova
| Metric | Structured Product | Underlying (Worst-of + Dividends) |
|---|---|---|
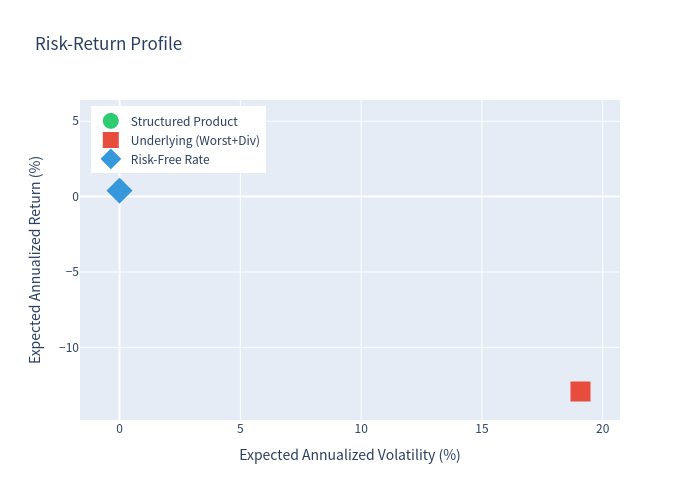
| Expected Annualized Return | 4.52% | -12.93% |
| Expected Annualized Volatility | 1.23% | 19.08% |
| Probability of Negative Return | 0.14% | 75.64% |
| 99% Confidence VaR (1 year) | 4.56% | -63.65% |
total_return × √(12 / months_held). This means that over a full year, the return pattern would approximately scale by the square root of the time ratio. Due to the very short average holding period, the annualized figures should be interpreted alongside the total return and holding period.
Product Overview
| Product | 9.12% p.a. Multi Barrier Reverse Convertible on Alcon, Roche, Sonova |
| ISIN | CH1481478308 |
| SSPA Type | 1230 (Reverse Convertible) |
| Currency | CHF |
| Denomination | CHF 1,000 per product |
| Term | 18 months (May 2026 – November 2027) |
Key Features
| Worst-of Structure | Payoff depends on the worst-performing of the three underlyings |
| Quarterly Coupon | 2.28% per quarter (9.12% p.a.) |
| Issuer Callable | Issuer can redeem early starting from Month 3 |
| Barrier Protection | 41% downside buffer (59% barrier, continuous observation) |
| Upside Capped | Maximum redemption is par (100%) |
How It Works (Layman Explanation)
This is a yield-enhancement product linked to a basket of three Swiss pharmaceutical/healthcare stocks: Alcon, Roche, and Sonova.
- Coupon: The investor receives a fixed quarterly coupon of CHF 22.80 (2.28%) regardless of how the underlyings perform. The annual coupon rate is 9.12%.
- Issuer Call: The issuer has the right to call (redeem early) the product on specific observation dates (starting from month 3). If the issuer decides to call, the investor receives their full investment back plus the coupon for that period, and no further payments are made. The simulation assumes the issuer calls when all three underlyings are above the barrier level (59%).
- Downside Protection (Barrier): A Barrier Level is set at 59% of the initial stock prices. If none of the three stocks ever falls to or below this barrier during the 18-month period, the investor receives their full investment back at maturity.
- Conditional Downside Risk: If any stock does fall to or below the 59% barrier at any time (Barrier Event), the protection is lost. At maturity:
- If the worst-performing stock is at or above its initial level → investor gets full investment back.
- If the worst-performing stock is below its initial level → investor receives physical shares of that stock (or cash equivalent), which may be worth less than the initial investment.
Structured Product
| Expected Annualized Return | 4.52% |
| Median Annualized Return | 4.56% |
| Expected Annualized Volatility | 1.23% |
| Probability of Negative Return | 0.14% |
| 99% VaR (1 year) | 4.56% |
| Expected Total Return (over holding period) | 2.23% |
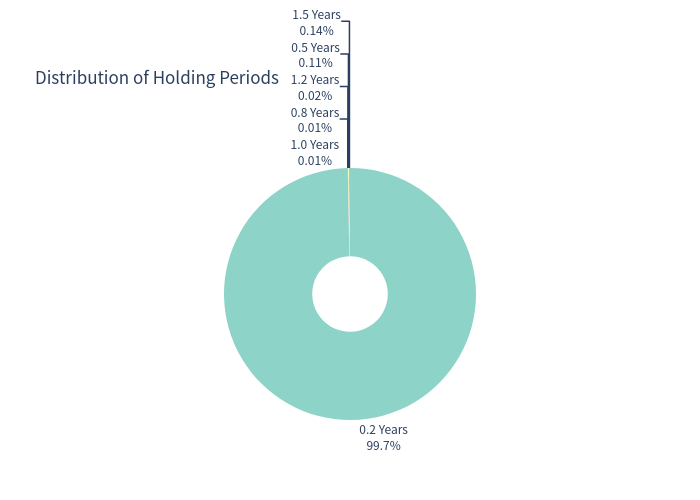
| Expected Holding Period | 0.25 yrs (3.0 months) |
Underlying Assets (Worst-of + Dividends)
| Expected Annualized Return | -12.93% |
| Expected Annualized Volatility | 19.08% |
| Probability of Negative Return | 75.64% |
| 99% VaR (1 year) | -63.65% |
Underlying Assets Information
| Underlying | Yahoo Symbol | Dividend Yield |
|---|---|---|
| Alcon Inc | ALC.SW | 0.56% |
| Roche Holding AG | ROG.SW | 3.03% |
| Sonova Holding AG | SOON.SW | 2.52% |
| Basket Average | 2.04% |
Risk-Free Rate
| Swiss Government Bond Yield (proxy) | 0.40% |
| Benchmark Index | SMI (^SSMI) |
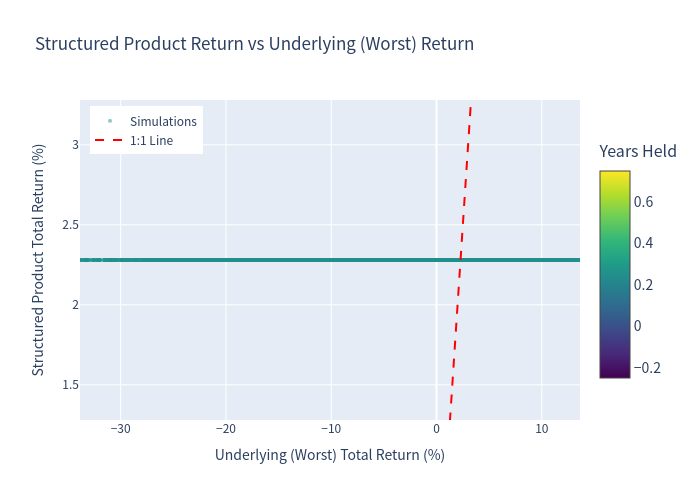
Scatter Plot: Structured Product Total Return vs Underlying (Worst) Total Return
Each point represents one Monte Carlo simulation scenario, illustrating the asymmetric payoff profile of the structured product.
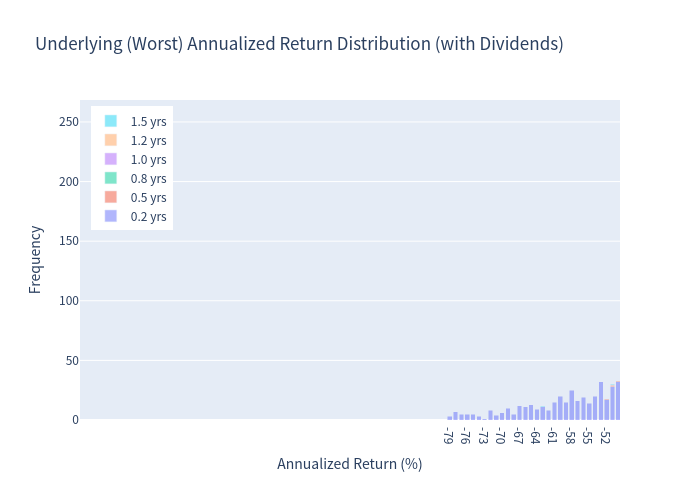
Underlying (Worst) Annualized Return Distribution (with Dividends)
Distribution of annualized returns for the worst-performing underlying asset including reinvested dividends.
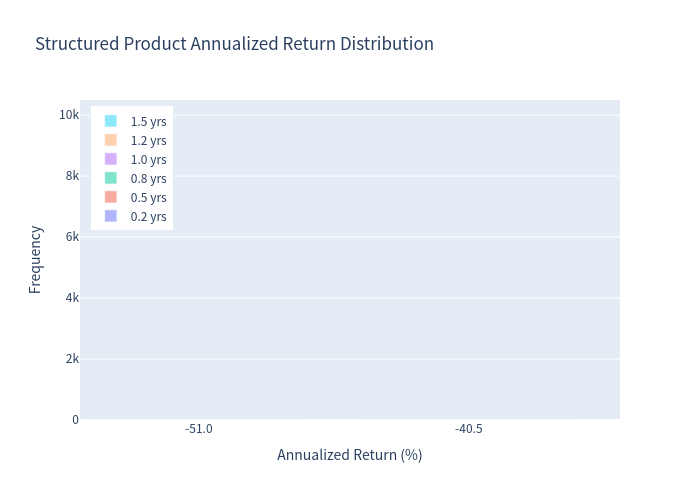
Structured Product Annualized Return Distribution
Distribution of annualized returns for the structured product, showing the highly concentrated positive outcome.
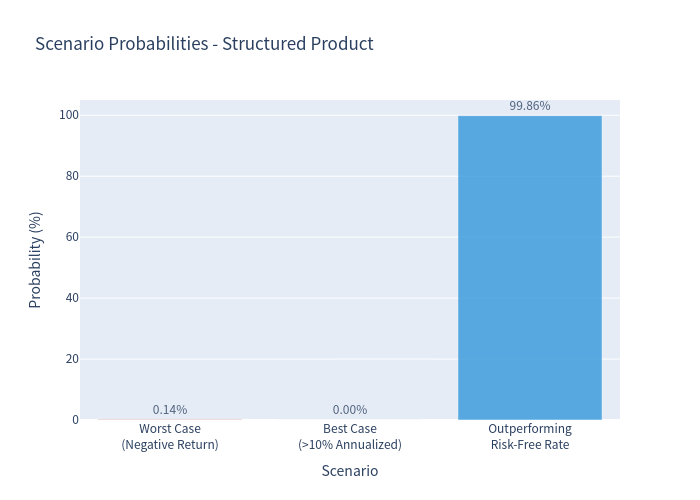
Scenario Probabilities
Breakdown of key scenario outcomes: early call, barrier touched with full repayment, barrier touched with loss, etc.
Risk-Return Profile
A visual comparison of the expected annualized return versus volatility for both the structured product and the underlying basket.
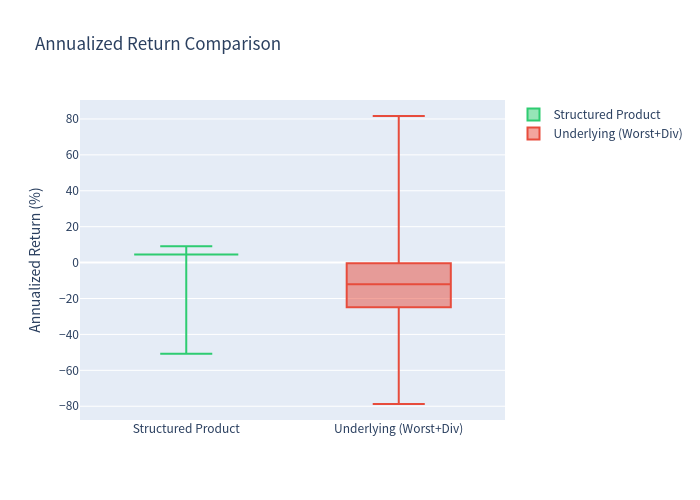
Box Plot Comparison
Side-by-side box plots comparing the distribution of returns for the structured product and the underlying basket.
Holding Period Distribution
Distribution of how long the product is held before being called or reaching maturity.
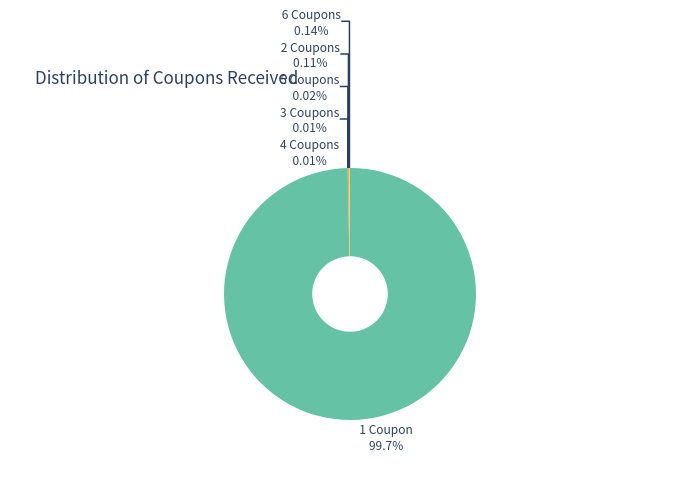
Coupons Received Distribution
Distribution of the number of coupon payments received across all simulated scenarios.
Pros
- Attractive coupon yield: The 9.12% p.a. coupon significantly exceeds the current risk-free rate of approximately 0.40%, offering a substantial yield enhancement.
- High probability of early call: In 99.86% of scenarios, the issuer calls the product at the first opportunity (Month 3), resulting in a realized total return of 2.28% over just 3 months.
- Very low probability of loss: Only 0.14% of simulations resulted in a negative annualized return.
- Substantial barrier protection: The 59% barrier provides significant downside cushion (over 41% decline required to lose protection).
- Unconditional coupons: Coupons are paid regardless of underlying performance or barrier events, and are also paid on early redemption dates.
Cons
- Worst-of structure: The final payoff depends on the worst-performing stock, which amplifies downside risk if any one stock performs poorly.
- Upside capped: Even if all underlyings perform strongly, the investor receives par plus fixed coupons — no participation in upside market gains.
- Issuer call risk: The issuer can call the product early (and is likely to do so), limiting the total number of coupon payments the investor receives.
- Physical delivery risk: If a barrier event occurs and the worst-performing stock is below its initial level at maturity, the investor receives shares worth less than the initial investment.
- Short holding period: The high probability of early call means the product is likely held for only 3 months, potentially requiring frequent reinvestment.
- Credit risk: The product depends on the creditworthiness of the Issuer (Swissquote Bank SA).