
Morgan Stanley — Worst-of INDU, NDXT & RTY Callable Contingent Income Securities due February 3, 2028
1. Headline Simulation Results
Based on 10,000 Monte-Carlo simulations of the three indices over the term (dividends are excluded from the product payoff, as payouts reference the price indices):
| Headline metric | Result |
|---|---|
| Expected annualized return | 9.30% |
| Probability of a negative return | 8.26% |
| 99% confidence 1-year VaR | −29.94% |
| Expected total return over the realized holding period | 6.33% |
| Expected holding period | ≈ 1.0 year (12.0 months) |
| Probability the note is called early | 76.6% |
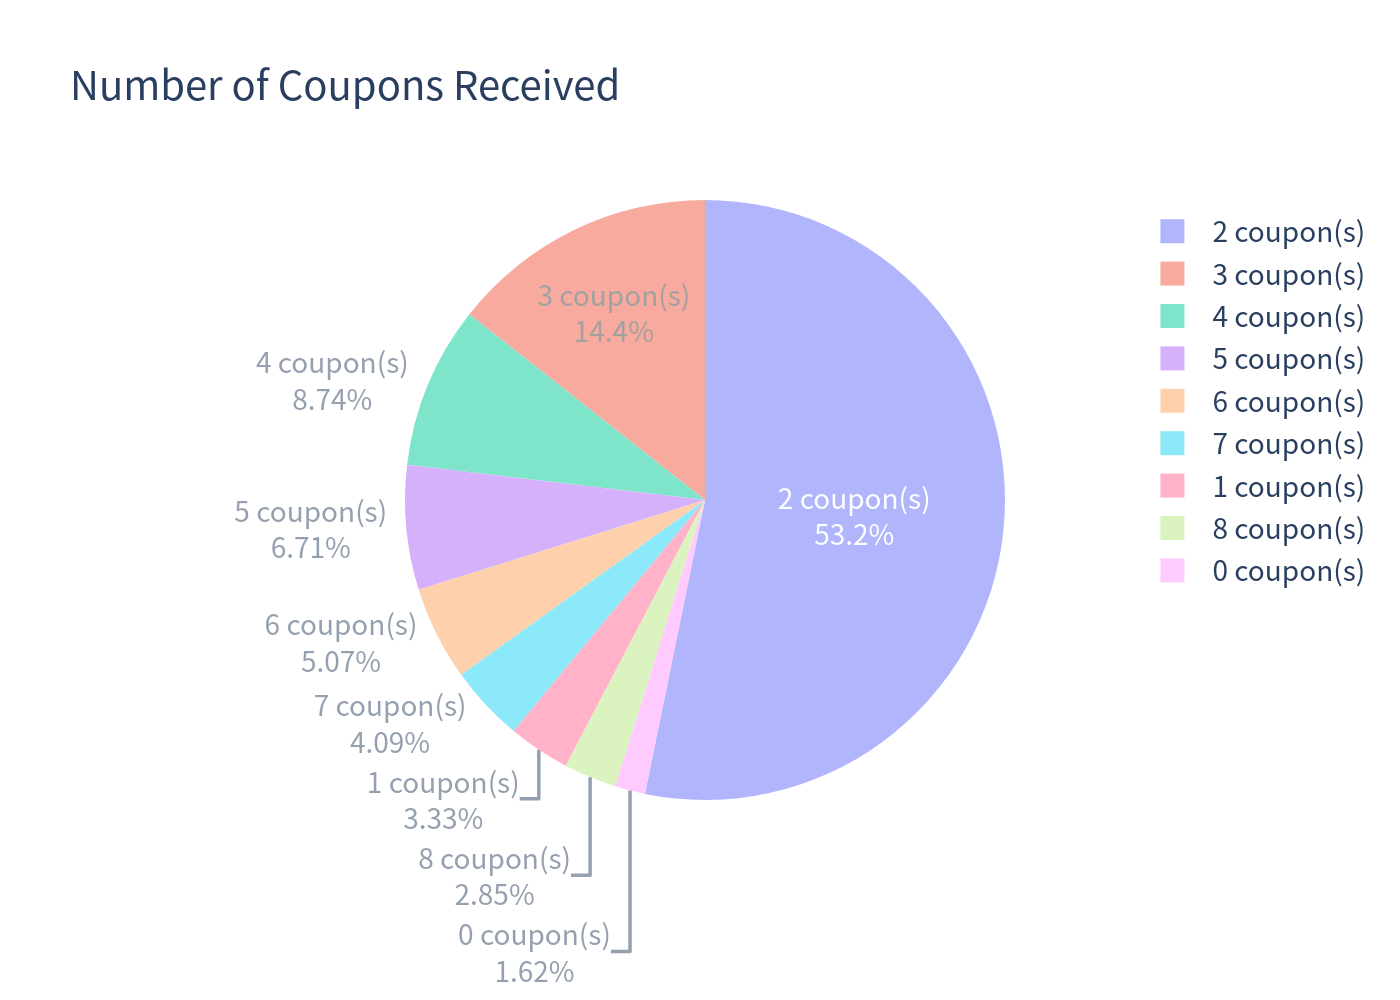
| Probability of receiving no coupon at all | 1.62% |
| Probability of avoiding any capital loss | 91.74% |
2. Product Overview
What it is: A roughly 2-year note whose coupons and final redemption depend on the worst-performing of three equity indices (INDU, NDXT, RTY).
How it works — in plain terms:
- Contingent quarterly coupon (12–14% p.a., base case 13% ≈ 3.25% per quarter): On each quarterly observation date the note checks all three indices. If the worst index is at or above 80% of its starting level, you are paid a coupon for that quarter. If it is below 80%, you receive nothing that quarter (coupons are not "remembered" or made up later).
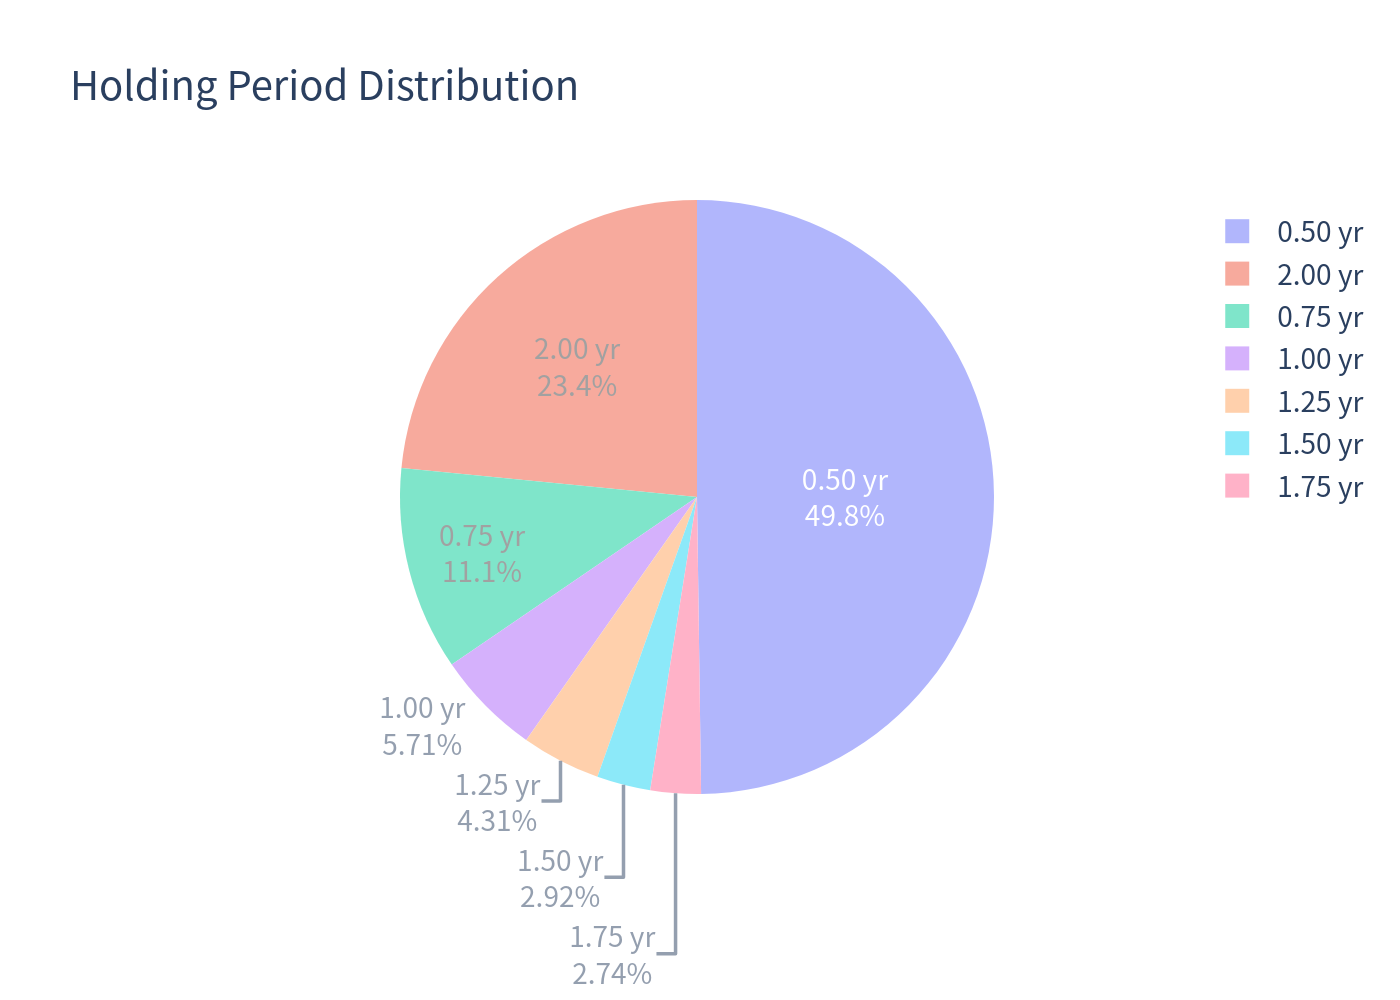
- Early redemption (call): The note is callable by the issuer on a quarterly basis, beginning after 6 months. If it is called, you receive par ($1,000) plus the coupon then due, and the investment ends early. In simulation the note is called in ~77% of scenarios, most often at the first call date (6 months).
- Downside threshold / principal protection (70%): At maturity, if the worst index is at or above 70% of its start, you get your full $1,000 back (plus the final coupon if the 80% barrier was met). If the worst index finishes below 70%, you lose 1% of principal for every 1% the worst index is below its start — i.e. a −40% worst-index move means a −40% loss ($600 back), and −100% means a total loss.
- Capped upside: You never receive more than par plus coupons, regardless of how far the indices rise.
3. Key Statistics (Structured Product vs. Benchmark)
The benchmark is an equal-weighted basket of the three indices (the product's payoff depends on the worst of the three, so a diversified equal-weight basket is the natural comparison). Dividends are excluded from the product payoff and added to the basket for the total-return comparison.
| Metric | Structured Product | Basket (price only) | Basket (total return, +~0.89% div) |
|---|---|---|---|
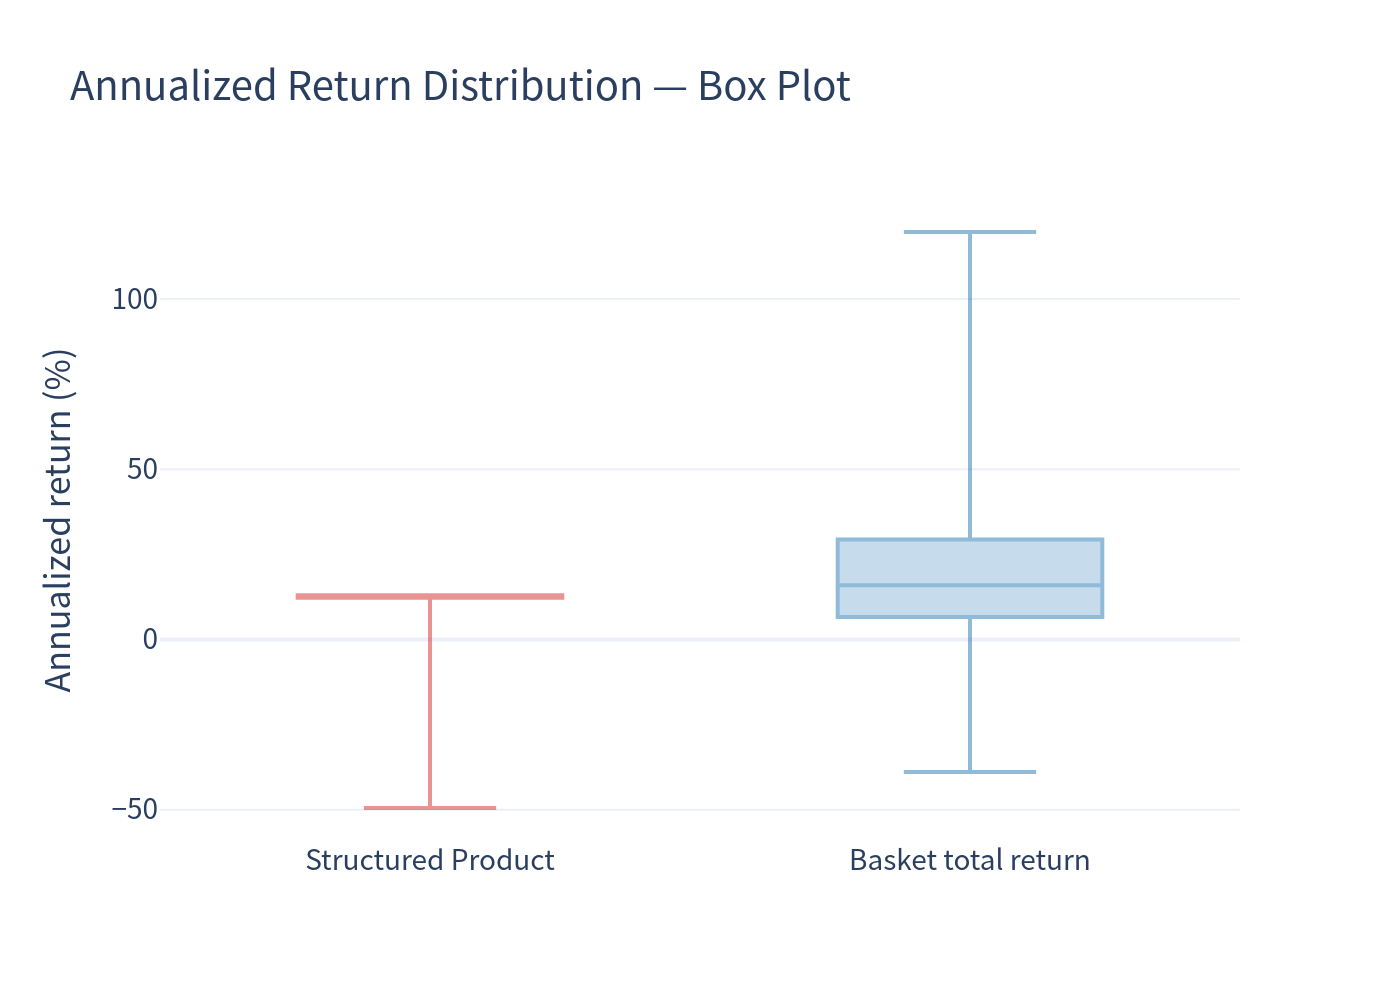
| Expected annualized return | 9.30% | 17.54% | 18.43% |
| Expected annualized volatility | 9.45% | 19.67% | 19.67% |
| Probability of loss | 8.26% | 16.23% | 15.49% |
| 99% confidence VaR (1 year) | −29.94% | −22.70% | −21.81% |
Scenario probabilities (structured product)
| Scenario | Probability |
|---|---|
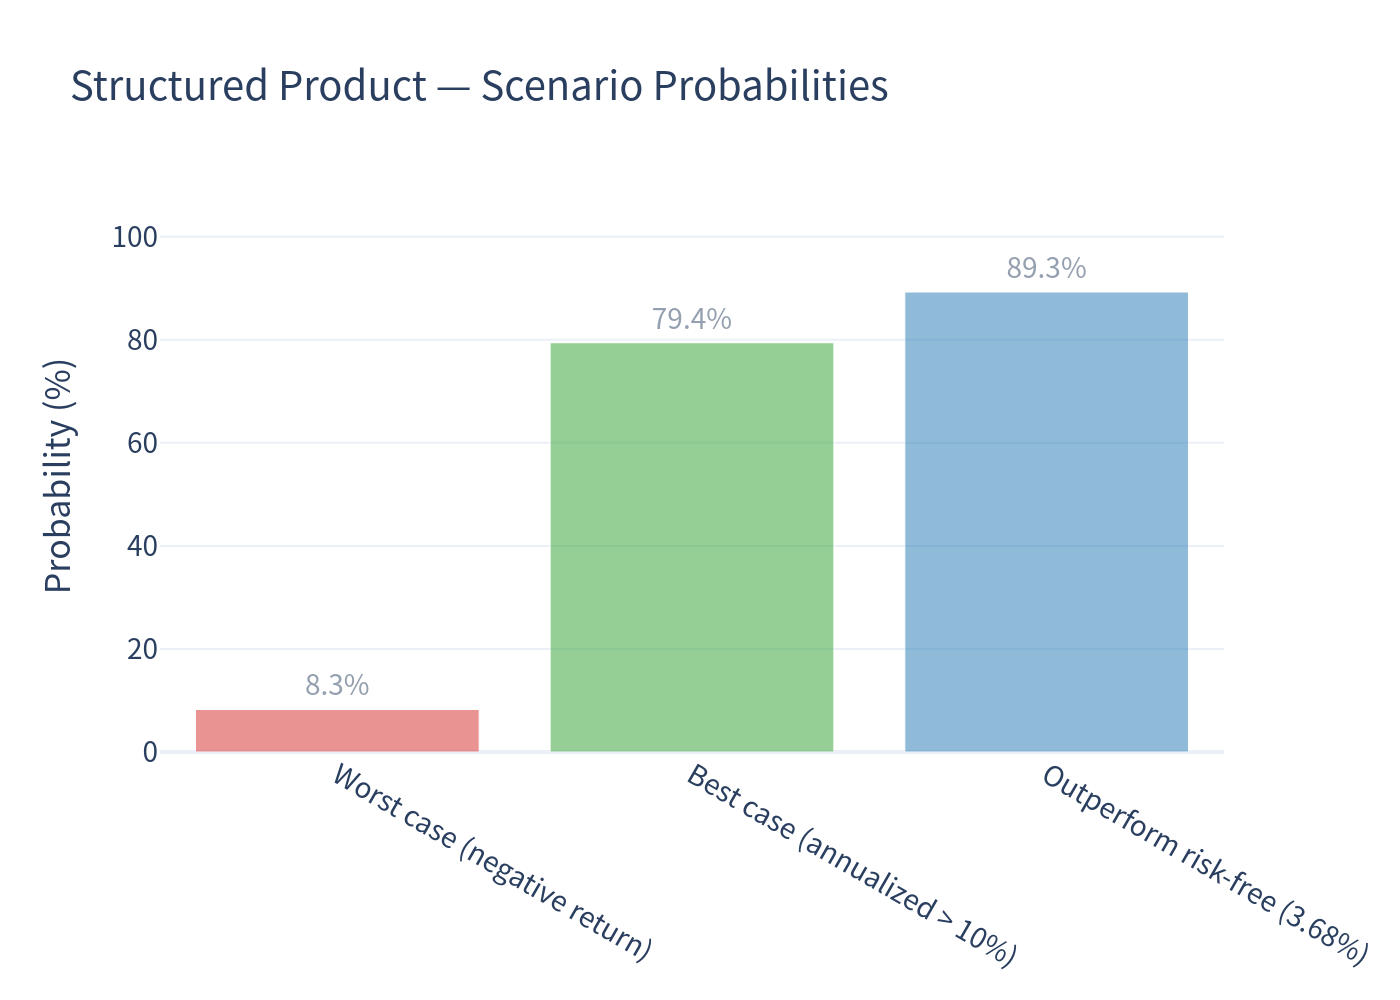
| Negative return (worst case) | 8.26% |
| Strong outcome (annualized return > 10%) | 79.42% |
| Beats the risk-free rate (3.68%) | 89.27% |
| Loss of 30% or more of invested capital (total value returned ≤ 70) | 5.26% |
4. Charts
4.1 Per-simulation outcomes (product vs. basket)
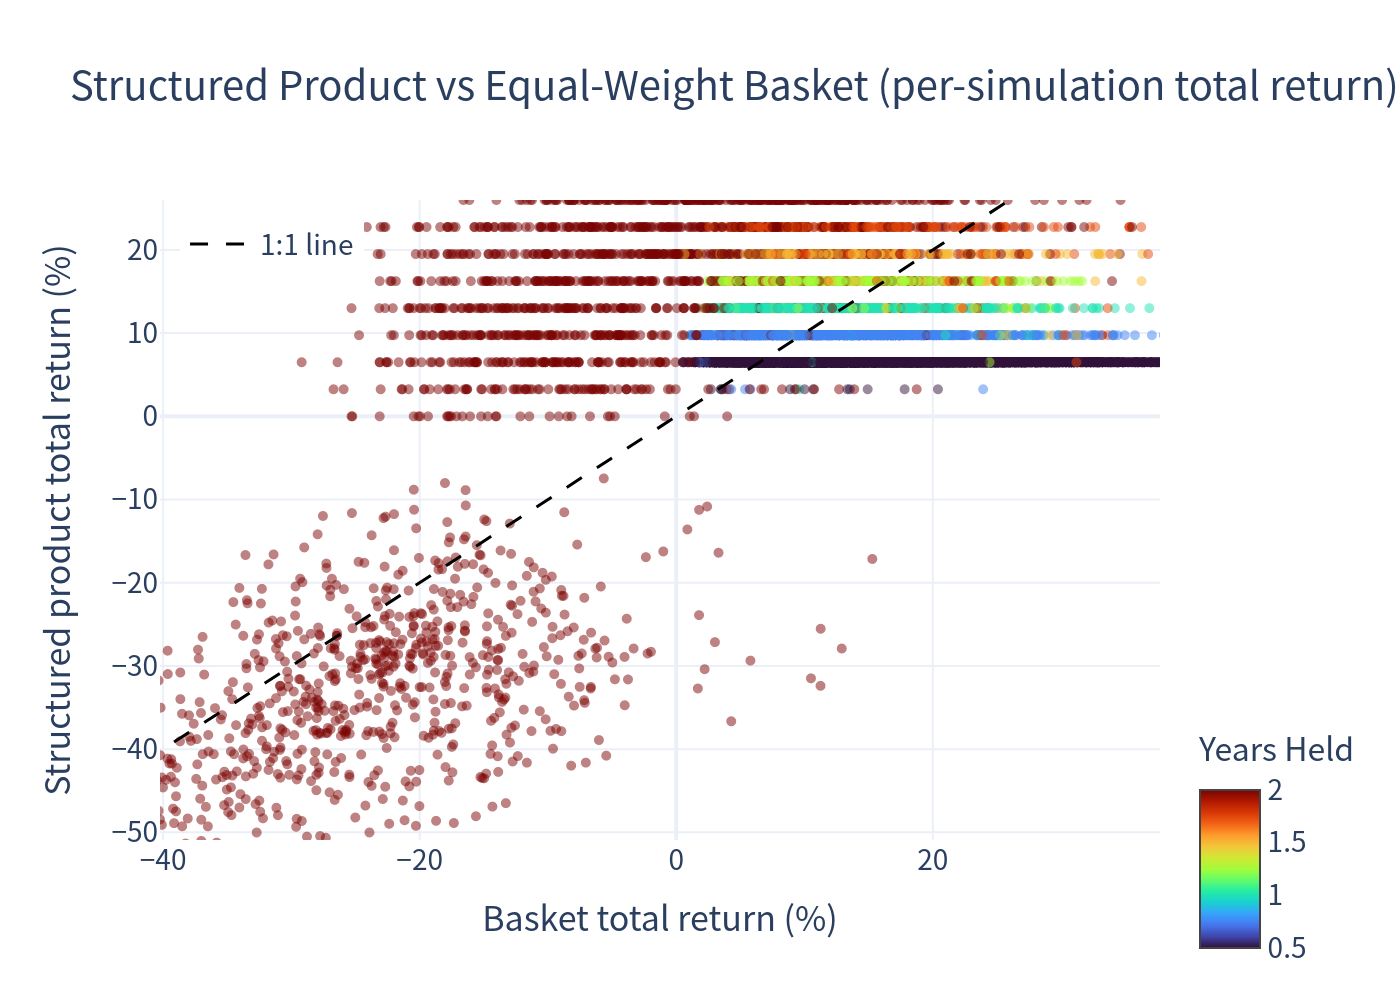
Most outcomes cluster in the upper-left region: the note delivers a moderate positive return even when the basket is flat, but its return is capped (the shaded band of calls) so it fails to capture large basket rallies.
4.2 Annualized-return distributions
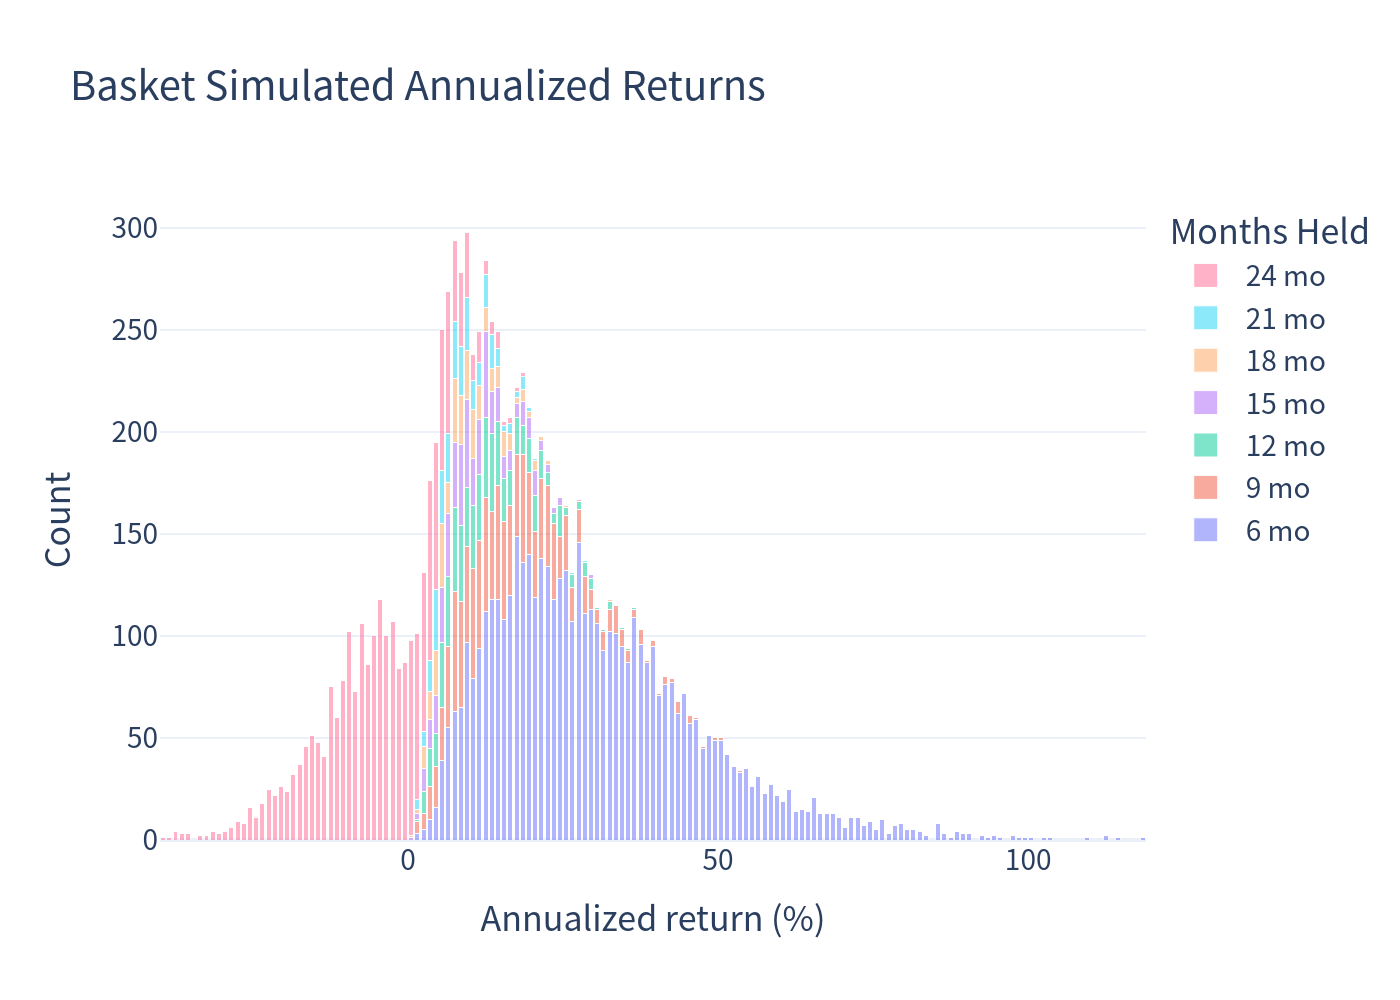
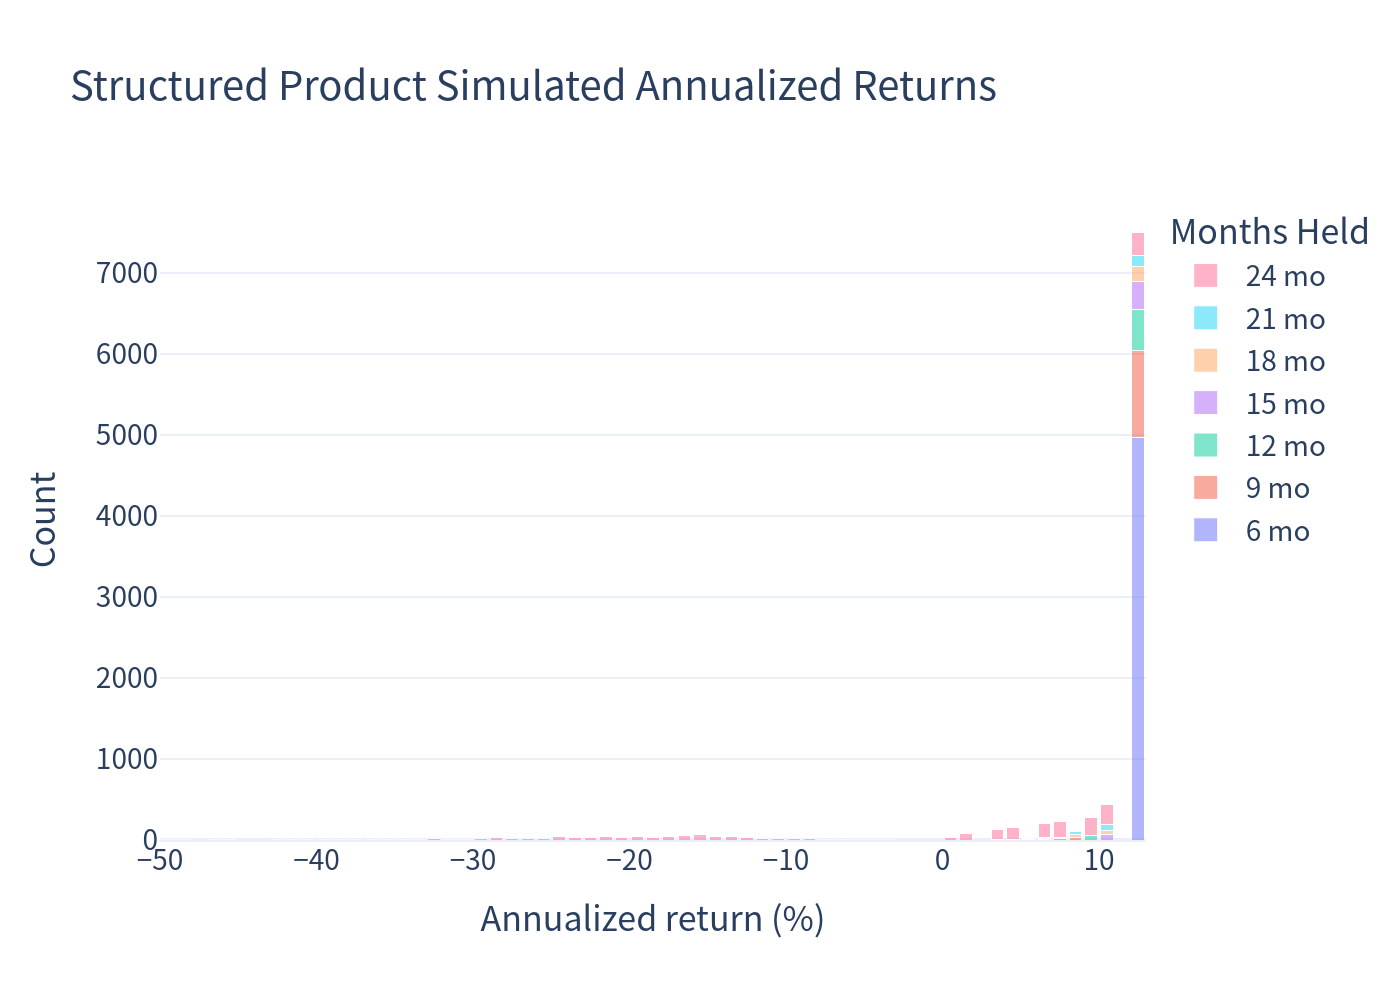
The product's distribution is tightly concentrated (a large spike at ~13% annualized, corresponding to the many 6-month calls), with a long left tail from deep market drawdowns. The basket's distribution is far wider, with a heavy right tail that the capped product gives up.
4.3 Risk / return comparison
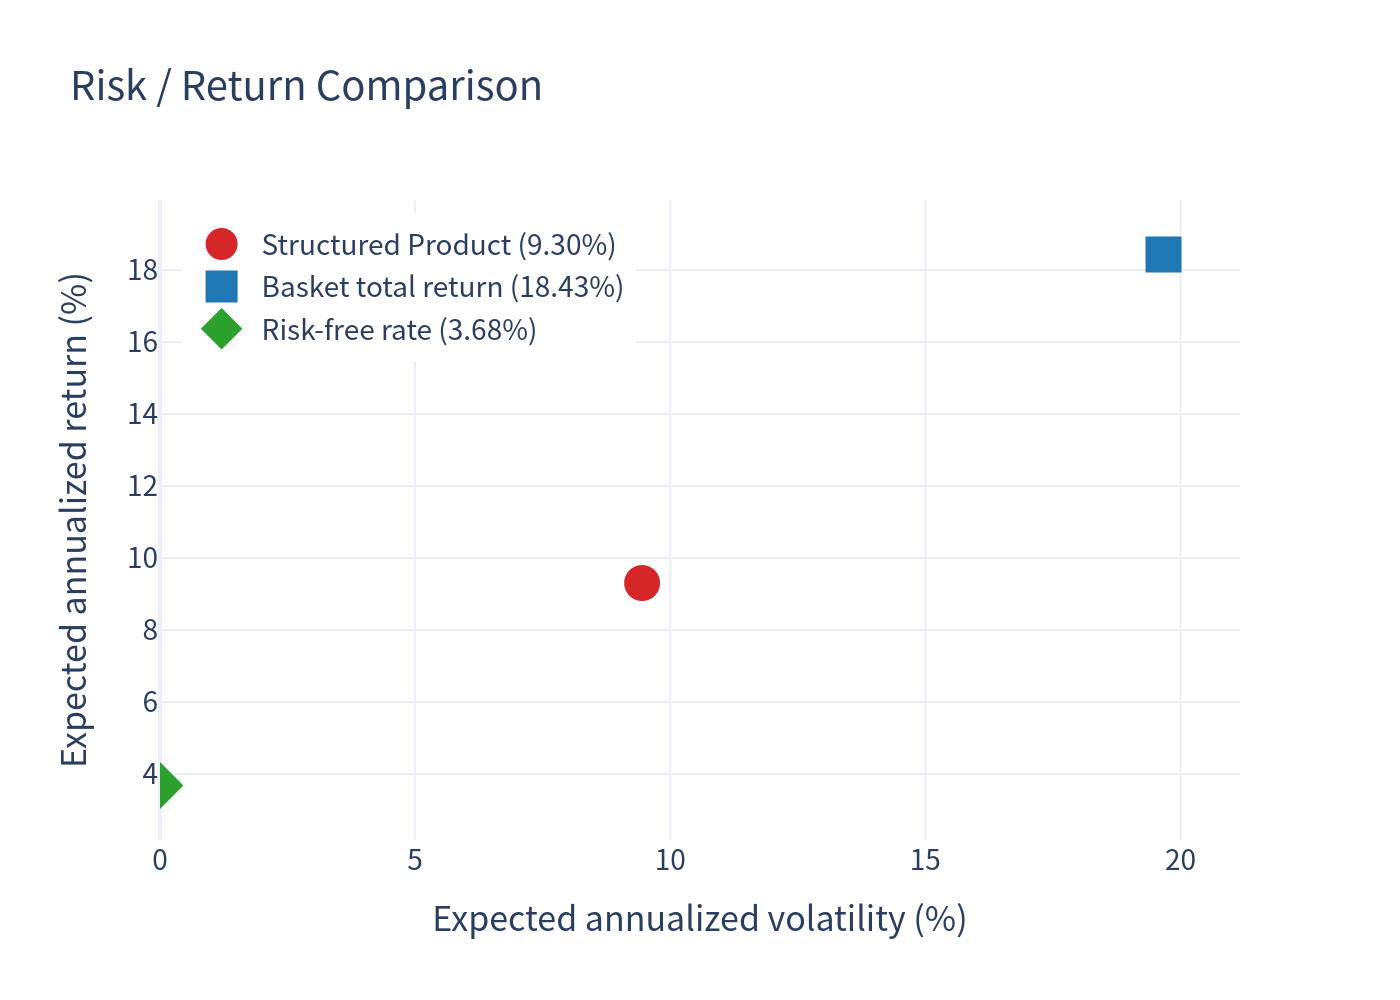
The note sits well inside the risk/return frontier relative to the basket: lower expected return, but roughly half the volatility, and above the risk-free rate.
4.4 Box plot of annualized returns
4.5 Holding-period and coupon distributions
4.6 Scenario probabilities
5. Investment Commentary
Strengths
- High headline income: a 12–14% p.a. contingent coupon is attractive relative to cash rates (~3.7%) — the coupon barrier (80%) is set below par, so coupons continue to be paid even in mild market declines.
- Meaningful downside buffer to 70%: principal is protected unless the worst index falls more than 30% from its start; simulation shows ~92% of paths avoid any capital loss at all.
- Low realized risk / short expected life: the callable structure keeps the expected holding period near one year and roughly halves the volatility of the underlying basket (9.45% vs 19.67%), giving a high probability of outperforming cash (89.27%).
Considerations
- Worst-of leverage to the weakest market: tying the payoff to the worst of three indices (large-cap, tech, and small-cap) increases the chance that a single weak sector drags the whole note down. NDXT (tech) and RTY (small-cap) are the higher-volatility legs.
- Upside is capped while downside is not (below 70%): in strong rallies the note is called at par + coupon and the investor gives up the remaining upside; in severe sell-offs the loss is 1-for-1 down to −100%.
- Callable feature reduces expected return: the ~77% early-call rate truncates the income stream right when markets are performing well, so the expected annualized return (9.30%) is below the coupon rate.
- Product-level frictions: the estimated value ($972.70 per $1,000) is below issue price, and the note is unlisted — secondary liquidity is limited and the note is subject to the issuer's credit risk.