
8.40% p.a. Multi Barrier Reverse Convertible on Novartis, Roche, Swiss Life, Swiss Re
Headline Results
The product pays a fixed 8.40% p.a. coupon (2.10% quarterly) regardless of underlying performance, but it is issuer-callable and its maturity redemption depends on the worst-performing of the four Swiss equities if a 59% barrier is breached.
How the Product Works (Layman Terms)
- The investor receives a fixed quarterly coupon (2.10% of notional per quarter, i.e. 8.40% p.a.) for up to 2 years, no matter what the four underlying stocks do.
- The issuer may call (early-redeem) the product at par plus the then-due coupon on quarterly observation dates starting after 1 year. Once called, no further coupons are paid.
- At maturity (2 years):
- If no underlying has ever traded at or below 59% of its initial level (the barrier), the investor gets 100% of capital back.
- If the barrier was breached (at least one underlying traded at or below 59%) and the worst-performing underlying finishes below its initial level (100%), the investor receives physical delivery of that stock (a capital loss equal to that stock's decline below 100%).
- Otherwise (barrier breached but the worst stock still ends at or above 100%), the investor gets 100% of capital back.
- The upside is capped at the coupon stream; there is no participation in stock price gains.
Key Statistics (Monte Carlo simulation, 10,000 paths)
| Metric | Structured Product | Underlying Basket (price) | Underlying Basket (incl. dividends) |
|---|---|---|---|
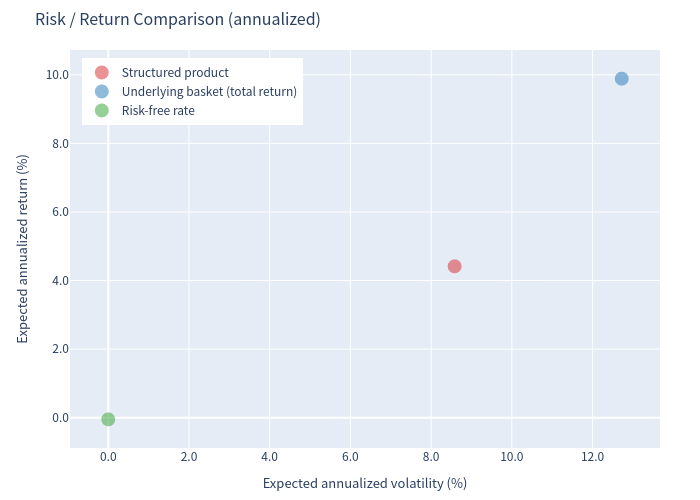
| Expected annualized return | 4.41% | 8.16% | 9.89% |
| Expected annualized volatility | 8.58% | 12.72% | 12.72% |
| Probability of loss | 17.50% | 27.97% | 23.10% |
| 99% confidence VaR (1 year) | -24.27% | -17.03% | -15.30% |
- The benchmark is an equal-weight basket of the four underlyings (Novartis, Roche, Swiss Life, Swiss Re).
- The product offers lower volatility and a lower probability of loss than the equity basket, but its expected return is lower because the upside is capped and the issuer can call the product early.
- The worst tail is more severe for the product (VaR -24.27%) because losses concentrate in scenarios where the worst-performing stock is delivered physically.
Holding-Period and Coupon Outcomes
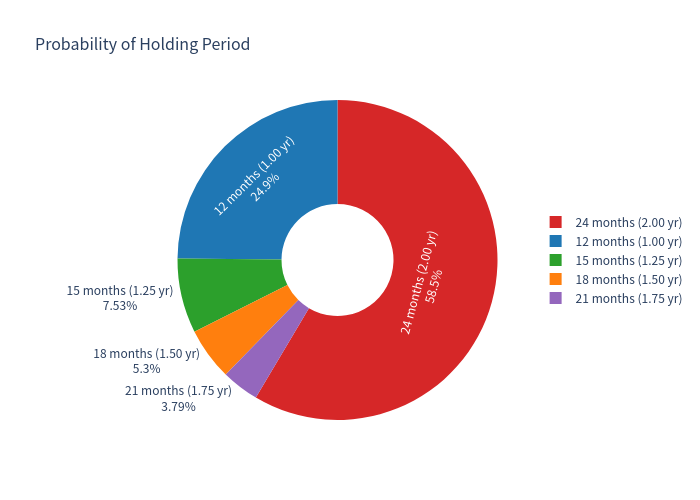
- Issuer call (early redemption): 41.48% of simulations — product ends after 12, 15, 18 or 21 months.
- Held to maturity (24 months): 58.52% of simulations.
- Barrier breached: 18.30% of simulations; physical delivery of the worst stock occurs in 18.18% of simulations.
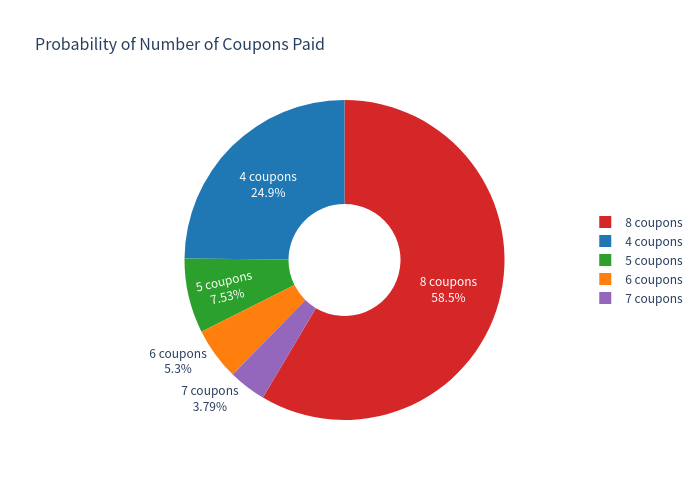
- Coupons received: 4 to 8 coupons (8.40 to 16.80 index points of coupons on a 100 notional). Expected coupon total ≈ 13.94 index points (mean 6.64 coupons).
Charts
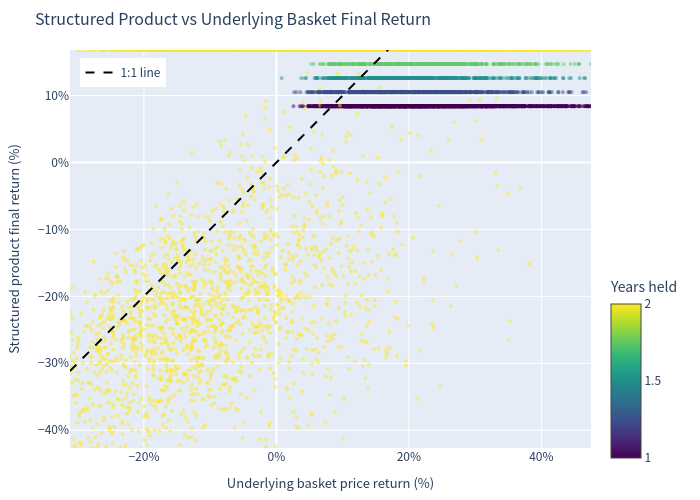
Scatter: Product vs Underlying
Annualized returns of the structured product plotted against the underlying basket across simulated paths.
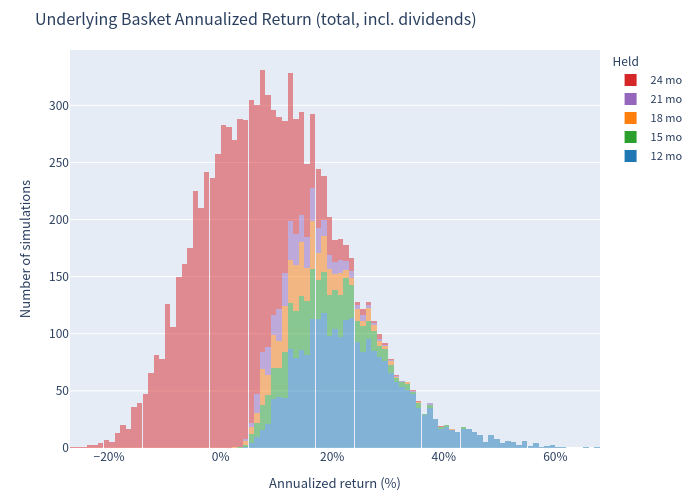
Underlying Annualized Return Histogram
Distribution of annualized returns for the equal-weight underlying basket.
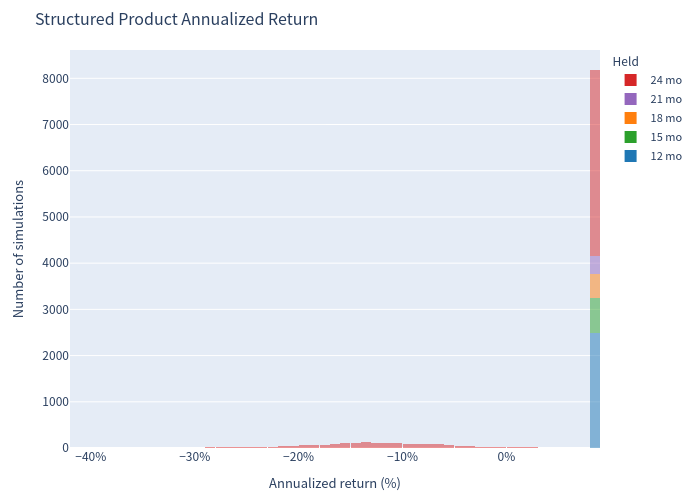
Product Annualized Return Histogram
Distribution of annualized returns for the structured product, highlighting the capped upside and left tail.
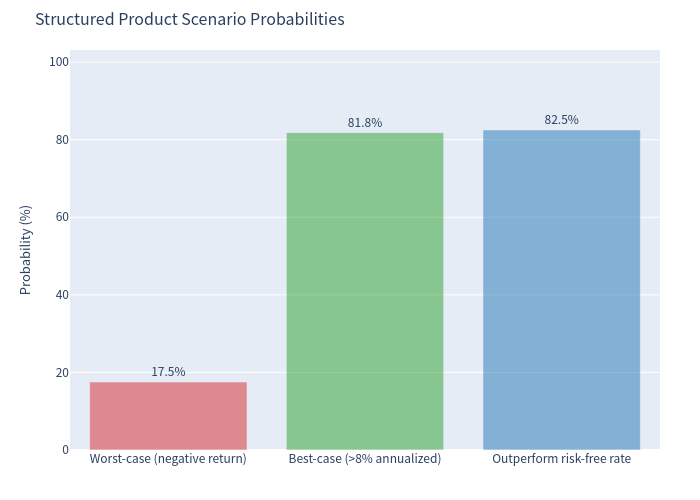
Scenario Probabilities
Share of simulations in each outcome: issuer call, held to maturity, barrier breach, and physical delivery.
Risk/Return Comparison
Risk-return positioning of the structured product relative to the underlying basket benchmarks.
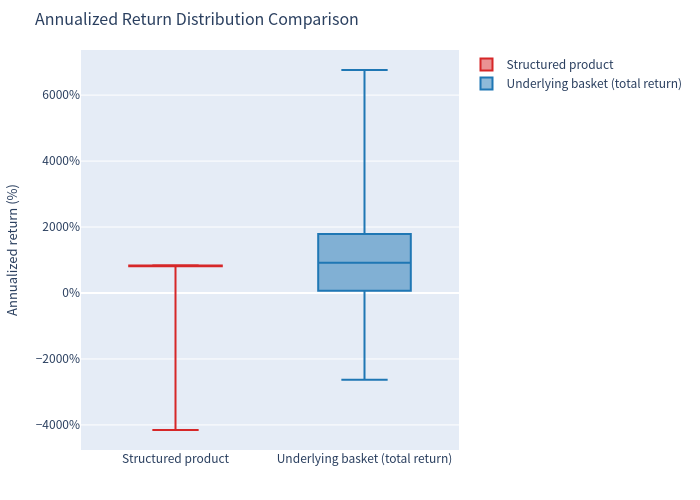
Box Plot Comparison
Distribution of annualized returns for the structured product versus the underlying basket.
Holding Period Distribution
Distribution of simulated holding periods, including early redemption by the issuer and maturity.
Coupon Count Distribution
Distribution of the number of coupons received across simulated paths.
Investment Commentary
Key observations:
- The coupon is attractive relative to the (near-zero) Swiss risk-free rate: the product beats the risk-free rate in 82.50% of simulations.
- In roughly 82% of simulations the product achieves close to its maximum annualized return (~8.1%–8.4%), as coupons are received in full and capital is returned at par.
- The conditional downside protection (59% barrier) is meaningful: a capital loss only occurs if at least one underlying trades at or below 59% of its initial level at some point during the term and the worst-performing underlying at maturity ends below its initial level. (The stock that breaches the barrier and the stock delivered at maturity need not be the same.)
- The main trade-off vs. holding the stocks directly: the product gives up upside participation (capped at the coupon) and suffers a worse tail (worst-of delivery, VaR -24.27%) in exchange for a high, regular income stream and lower day-to-day volatility.
- Note on assumptions: because the early-redemption feature is an issuer call right (not an automatic autocall), the analysis assumes the issuer calls when all four underlyings are at or above their initial levels on an observation date (i.e., when its embedded put is out of the money). A more aggressive call policy would reduce the number of coupons received.
This document is an analysis of the product's risk/return profile and does not constitute investment advice.