
9.00% p.a. Multi Barrier Reverse Convertible (Callable) — Investment Analysis
Headline Simulation Results (10,000 Monte-Carlo paths)
| Metric | Result |
|---|---|
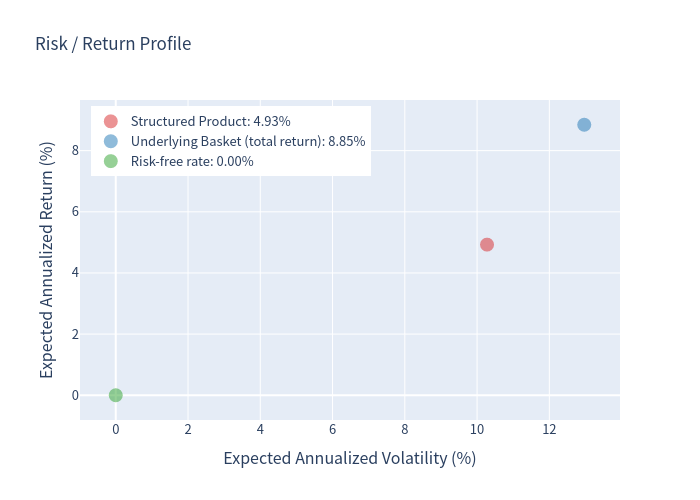
| Expected annualized return | 4.93% |
| Median annualized return | 8.81% |
| Expected annualized volatility | 10.28% |
| Probability of a negative return | 13.82% |
| 99% confidence VaR (1 year) | -31.81% |
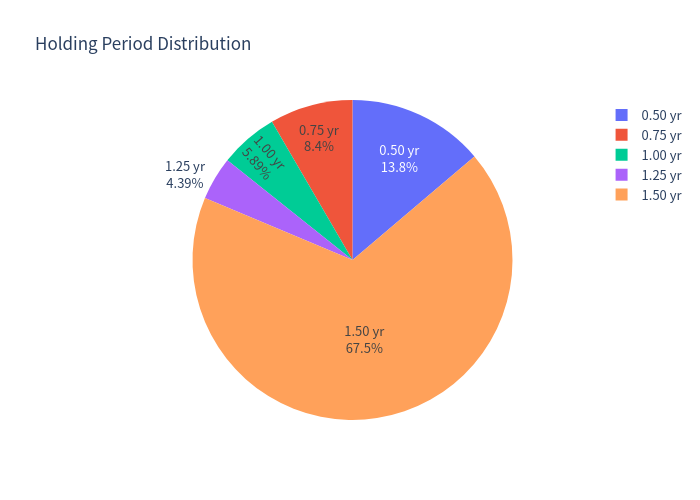
| Expected holding period | 1.26 years (~15 months) |
| Expected total return over the (variable) holding period | 5.62% |
| Probability of early redemption (issuer call) | 32.5% |
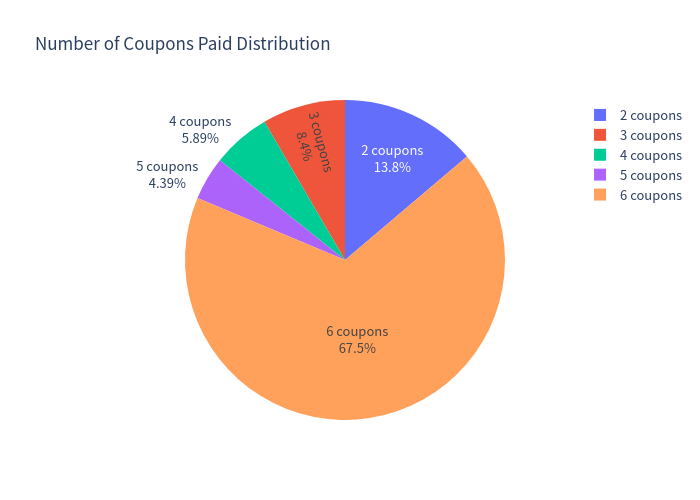
| Average number of coupons received | 5.03 of 6 |
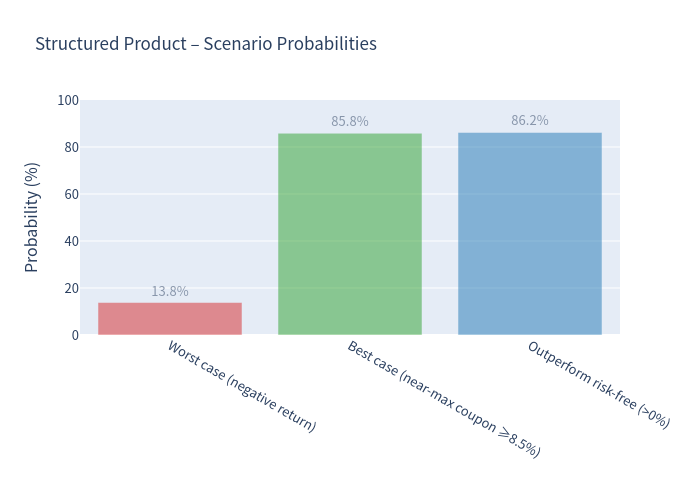
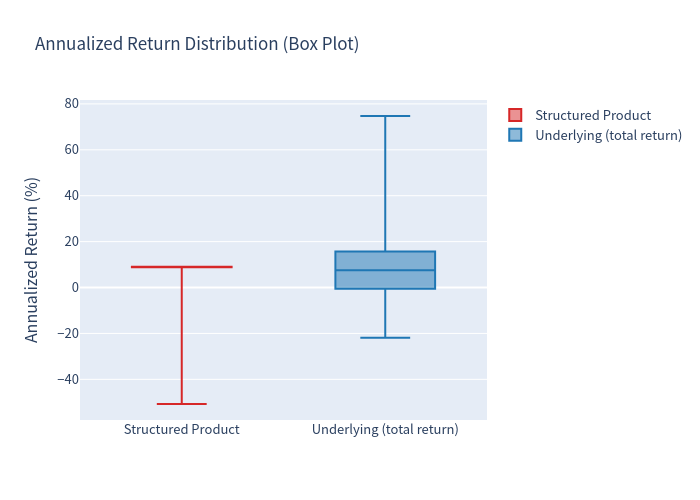
The product pays a fixed 9.00% p.a. coupon (CHF 22.50 per quarter per CHF 1,000) regardless of underlying performance, and returns par if the 59% barrier holds. In the majority of paths the investor earns a steady coupon-like return: the median outcome is 8.81% p.a. and 86.2% of paths deliver a positive annualized return. However, the average is pulled well below the median by a fat left tail: whenever the barrier is breached and the worst-of finishes below its strike, capital is delivered in the weakest stock at a loss. This produces a 13.82% probability of a negative return and a 99% VaR of -31.81% — materially worse than simply holding the underlying basket (-14.04%).
Basic Product Info & How It Works (Plain Language)
- The notes pay a 9% annual coupon in four quarterly instalments and aim to give back the CHF 1,000 (par) at maturity.
- Downside protection is conditional: each of the three shares has a 59% barrier (i.e. −41% from its start), observed continuously. As long as no share trades at or below 59% during the 18-month life, the investor gets par back.
- If any one share breaches 59% ("barrier event"), protection is lost and the redemption then depends on the worst-performing share at maturity:
- if that worst share finishes at/above its start → still par;
- if it finishes below its start → the investor receives that share (worth par × its performance), i.e. takes the loss.
- Upside is fully capped — there is no participation if the shares rise; the investor only ever gets the coupon plus par (unless called).
- The issuer can call the note at each quarterly date (from month 6), repaying par plus the coupon then due. In simulation the note is called early in 32.5% of paths (mainly when the worst-of is at/above 100%).
Key Statistics — Structured Product vs Benchmark
The benchmark is an equal-weight basket of the three underlyings (total return, incl. dividends; dividend yields: BELL 3.04%, EMMN 2.11%, CNTL 0.00%).
| Metric (annualized) | Structured Product | Underlying Basket (total return) |
|---|---|---|
| Expected return | 4.93% | 8.85% |
| Expected volatility | 10.28% | 12.97% |
| Probability of loss | 13.82% | 26.54% |
| 99% VaR (1 year) | -31.81% | -14.04% |
The product offers a lower-volatility, more frequently positive profile (≈86% of paths up, vs ≈73% for the basket) but a worse tail: the worst-of construction concentrates the loss on the single weakest name, so the 1%-worst outcomes are far deeper than the diversified basket.
Charts
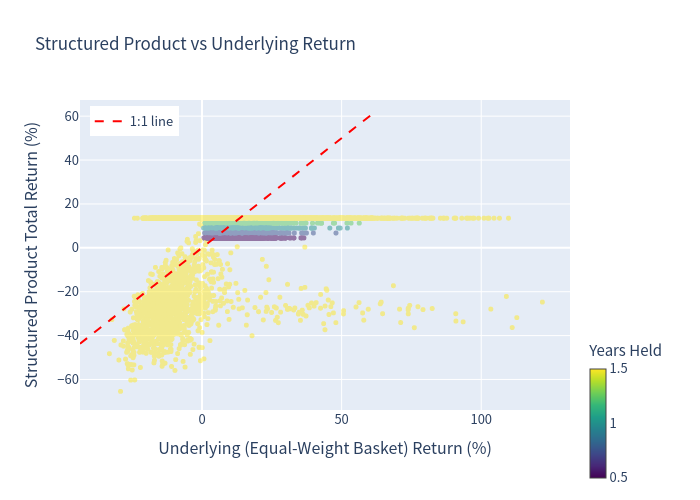
Simulation outcomes — product vs underlying
Each point is one simulated path; colour = years held. Most paths cluster at a positive product return (the coupon), while the loss cluster sits far below the 1:1 line.
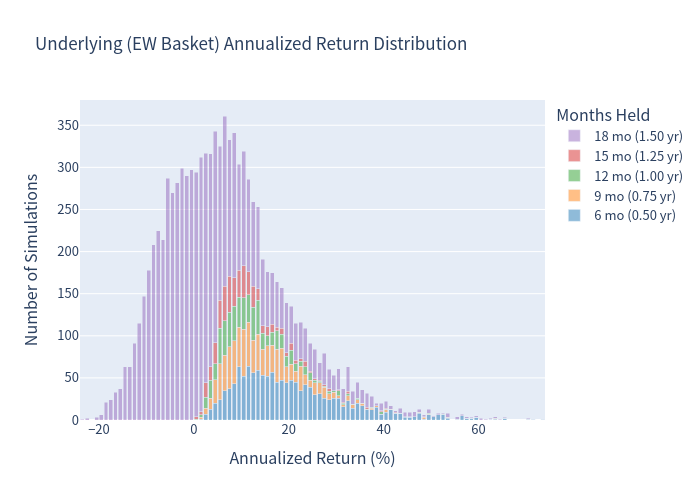
Annualized return distributions (stacked by holding period)
Underlying basket:
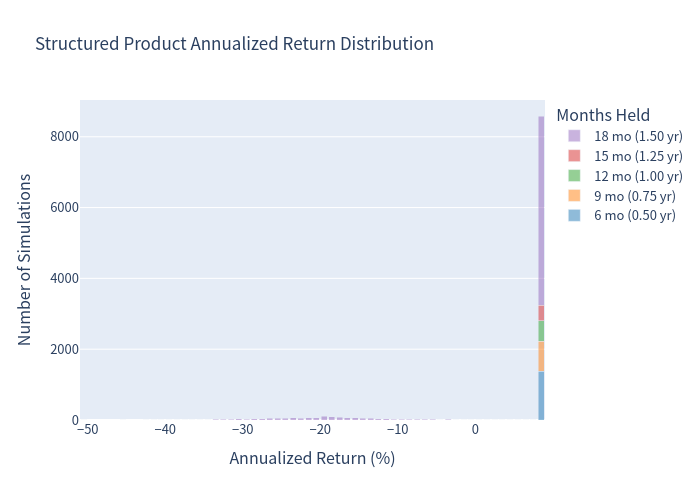
Structured product — highly concentrated near the coupon (~8.8–9.0% p.a.), with a separate negative tail:
Scenario probabilities (structured product)
Risk / return profile
Box plot — annualized return
Holding period & coupon distribution
Investment Commentary
- High headline coupon (9.00% p.a.) with a conditional 59% barrier (−41% cushion), which is rarely breached: only ~14% of paths end in a capital loss.
- Coupon is paid regardless of underlying performance, so income is stable while the barrier holds; the median outcome is a coupon-like ~8.8% p.a.
- Diversification across three defensive Swiss consumer/industrial names; the investor only loses if the structure fails and the worst name finishes below its start.
- Positive in ~86% of paths, and the equal-weight basket itself carries a ~27% loss rate — the note converts frequent small basket drawdowns into a steady coupon.
- Fully capped upside — no participation in share appreciation; the maximum annualized return is the coupon (9.00%).
- Asymmetric, negatively-skewed tail: the worst-of feature means losses are driven by the single weakest underlying, giving a 99% VaR of -31.81% — roughly double the basket's tail risk.
- Physical delivery risk of a single (worst-performing) share at maturity, which may be illiquid and concentrated.
- Issuer callable: the note is likely to be redeemed early when markets rally, truncating the coupon stream (mean holding ≈ 15 months).
- Exposed to the credit risk of the issuer (Leonteq, Fitch BBB-) and to the special risk of the recently-listed, high-volatility name (CNTL).