
Structured Product Evaluation
Headline Simulation Results
Expected annualized return (mean CAGR)
Probability of a negative return
99% confidence VaR (1-year, 1st percentile)
Expected holding period (≈ 1.18 years)
Median total return over holding period
| Metric | Structured Product |
|---|---|
| Expected annualized return (mean CAGR) | 6.42% |
| Probability of a negative return | 15.17% |
| 99% confidence VaR (1-year, 1st percentile) | −31.17% |
| Expected holding period | 14.13 months (≈ 1.18 years) |
| Median total return over holding period | 11.20% |
Basic Product Information & How It Works
The product is a Barrier Reverse Convertible on three chocolate & spirits stocks — Barry Callebaut, Lindt & Sprüngli and Rémy Cointreau — where the payoff depends on the worst performer of the three, with a Quanto CHF wrapper (the Rémy Cointreau EUR exposure is converted at a locked rate, so the investor carries no FX risk).
In plain terms
- You invest par (CHF 10,000). You collect a fixed 11.20% p.a. coupon, paid quarterly (CHF 280 per quarter; 6 payments if held to maturity).
- Downside protection (conditional): if no stock ever trades at or below 59% of its starting level during the ~18-month life, you get your full par back at maturity — regardless of how far stocks moved, as long as they stayed above 59%.
- If the barrier is touched: you keep your coupons, but at maturity you no longer get full protection. If the worst stock finishes below its starting level you receive that worst stock (or its cash equivalent) — i.e., you absorb that stock's fall below par, down to as little as 0.
- Issuer call: the issuer can redeem early on quarterly dates (from month 6), after which you get par + the coupon and nothing more — this caps your upside.
- Upside is capped at the coupons plus par; you do not participate in any stock rally.
Key Statistics (annualized)
| Metric | Structured Product | Underlying Basket — Total Return | Underlying Basket — Price Only |
|---|---|---|---|
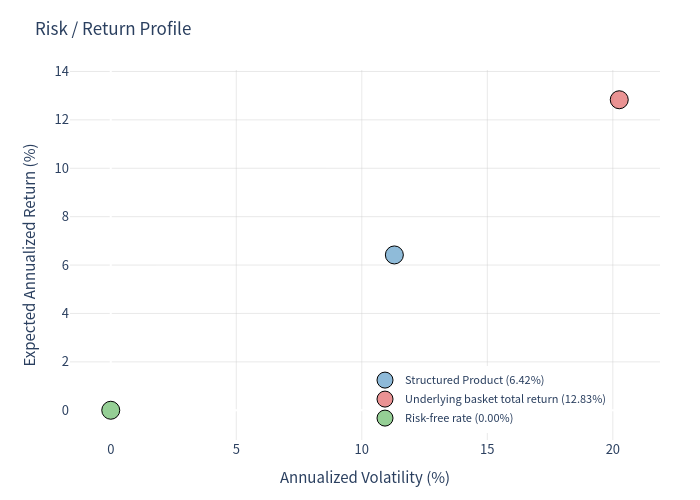
| Expected annualized return | 6.42% | 12.83% | 10.80% |
| Annualized volatility | 11.30% | 20.26% | 20.30% |
| Probability of loss | 15.17% | 28.57% | 32.93% |
| 99% VaR (1-year) | −31.17% | −23.28% | −25.62% |
Benchmark = equal-weight basket of the three underlyings (each starting at 100). Total return adds the basket's average dividend yield (~2.03% p.a.).
Outcome mix:
- Called early: 40.50%
- Survived to maturity with the barrier intact → par: 44.06%
- Matured after a barrier breach with the worst stock below par → principal impairment: 15.44%
The maximum annualized return is capped at 11.20%, while the worst total return in simulation was −59.12%.
Simulation Outcome Charts
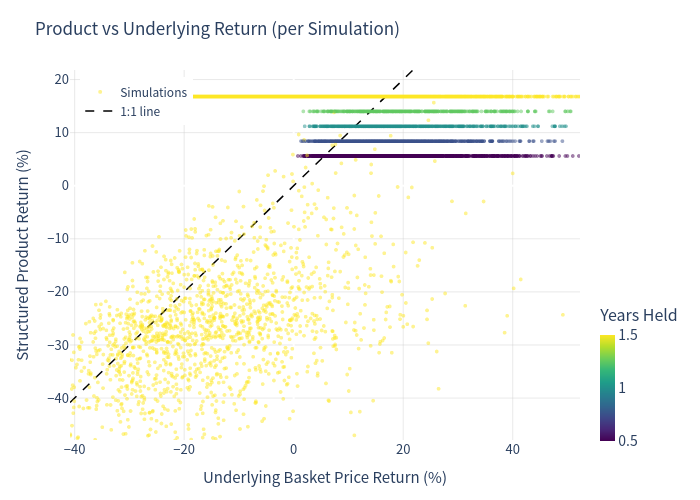
Product return vs. underlying return (per simulation)
Each dot is one simulation; the dashed line is 1:1. The product clusters along a coupon-driven plateau spanning roughly +5.6% total (a month-6 call) up to +16.8% total (held to maturity) — the exact level depends on how many quarterly coupons were collected — and sits below the 1:1 line in the bottom-left when the worst stock breaches the barrier — i.e., the note gives up upside to buy protection, but still tracks the worst-of downside when the barrier fails.
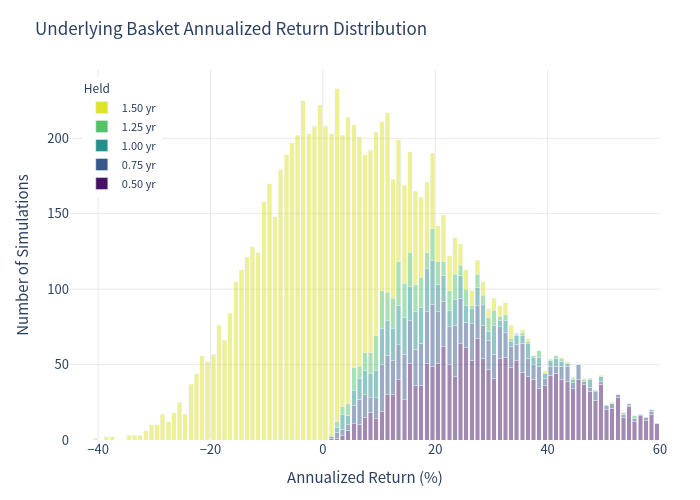
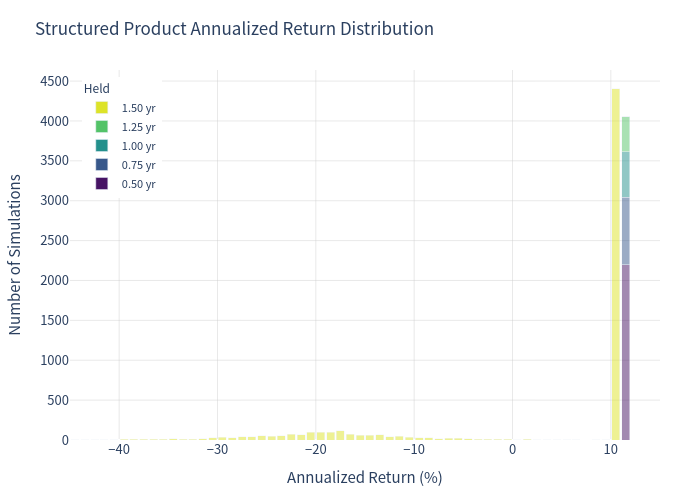
Distribution of annualized returns — underlying vs product
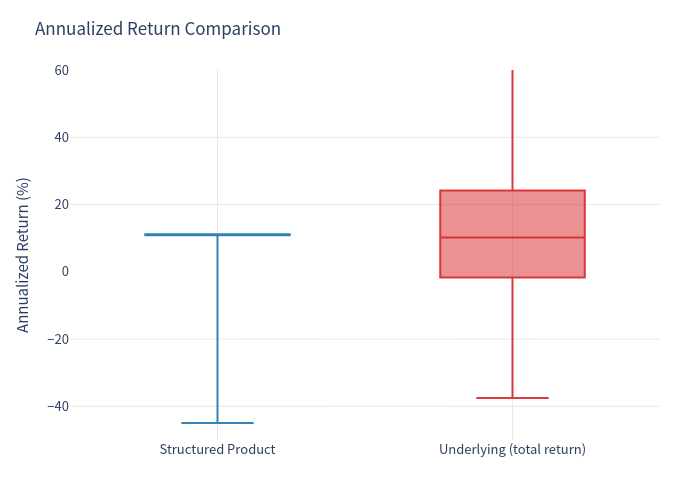
The underlying (left) has a wide, roughly symmetric spread (with a long right tail coming from short holding periods being linear-annualized). The product (right) is inverted/asymmetric: a large cluster at the coupon plateau (~11%) and a separate left tail of loss scenarios down to about −45% annualized.
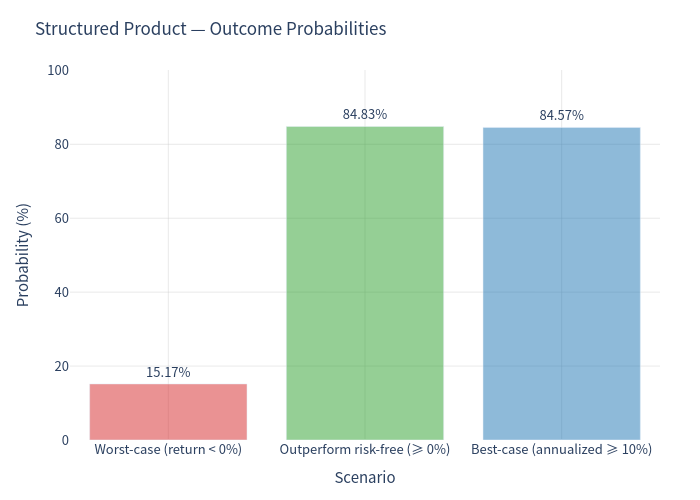
Outcome probabilities
The product delivers a positive return in ≈85% of scenarios and reaches close to its maximum coupon return (≥10% annualized) in ≈85% of paths, while a negative return occurs in ≈15%.
Risk / return positioning
Relative to the basket, the product sits down and to the left — clearly lower volatility (≈11% vs ≈20%) but also a lower expected return (6.42% vs 12.83%), and with a fatter left tail (worse 99% VaR).
Annualized return — box comparison
The product's interquartile range sits tightly around the ~11% coupon plateau, whereas the underlying's total-return box is much wider (the extreme right whisker is driven by short-holding linear annualization of strong rallies; the y-axis is windowed for readability).
Holding period & coupon distribution
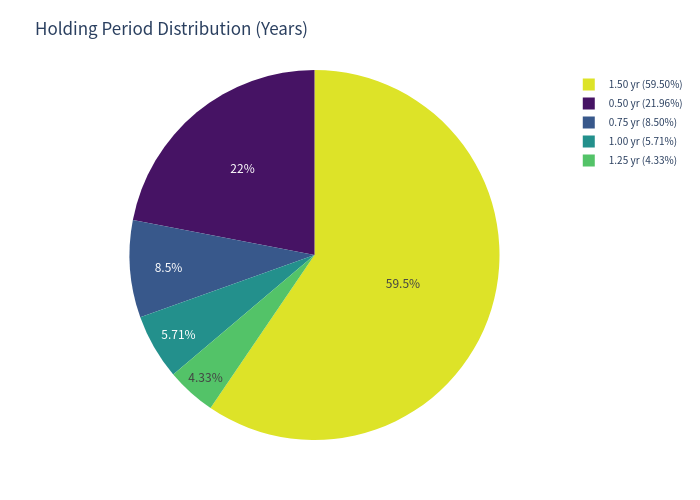
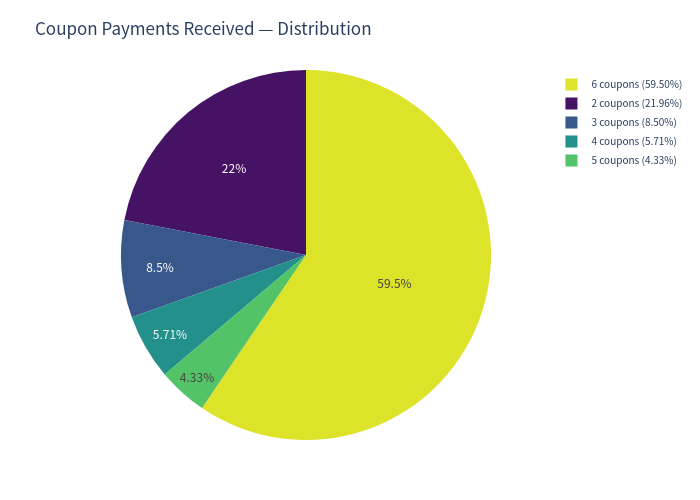
Because the note is callable, it does not always run the full 18 months: ~40.5% of paths are called early (mostly at month 6), while ~59.5% run to maturity. The coupon-count distribution mirrors this exactly (2 coupons if called at month 6 … 6 coupons if held to maturity).
Investment Commentary
Strengths worth noting
- High, predictable cash coupon: 11.20% p.a. paid quarterly, with coupons paid in all scenarios (including a downside outcome) as long as the product is alive.
- Lower volatility and lower hit-rate of losses than the basket: ~11.3% annualized vol vs ~20.3%, and a 15% probability of loss vs ~29% for the basket — because par is returned in any scenario where the 59% barrier holds.
- Deep, cushion-style barrier (59%): a stock must fall ~41% before protection is lost, and the barrier only bites if the worst stock also finishes below its starting level.
- Most-likely outcome is a coupon-and-par return: the median total return is +11.20% and ~85% of paths end positive; early call (40.5%) returns par plus coupons sooner.
- No FX risk on the EUR-denominated underlying thanks to the Quanto structure.
Trade-offs to be aware of (for completeness)
- Capped upside: returns are limited to coupons + par; the investor forgoes any stock rally.
- Worst-of, and a heavy left tail: the product's 99% VaR (−31.17%) is worse than the diversified basket's total-return VaR (−23.28%). The ~15% of loss paths can be severe — the simulation's worst case was −59% total — because the note is exposed to the single worst stock, and the bond-like coupons do not fully compensate for that tail.
- Expected return below the basket: the ~6.4% expected annualized return (6.42%) is materially below the basket's ~12.8% expected total return; the coupon is effectively financed by selling worst-of downside protection.
- Call risk: early redemption caps the investor's ability to keep collecting the coupon in a rally.
- Issuer credit risk (Leonteq) applies throughout the term.