
Structured Product Evaluation — 12.00% p.a. Multi Barrier Reverse Convertible (Callable)
Headline Simulation Results
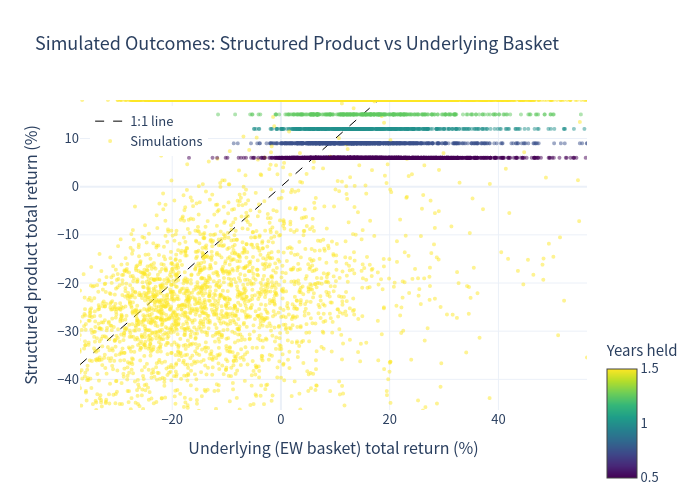
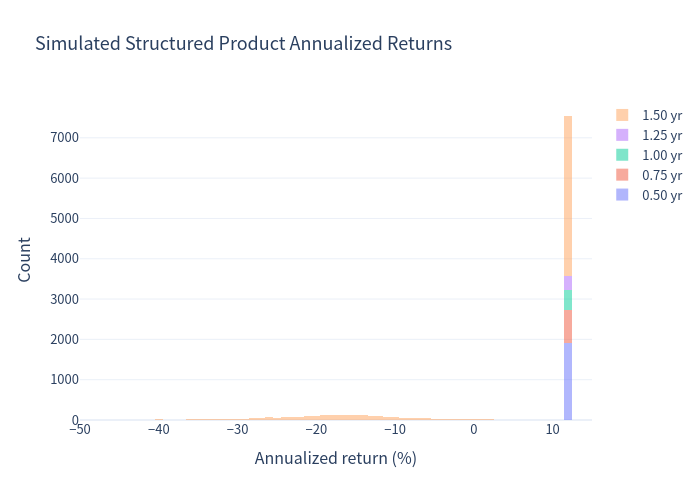
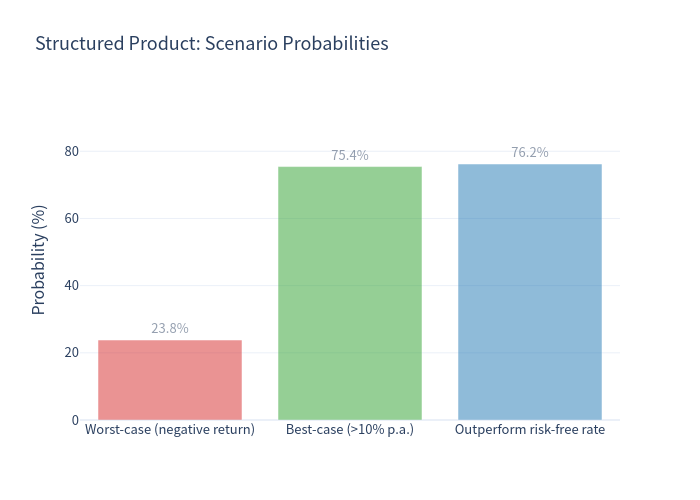
The product packages a high 12.00% p.a. coupon with conditional downside protection down to a 59% continuous barrier on the worst-performing of three shares. In most simulated paths (about 76%) the investor earns a coupon-driven return of roughly 12% p.a.; the risk is concentrated in a minority of paths where the worst share falls hard, breaks the barrier and also finishes below its starting level, leaving the investor with the depreciated worst performer.
Basic Product Information — How It Works (layman's terms)
- You receive 12.00% p.a., paid quarterly (CHF 30 per CHF 1,000), on each scheduled coupon date for as long as the product is outstanding — the coupon is paid in any case, regardless of how the shares perform.
- Automatic protection at maturity: if none of the three shares ever trades at or below 59% of its starting level during the whole life of the deal, you get your full CHF 1,000 back plus all coupons.
- The risk: if any one share touches its 59% barrier at any moment (continuous observation) and that worst share is below its starting level at the end, you do not get your money back in cash — instead you receive that worst-performing share (or its cash value), and can lose a large part of your capital. A breach that fully recovers to at least par still redeems at par.
- Issuer call: the Issuer may redeem the product early (quarterly, from month 6) — you would then receive par plus that quarter's coupon.
- Upside is capped: you never participate in share upside beyond the coupons. Maximum outcome is par + all six coupons (about 18 index points over 18 months).
Key Statistics (10,000 Monte-Carlo scenarios)
| Metric | Structured Product | Underlying (EW basket, total return) |
|---|---|---|
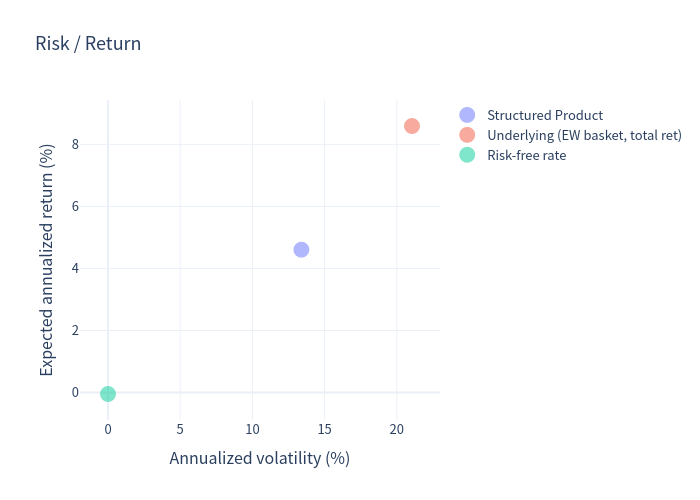
| Expected annualized return | +4.61% | +8.59% |
| Expected annualized volatility | 13.39% | 21.05% |
| Probability of loss | 23.81% | 37.49% |
| 99% confidence VaR (1 year) | -33.99% | -26.40% |
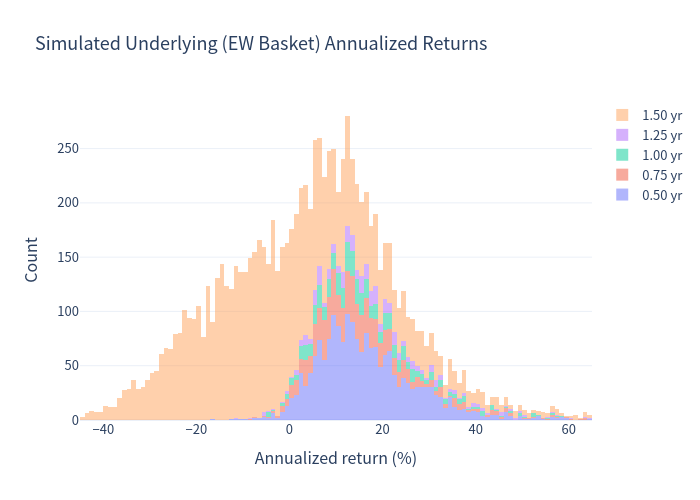
Benchmark: an equally-weighted buy-and-hold basket of the three shares (dividend yield about 0.11% p.a. added). Risk-free rate (CHF, 1-year average) about -0.05%.
The product trades volatility for a smaller expected return but, importantly, its tail risk is worse than the diversified basket — because the payoff is driven by the worst share and the barrier only protects against moderate drawdowns.
Charts
Simulation outcomes (product vs underlying)
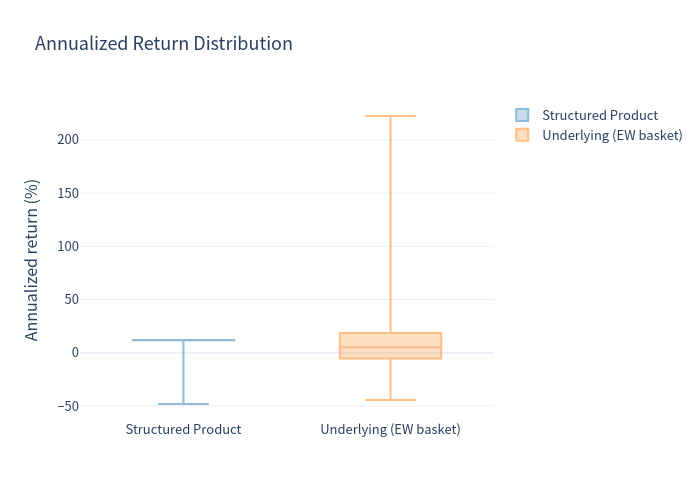
Structured product — distribution of annualized returns
Underlying basket — distribution of annualized returns
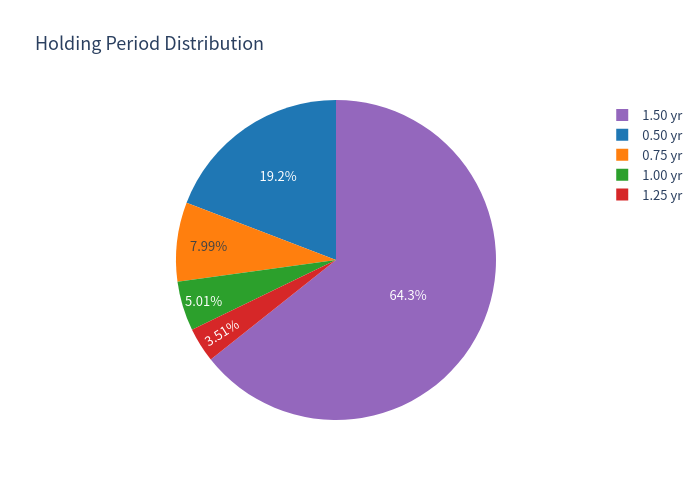
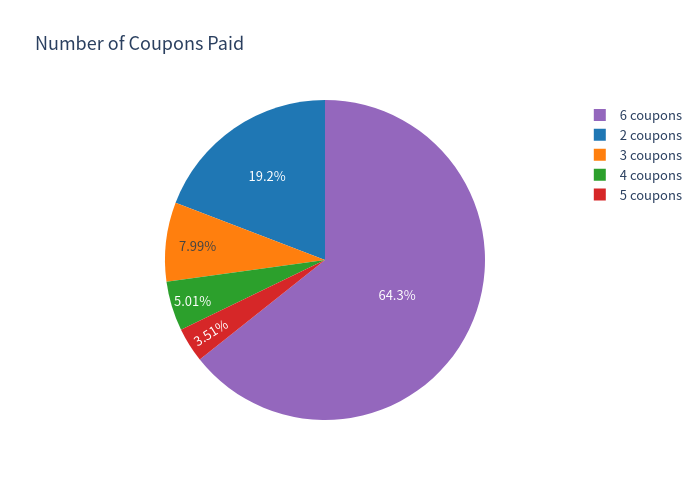
Scenario probabilities
Risk vs return
Annualized return box plot
Holding period and coupon count
Investment Commentary
Potential merits
- High headline income: 12.00% p.a. fixed quarterly coupon, well above CHF cash rates (about 0%), and paid in any case while the product is outstanding.
- Conditional principal protection: a wide 59% barrier means the investor keeps par in about 74% of paths even though the individual shares are volatile.
- Defined, capped outcome: maximum return is known (par + 18 points); income accrues regardless of modest share weakness.
Risks to weigh
- Worst-of exposure: the payoff is tied to the weakest of the three shares. Kuros Biosciences in particular has shown very high historical volatility (about 90% p.a.) and a long-run negative trend, and it heavily drives the loss tail.
- Continuous barrier: the 59% level is monitored continuously, so a single intraday touch — even a temporary one — counts as a barrier event. If the worst share then also finishes below its starting level, the investor receives the worst performer instead of par (a breach that recovers to at least par still redeems at par).
- Tail risk exceeds the basket: the 99% VaR (-33.99%) is worse than the diversified equal-weight basket (-26.40%); the product does not simply reduce risk, it re-shapes it.
- Lower expected return: mean annualized return (4.61%) sits below the diversified basket (8.59%) — the investor gives up upside participation and average return in exchange for the coupon and the conditional protection.
- Issuer/credit risk applies (structural notes are exposed to the Issuer), partly mitigated by TCM collateralisation.
Interpreting the numbers: because a large block of scenarios ends early or at par, annualized figures are driven by the coupon and should be read together with the expected holding period (about 14.6 months) and the mean total return over the holding period (about 4.06%). Nearly 20% of scenarios redeem at month 6; for those short holds annualization is linear and can look flattering.