Structured Product Analysis Report
9.20% p.a. Multi Barrier Reverse Convertible on Nestlé, Novartis, Roche
How it works (layman's explanation)
This is a Reverse Convertible note linked to three Swiss blue-chip stocks: Nestlé, Novartis, and Roche. Here's how it works in simple terms:
- Coupon Payments: Regardless of how the stocks perform, the investor receives a fixed quarterly coupon of 2.30% (9.20% per annum). This is paid every 3 months.
- Safety Buffer (Barrier): The product has a 69% barrier on each underlying stock. If none of the three stocks ever falls below 69% of its initial level during the entire 2-year period, the investor gets their full initial investment back at maturity (plus all coupons).
- Downside Risk: If any of the three stocks does fall below 69% at any point during the 2 years, the safety net is removed. At maturity:
- If the worst-performing stock is still above its initial level (100%), the investor gets their full investment back.
- If the worst-performing stock is below its initial level, the investor receives physical shares of that stock instead of cash, incurring a loss equal to the stock's decline.
- Issuer Call Feature: The issuer has the right to call (redeem early) the product on 4 specific dates starting after 12 months. If called, the investor receives their full investment back plus the coupon for that period. No further payments are made.
- FX Protection (Quanto): Even though the underlying stocks trade in CHF, the product is denominated in EUR, and the FX risk is hedged away by the issuer.
Structured Product
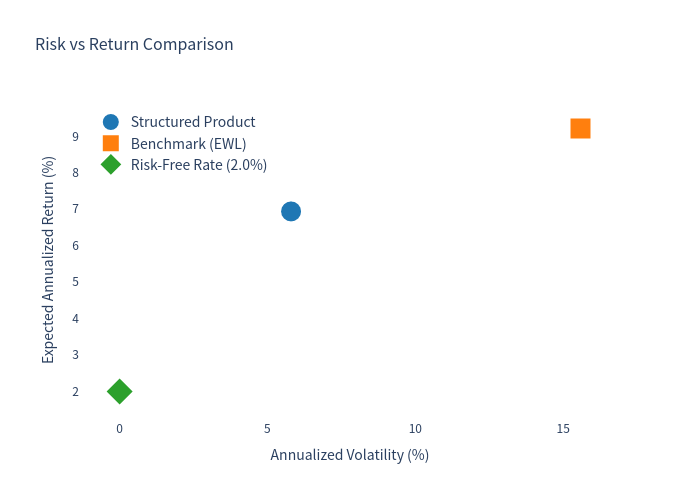
| Expected Annualized Return | 6.94% |
| Expected Annualized Volatility | 5.80% |
| Probability of Loss (Annualized) | 11.54% |
| 99% VaR (1-Year) | -15.22% |
| Expected Total Return | 9.63% |
| Expected Holding Period | 17.9 months |
| Maximum Annualized Return | 9.20% |
Benchmark (EWL – iShares MSCI Switzerland ETF) with Dividends
| Expected Annualized Return | 9.22% |
| Expected Annualized Volatility | 15.58% |
| Probability of Loss (Annualized) | 26.15% |
| 99% VaR (1-Year) | -29.98% |
| Expected Total Return | 14.48% |
Risk-Free Rate (EUR ESTR)
| Annual Rate | 2.00% |
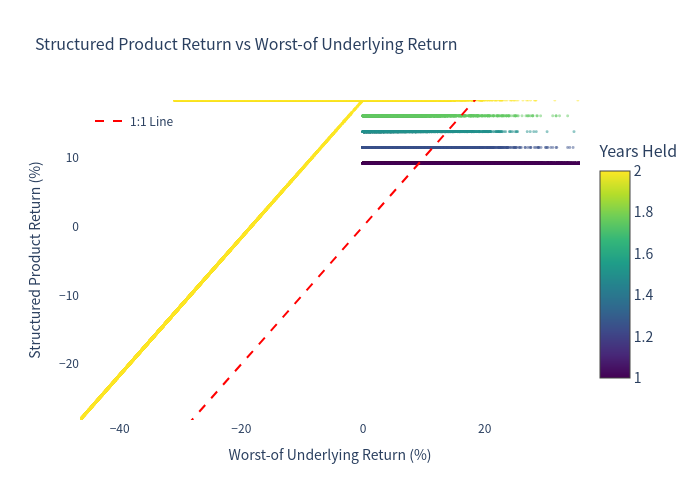
1. Simulation Outcome Scatter Plot
Each dot represents one simulation. The x-axis shows the worst-of underlying return, and the y-axis shows the structured product return. The dashed red line represents a 1:1 relationship. Points above the line indicate the product outperformed the worst-performing underlying.
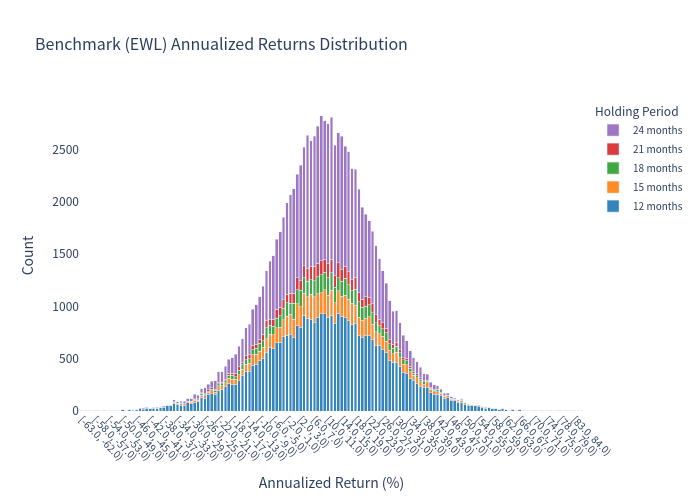
2. Benchmark Annualized Return Histogram
Distribution of the benchmark (EWL ETF) annualized returns across all simulations, colored by holding period.
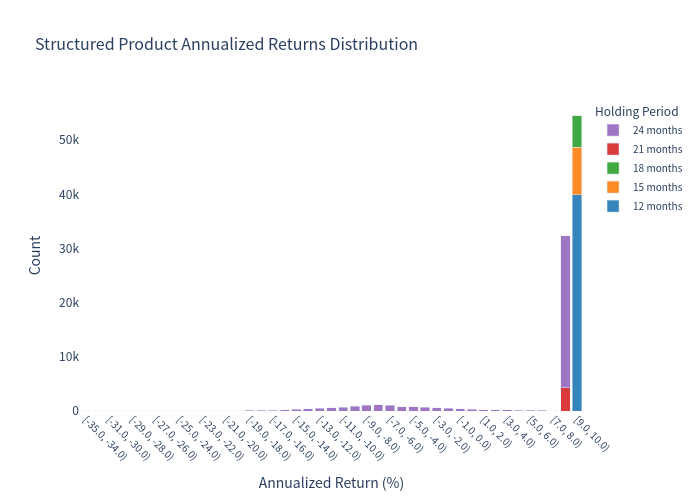
3. Structured Product Annualized Return Histogram
Distribution of the structured product's annualized returns across all simulations, colored by holding period. Note the tight clustering near the maximum coupon rate compared to the wider distribution of the benchmark.
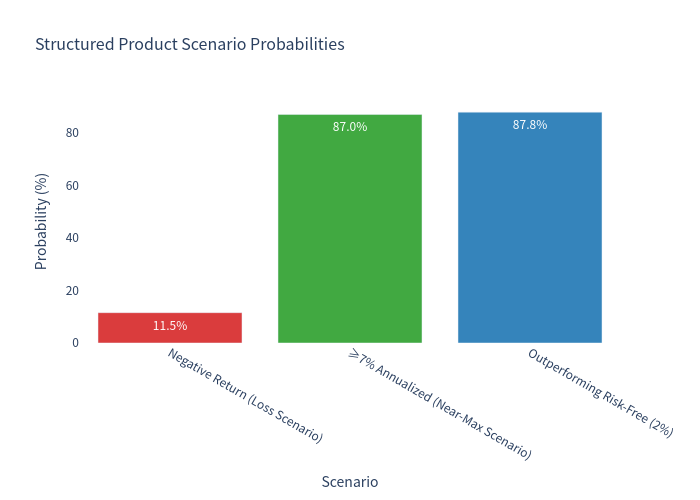
4. Scenario Probability Bar Chart
Probability of different outcome scenarios for the structured product.
5. Risk vs Return Comparison
Comparison of expected annualized return vs. volatility for the structured product, benchmark, and risk-free rate.
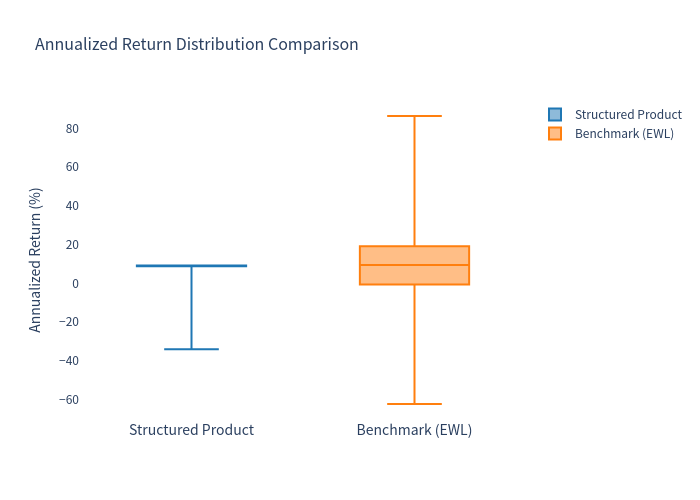
6. Box Plot Comparison
Box plot comparing the distribution of annualized returns between the structured product and the benchmark.
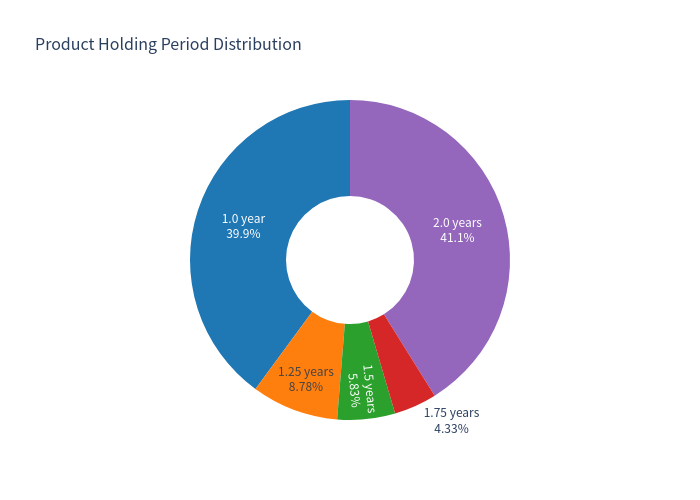
7. Holding Period Distribution
Distribution of how long the product is held before being called or maturing.
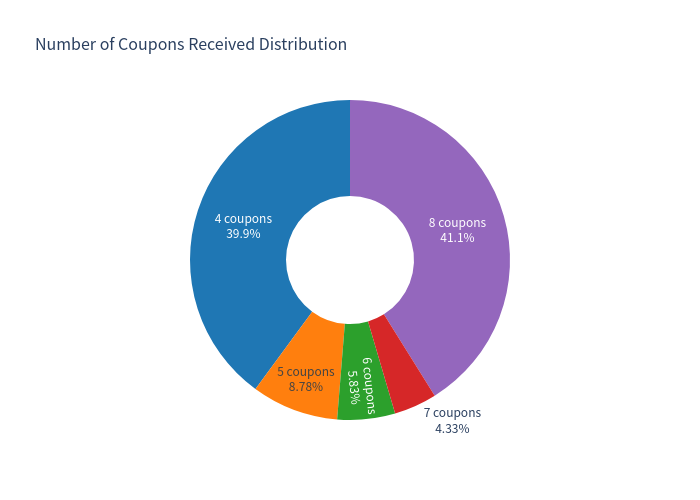
8. Coupon Payment Distribution
Distribution of how many coupon payments are received across all simulations.
Key Takeaways
- The structured product offers reduced volatility (5.80%) compared to the benchmark (15.58%), due to the coupon income stream and conditional downside protection.
- The probability of loss is significantly lower (11.54%) compared to the benchmark (26.15%), reflecting the barrier protection feature.
- The product has an 88% probability of outperforming the risk-free rate, making it an attractive yield-enhancement tool in a low-yield environment.
- The product is called early by the issuer in ~59% of scenarios (when all three stocks perform well), which limits the total number of coupons received.
- In the worst 13.2% of scenarios (barrier breached + worst stock below initial level at maturity), the investor faces losses proportional to the decline of the worst-performing stock.
- The maximum annualized return is capped at 9.20% (the coupon rate), meaning the product does not participate in any upside beyond the fixed coupons.
Pros
- Attractive fixed coupon of 9.20% p.a. paid quarterly regardless of underlying performance
- Significant downside buffer with 69% barrier level
- Quanto EUR structure eliminates CHF/EUR FX risk
- Lower volatility and lower probability of loss compared to direct equity investment
Cons
- Upside is capped at the coupon rate — no participation in strong equity market rallies
- Issuer call feature means the product may be redeemed early in favorable market conditions, limiting total coupon income
- In a severe market downturn where the barrier is breached, the investor can suffer significant capital losses (up to 100% of the worst performer's decline)
- Credit risk exposure to the Issuer (Leonteq Securities AG) and Guarantor (PostFinance Ltd)