
Callable Jump Notes due March 31, 2031
Headline Simulation Results
| Metric | Structured Product |
|---|---|
| Expected annualized return (mean per-simulation CAGR) | 5.95% |
| Expected total return over the realized holding period | 14.52% |
| Expected holding period | 36.0 months (3.0 years) |
| Probability of a negative total return (if held to maturity/call) | 0.00% |
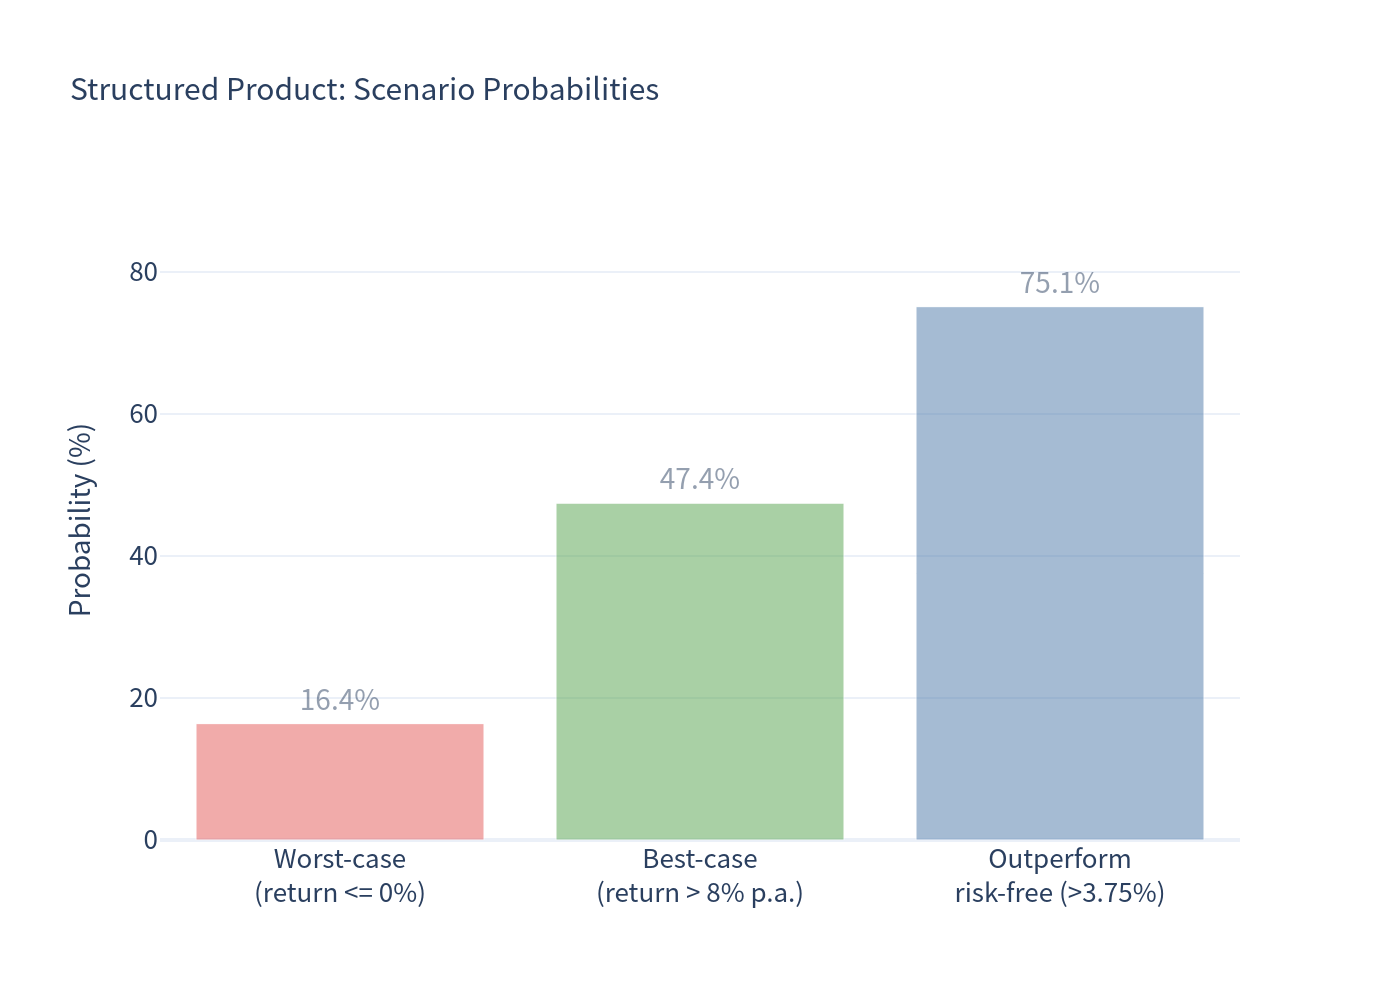
| Probability of a 0% total return (par returned at maturity) | 16.39% |
| 99% confidence VaR (1-year) | 0.00% |
| Probability of outperforming the risk-free rate (3.75%) | 75.12% |
Key takeaway: This is a fully principal-protected, worst-of linked note. If held to maturity (or upon a call), the investor cannot lose principal — 0.00% loss probability and a 0.00% one-year VaR in the simulation (subject to issuer/guarantor credit; this says nothing about secondary-market price risk if sold early). In exchange, the upside is largely capped by the issuer's discretionary call. Expected annualized return is ~5.95% versus the equal-weight benchmark's ~15.0% (price) / ~16.0% (incl. dividends). The trade-off is a dramatic reduction in risk: expected annualized volatility of 3.20% vs. 12.35% for the benchmark, and a 99% VaR of 0.00% vs. -11.22%.
How the Note Works (in plain terms)
- You invest $1,000 and get at least $1,000 back at maturity — no matter how the indices perform. Principal is fully protected at maturity (there is no barrier and no knock-in).
- Upside is worst-of. At maturity, if both the Russell 2000® Index and the S&P 500® Index finish above their starting levels, you additionally receive 100% of the return of the worse-performing index. If either index is flat or down, you receive only your $1,000 back (a 0% return).
- The issuer can redeem early (call). On any monthly redemption date (months 12–59), Morgan Stanley may redeem the note if a risk-neutral model says doing so is "economically rational." If called, you receive a pre-set redemption amount that steps up over time — from $1,082.50 (≈ +8.25%) at month 12 to $1,405.625 (≈ +40.6%) at month 59. Once called, no further payments are made.
- No regular interest. The notes pay no coupon; the only sources of return are the escalation in the call amount or the maturity upside payment.
Because the issuer exercises its call precisely when the note is doing well (i.e., when the indices are appreciably above their starting levels), the call caps the investor's upside in the majority of scenarios. The cap is not absolute, however: in the ~34% of paths that are never called and finish deeply in the money, the maturity upside can exceed the largest call payment (in ~1.5% of all paths the total return exceeds the maximum redemption amount of +40.6%).
Key Statistics
| Metric | Structured Product | Benchmark (Equal-Weight RTY+SPX) | Benchmark incl. Dividends |
|---|---|---|---|
| Expected annualized return | 5.95% | 15.02% | 15.96% |
| Expected annualized volatility | 3.20% | 12.35% | 12.35% |
| Probability of loss | 0.00% | 12.00% | 11.68% |
| 99% VaR (1 year) | 0.00% | -11.22% | -10.28% |
Benchmark is a 50/50 monthly-rebalanced basket of the two indices; dividend yields use IWM (0.90%) and SPY (0.98%).
Other useful figures
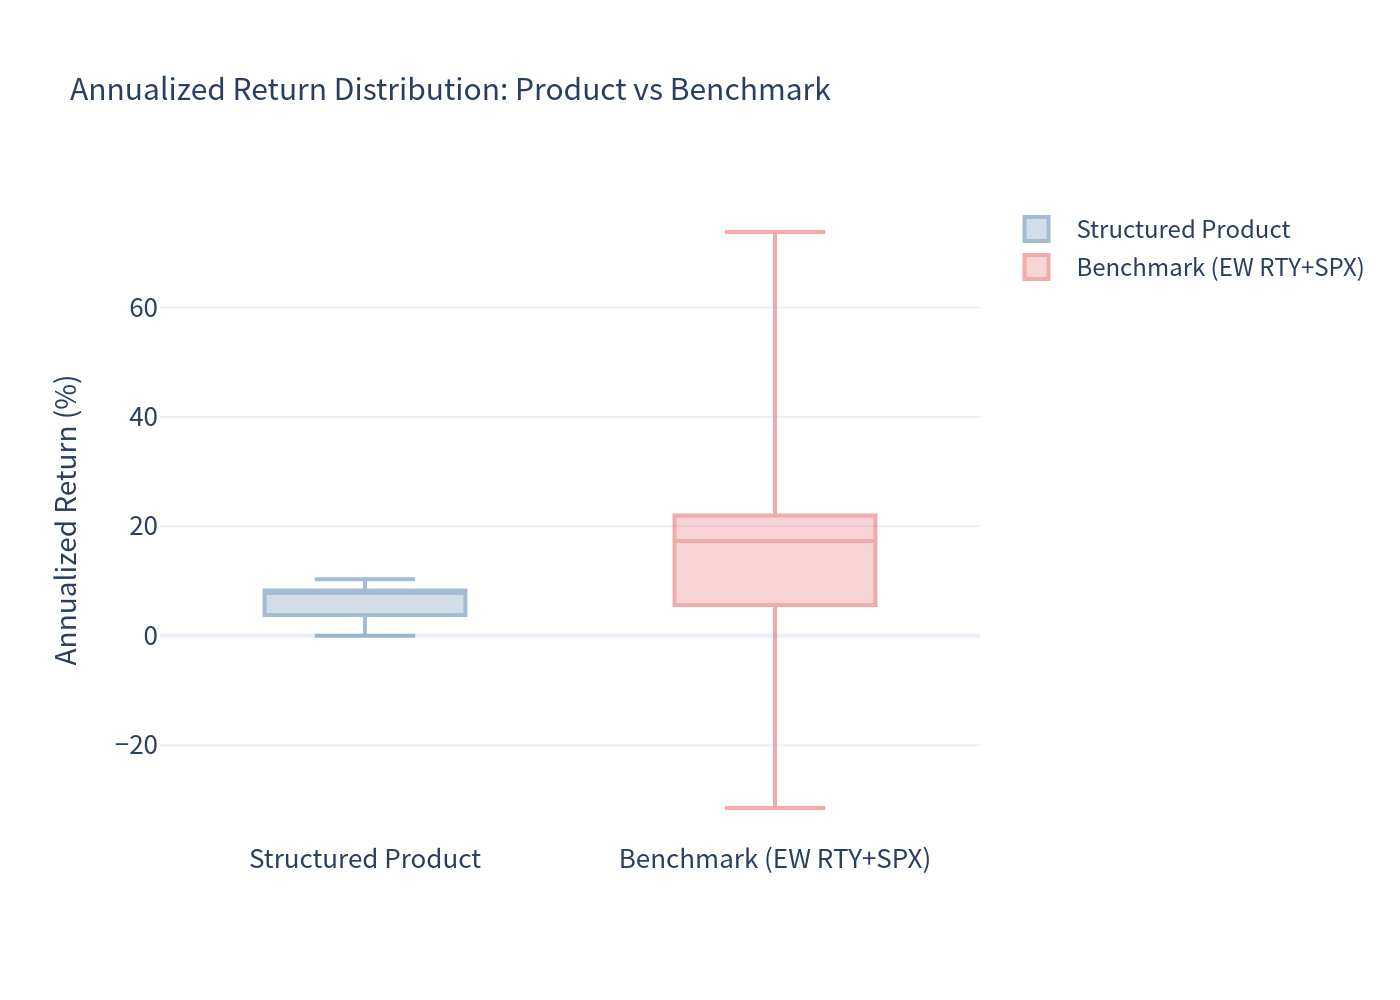
- Maximum observed product total return: 63.43%; maximum annualized return: 10.32%.
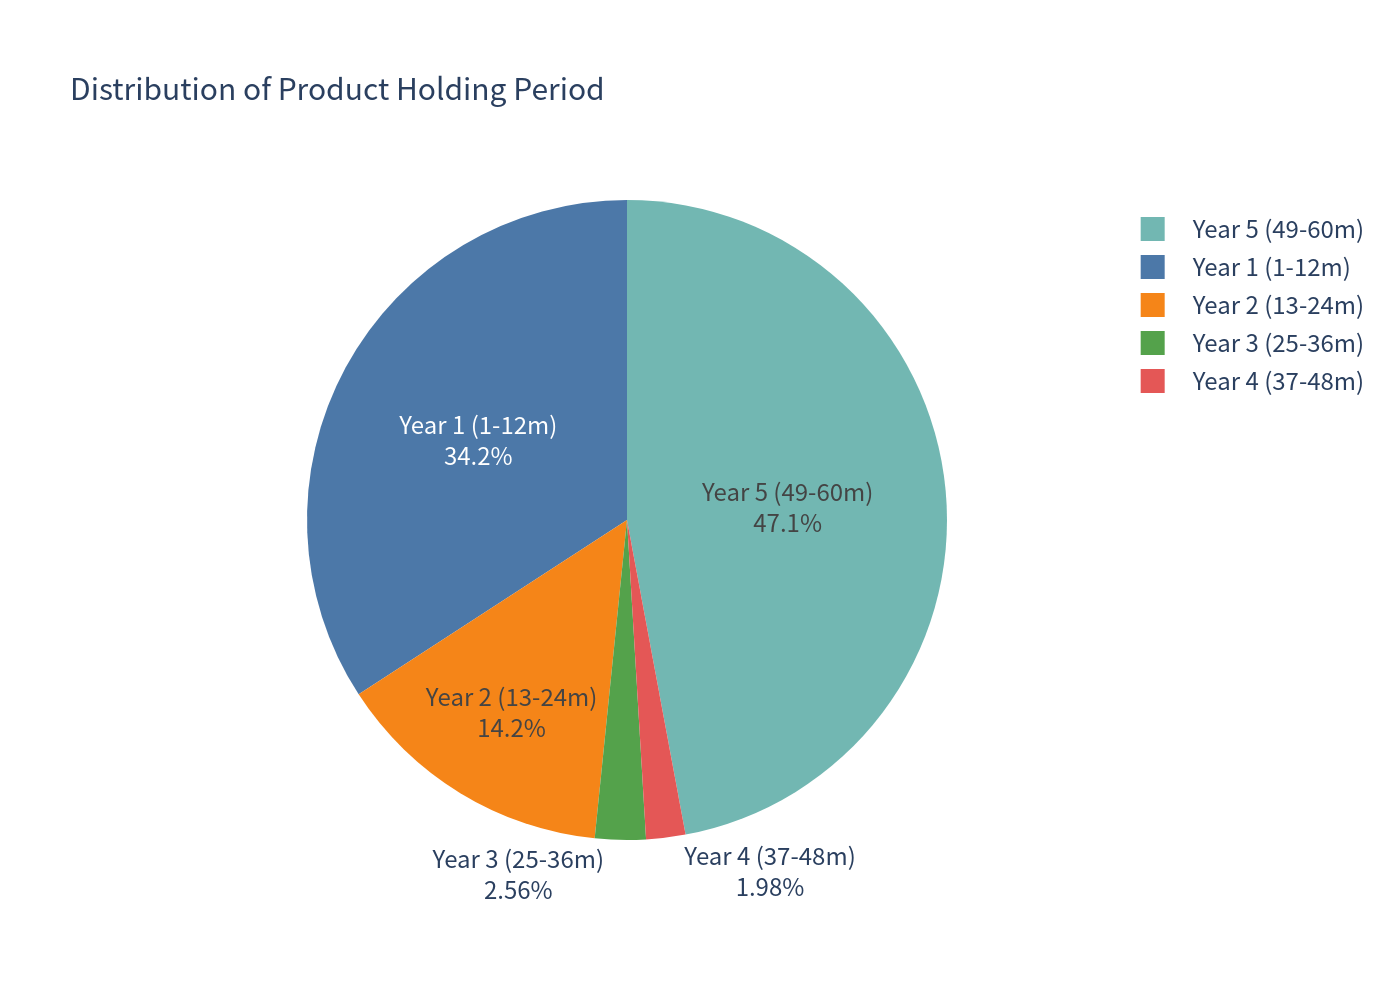
- Probability the note is called early: 66.11%; probability it runs to maturity: 33.89%.
- Of the paths held to maturity, 51.64% finish with both indices up (paying an upside) and 48.36% finish at par (a 0% return).
Charts
Simulation outcomes (product vs benchmark)
Each point is one simulated path (colour = years the note was held).
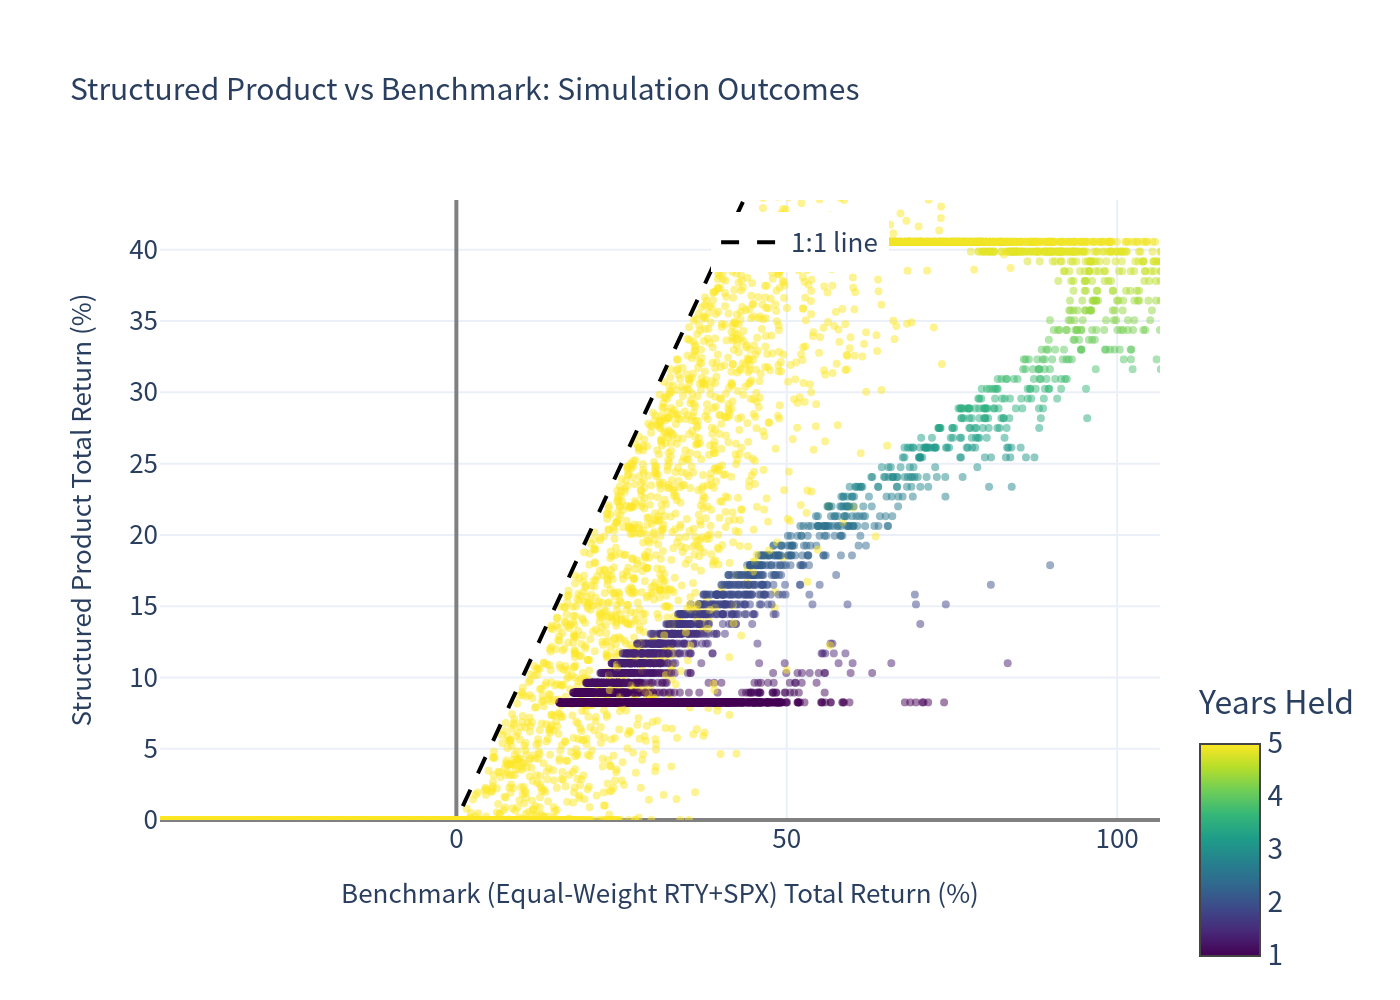
The cloud sits entirely on or above 0% for the product (principal protection) and is strongly concave: wherever the benchmark does well, the product's return is materially lower because of the call cap. The dashed line is the 1:1 reference.
Annualized return distributions
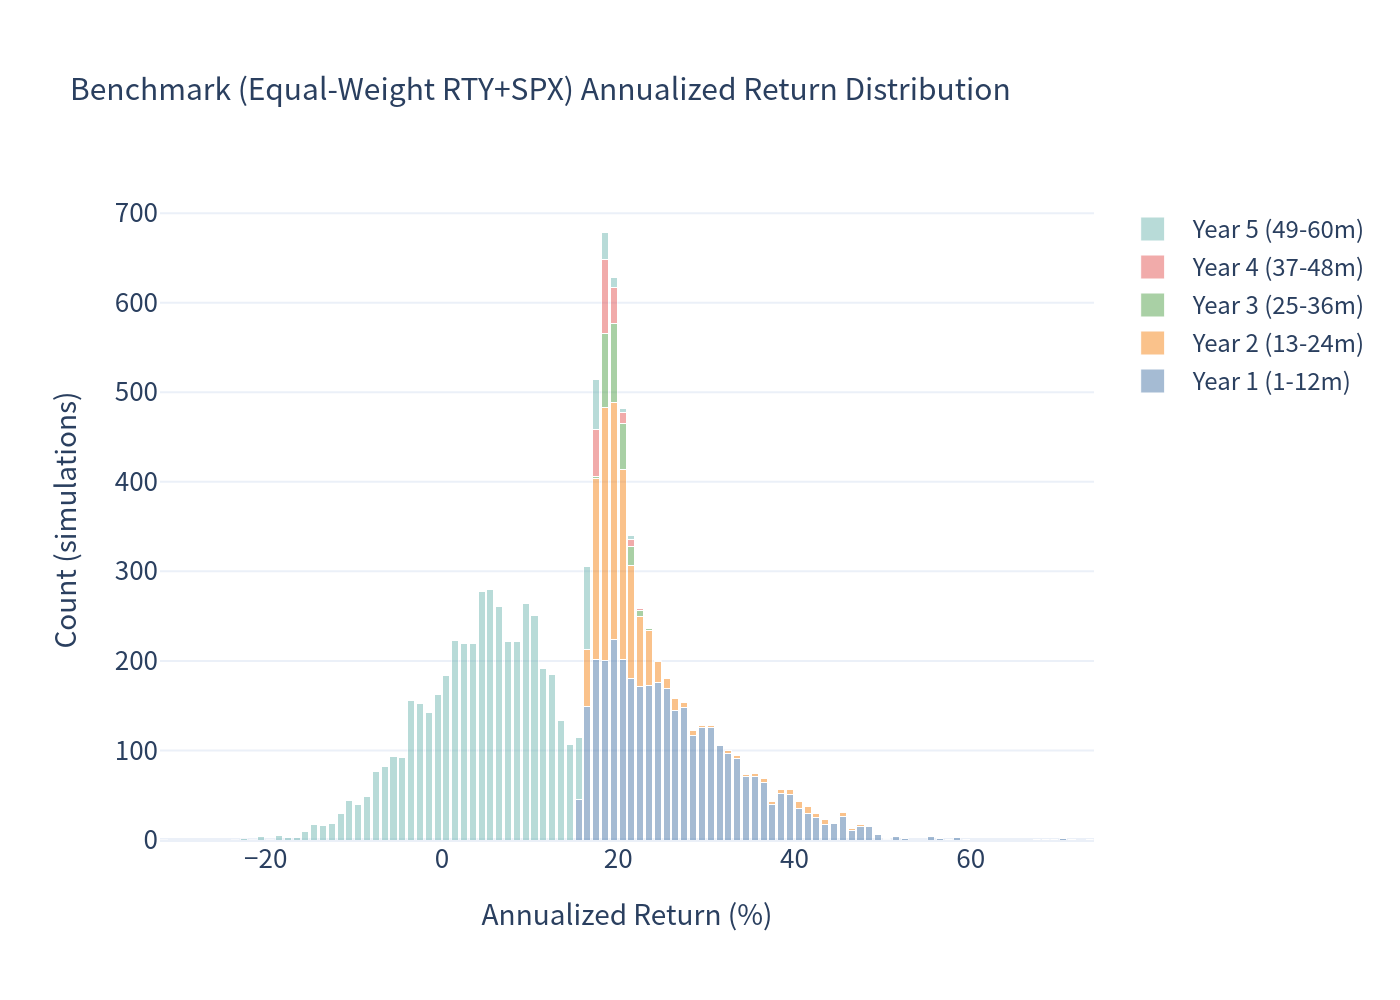
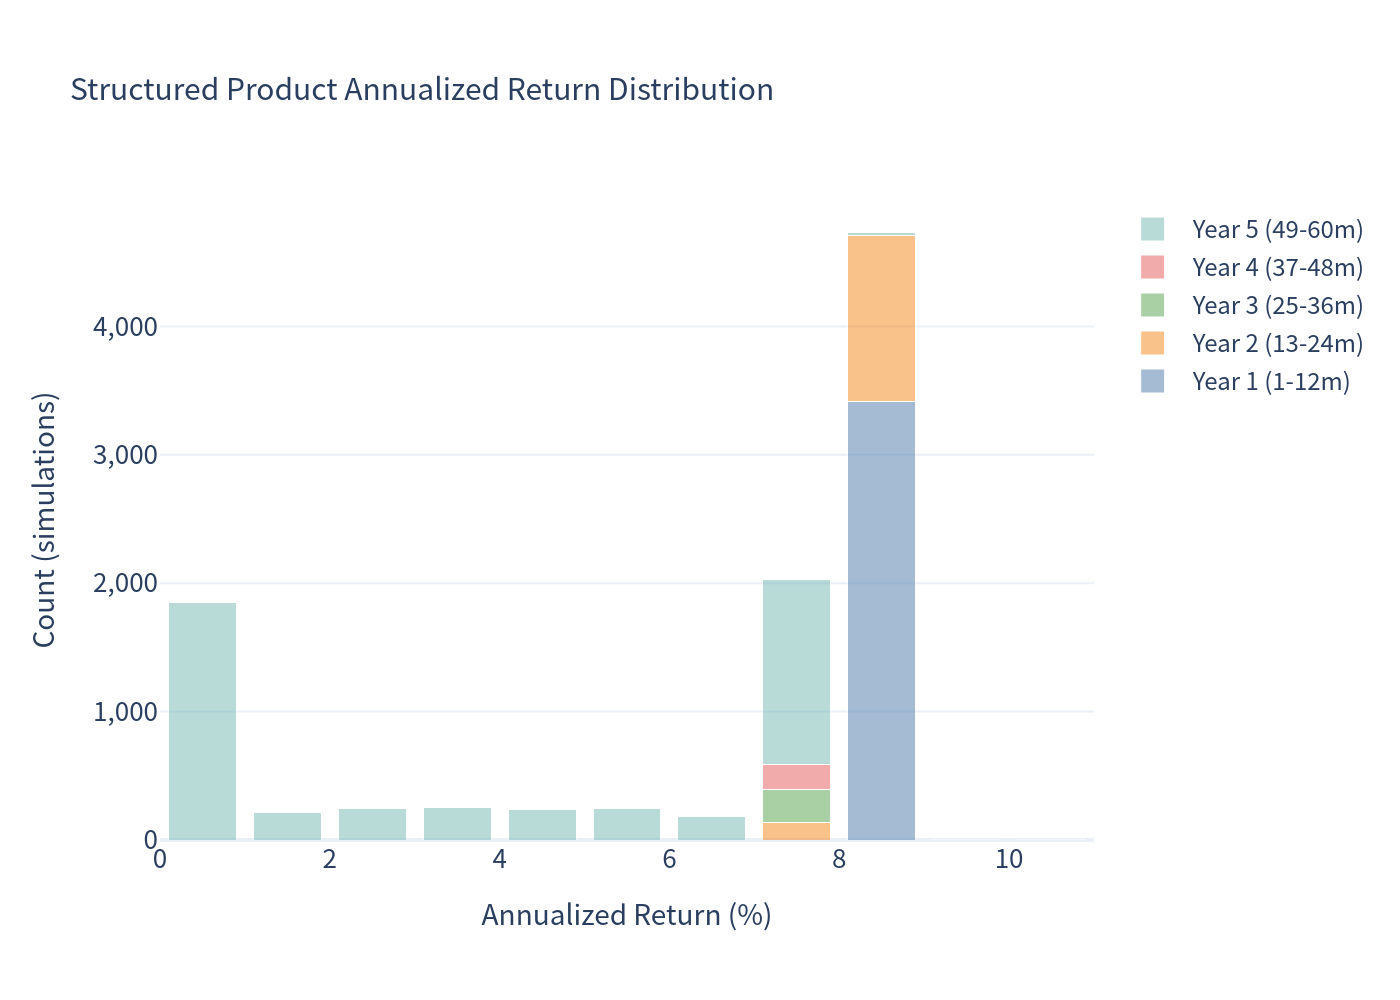
The benchmark (top) is broadly and roughly symmetrically spread between about -31% and +74% annualized, with meaningful negative mass. The product (bottom) is compressed into a narrow band from 0% to ~10% annualized. Its tallest bar is at ~8% — the cluster of paths called after roughly one year (≈ +8.25%) — with a second cluster at 7–8% and a large bar at 0% (paths held to maturity at par, ~16–18% of paths).
Scenario probabilities
Risk / return comparison
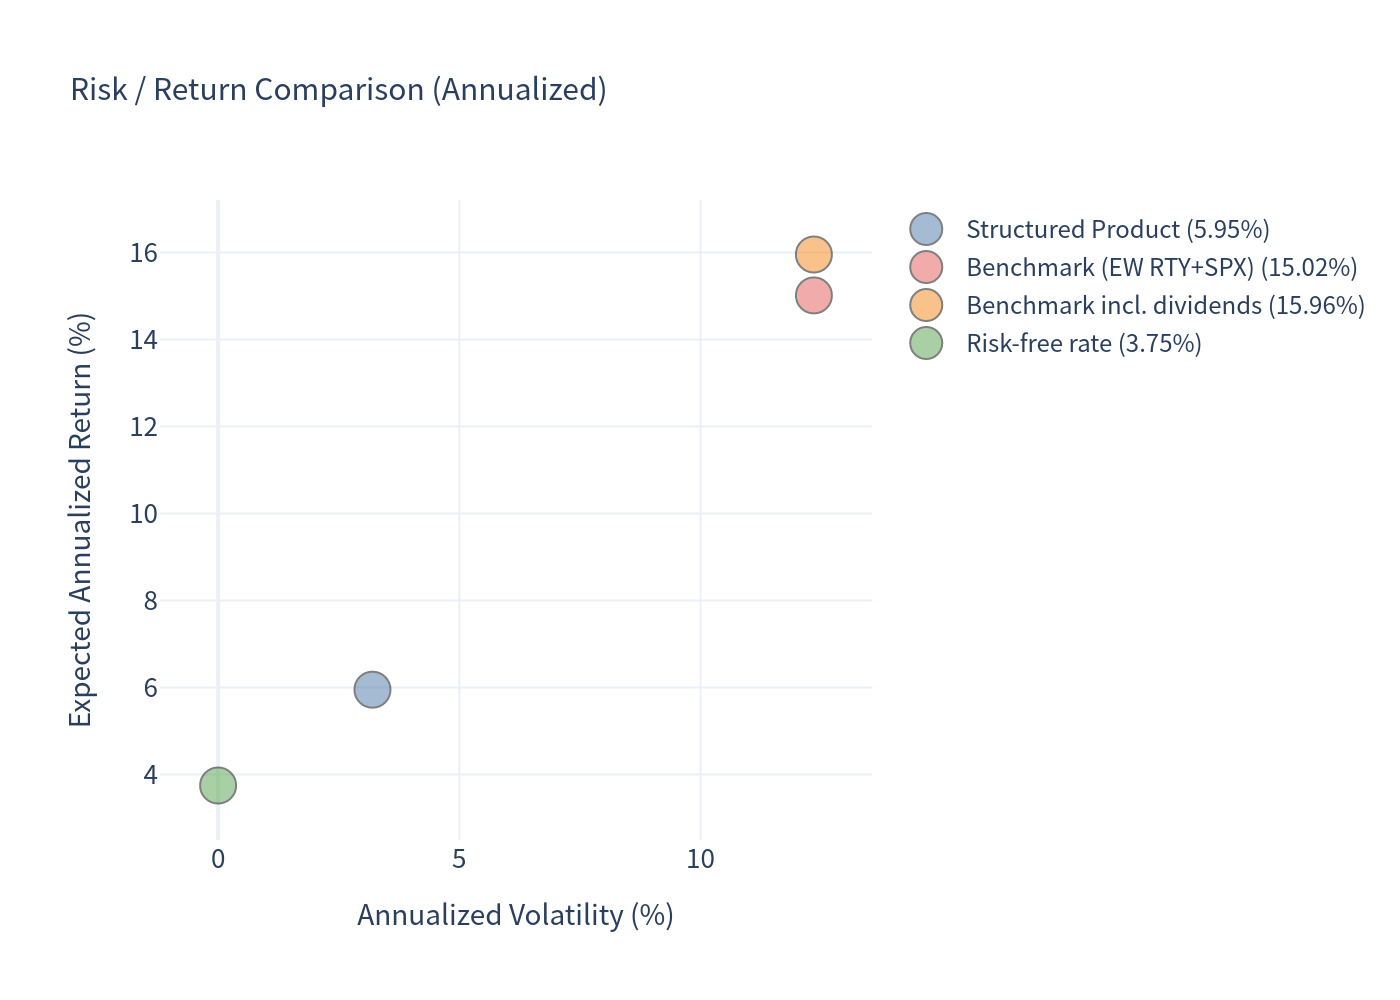
The product sits far to the left (much lower volatility) of the benchmark but also below it on return. It sits above the risk-free rate, offering a modest risk premium for the capped worst-of exposure.
Annualized return box plot
Holding-period distribution
Investment Commentary
Potential merits
- Full principal protection at maturity — a 0% loss probability and 0% one-year VaR in the simulation; the structure removes maturity downside risk entirely (subject to issuer/guarantor credit).
- Positive expected return with very low volatility. The expected annualized return of ~5.95% compares favourably with the 3.75% risk-free rate, and in ~75% of simulations the note beats cash.
- Attractive outcomes if called early. In ~34% of paths the note is redeemed at the first redemption date (month 12) for ≈ +8.25%, i.e., a high-single-digit return in year one with no downside.
- Upside participation in the worst-of return (capped mainly by the call schedule), so it behaves well if the two indices rise together but modestly.
Considerations / trade-offs
- Capped upside and significant opportunity cost. The discretionary call truncates the payoff in the majority of paths: the product's maximum annualized return observed is ~10.3%, versus a benchmark that averages ~15% annualized. Over the whole simulation the product materially underperforms a passive equal-weight holding.
- Worst-of linkage. Tying the payoff to the weaker of the S&P 500® and Russell 2000® reduces the upside relative to a single-index (or basket-average) structure; if either index lags, the investor earns nothing above par.
- "Flat" is a real risk. In ~16% of simulations the note matures at par after five years — capital is returned but earns 0% total over the full term (a real cost in real terms).
- No income. There is no coupon; investors needing regular cash flow are not compensated in the interim.
- Call timing is at the issuer's discretion, modelled here via risk-neutral optimal stopping; it will generally trigger whenever the note becomes expensive for the issuer — i.e., just when the investor would most like to remain invested.
All figures are simulation-based (10,000 monthly Monte-Carlo paths, GJR-GARCH dynamics with fat tails) and are not a forecast. Returns are expressed on a 100-point notional base. This material is for analysis only and is not investment advice.