
Structured Product Analysis
1. Headline Simulation Results
Based on 10,000 Monte-Carlo simulations of the three defense stocks over the product's life:
| Headline metric | Result |
|---|---|
| Expected annualized return | 6.14% |
| Probability of a negative return | 18.53% |
| 99% confidence 1-year VaR | −45.40% |
| Expected holding period | 9.70 months |
| Expected total (non-annualized) return over the realized holding period | +3.45% |
2. Basic Product Information & How It Works
This is a yield-enhancement product (a Multi Barrier Reverse Convertible) linked to the worst-performing of three European aerospace & defence stocks — Hensoldt AG, Leonardo S.p.A. and Thales S.A. It pays a fixed 14.00% p.a. coupon (3.50% quarterly = CHF 35 per CHF 1,000) and is denominated in CHF with “Quanto” currency protection (the payoff does not depend on EUR/CHF moves).
In layman's terms
- You collect a high fixed coupon (14% p.a.) for as long as you hold the product, regardless of how the three shares perform — the coupon is paid whether or not markets fall.
- In exchange you sell downside protection with a barrier set at 59% of each share's starting price. If at any time during the 12-month life any one of the three shares trades at or below 59% of its start level (the Barrier Event), the “insurance” disappears.
- At maturity:
- If no barrier was ever touched → you get your capital back (100%) plus all coupons.
- If the barrier was touched but the worst share is back at/above its start level → you still get 100%.
- If the barrier was touched and the worst share finishes below its start level → you receive that worst share (in cash equivalent), i.e. you absorb its full fall to the downside.
- Upside is capped — a large rally still only returns your capital plus the coupons.
- The issuer may call (redeem early) the note after 6 months and after 9 months at par plus the coupon; the product then ends.
Because the payoff is driven by the worst of the three names, the effective risk is higher than holding any single name; and because the coupon is fixed while the downside is uncapped below the barrier, the profile is the classic “high income for conditional downside protection” trade-off.
3. Key Statistics — Structured Product vs. Benchmark
Benchmark = equal-weight basket of the three underlying shares (price + dividend, dividend yield ≈ 1.25%).
| Metric | Structured Product | Benchmark Basket (total return) |
|---|---|---|
| Expected annualized return | 6.14% | 14.93% |
| Expected annualized volatility | 16.97% | 37.82% |
| Probability of loss | 18.53% | 39.76% |
| 99% confidence 1-year VaR | −45.40% | −48.64% |
4. Charts
4.1 Simulation outcomes — product vs. benchmark
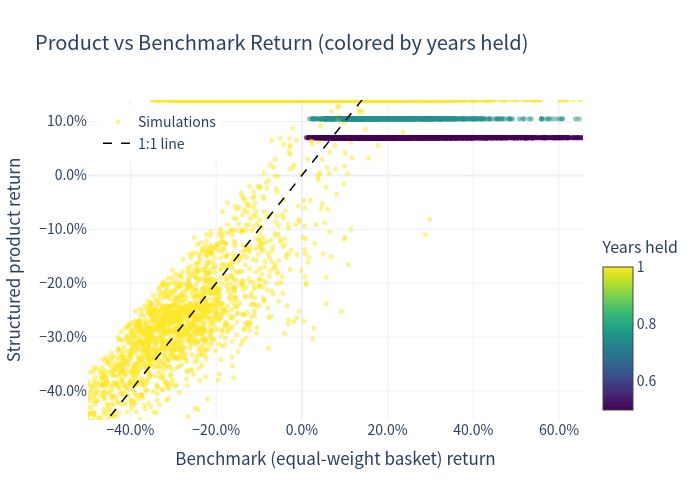
Each point is one simulation; colour shows how many years the note was held. Points on the diagonal would mean the product replicated the basket. In the central region the product sits above the 1:1 line (the coupon adds return on top of a small move), while in the deep-left tail the worst-of structure causes the product to track the full downside of the single worst share once the barrier is breached.
4.2 Return distributions
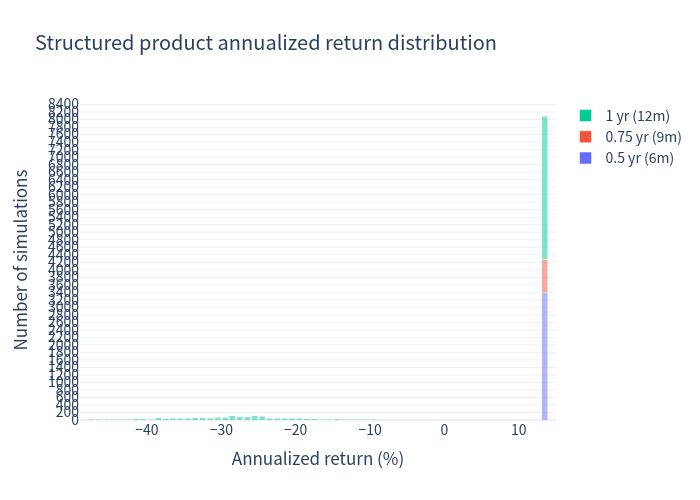
The product's return is heavily concentrated at the coupon level (≈14% annualized) — the majority of paths simply earn the coupon — with a distinct left tail where the barrier was breached.
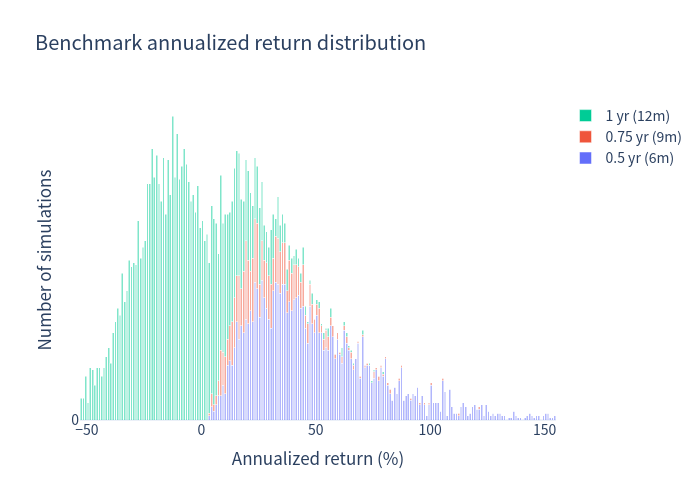
The benchmark basket's distribution is far wider and roughly symmetric around a higher mean, reflecting full equity participation (no cap).
4.3 Scenario probabilities
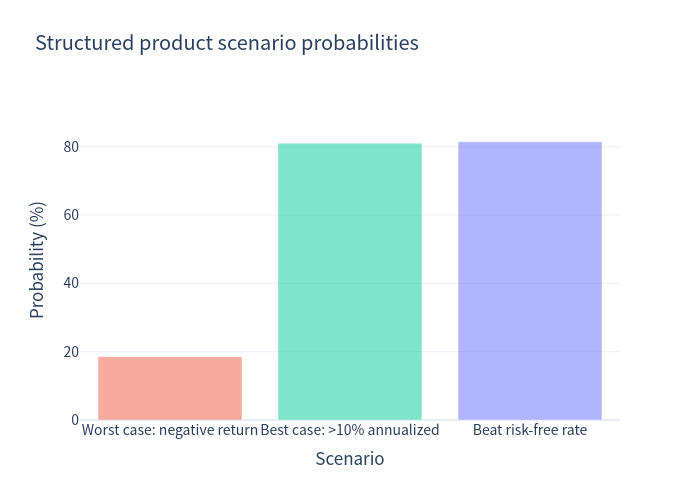
- Worst case (negative return): 18.53%
- Best case (>10% annualized): 81.05%
- Beats the risk-free rate: 81.47%
4.4 Risk / return positioning
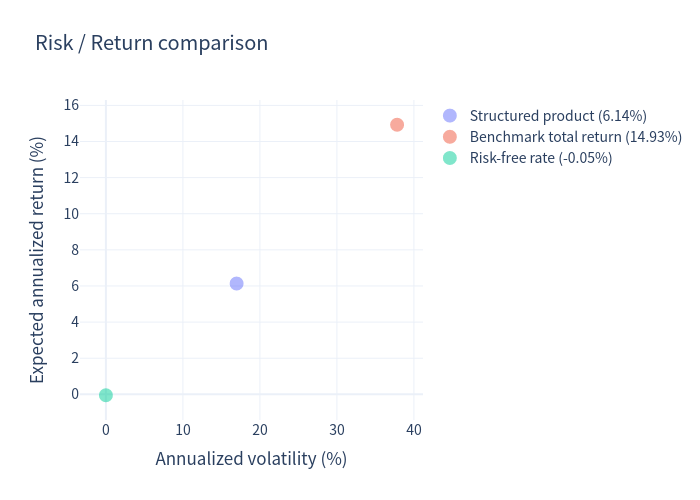
The product sits well to the left of the basket (much lower volatility) at a lower expected return — a more “cushioned” but lower-beta exposure.
4.5 Annualized return comparison (box plot)
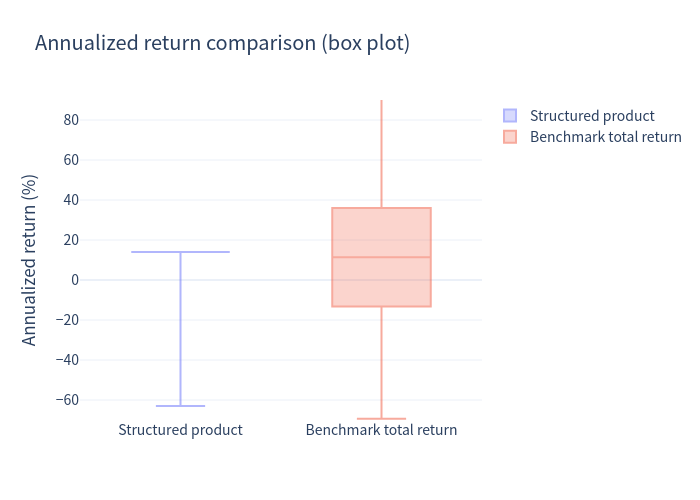
The product's box is compressed at ≈14% (the coupon cap), whereas the basket's box is wide, spanning strongly negative to strongly positive outcomes.
4.6 Holding-period and coupon distribution
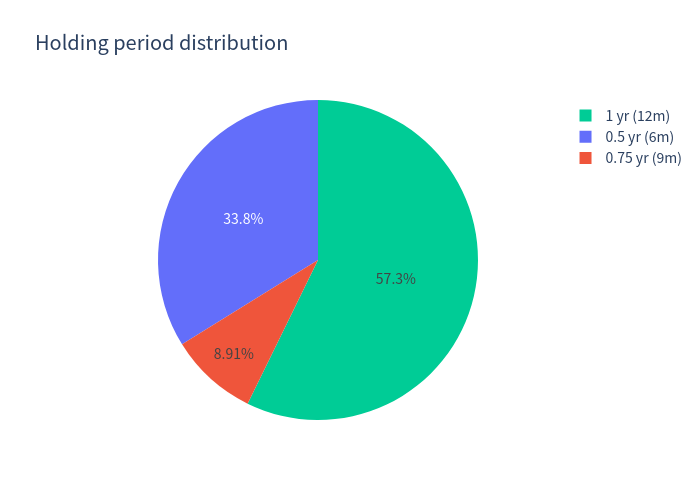
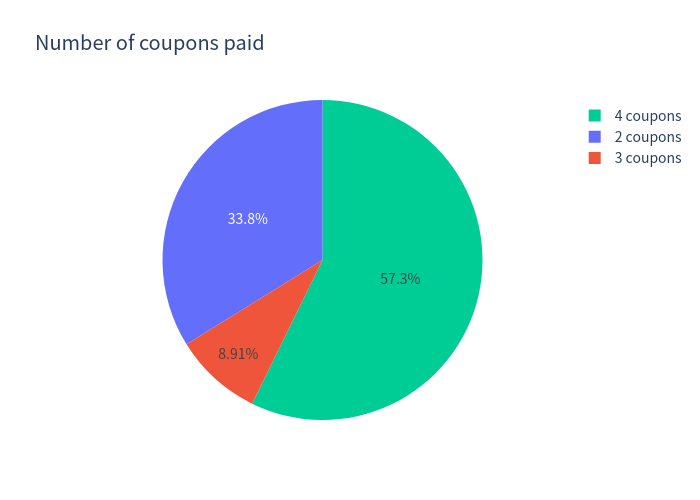
The note is called early in ~43% of paths (33.84% after 6 months, 8.91% after 9 months) and held to maturity in 57.25%.
5. Investment Commentary
Potential merits
- High headline income: 14.00% p.a. paid quarterly, received while the product is alive and irrespective of interim market moves.
- Deep conditional protection: the 59% barrier leaves a ~41% cushion; in roughly 80% of simulations no barrier is breached and capital is returned at par.
- Smoother ride: expected volatility (16.97%) and probability of loss (18.53%) are materially lower than the underlying basket (37.82% / 39.76%).
- Quanto CHF: removes EUR/CHF currency risk on the payoff.
Risks to be aware of
- Capped upside: no participation above par + coupons, even in a sharp rally.
- Digital, worst-of downside: once the barrier is touched, the loss is driven by the single worst of the three shares — a full, uncapped (to zero) equity loss below the strike.
- Comparable tail loss: despite the coupon, the 99% VaR (−45%) is close to that of the basket (−49%).
- Callability / reinvestment risk: the issuer's right to call after 6 and 9 months shortens the average life to ~9.7 months and can force reinvestment at lower rates.
- Issuer credit risk (Leonteq, Fitch BBB−) — the coupons and capital depend on the issuer's ability to pay.
6. Notes on Interpretation
- Expected annualized figures are means of per-simulation CAGR; because many paths are redeemed after only 6–9 months, annualizing short holding periods can produce exaggerated-looking rate figures. They should be read together with the expected total return (+3.45%) and the expected holding period (9.7 months).
- All figures are in index points (100 = notional); returns are shown as percentages.
- A sensitivity assuming no early redemption (held the full 12 months) gives essentially the same result (expected annualized return 5.95%, probability of loss 18.98%, VaR99 −45.41%), so the conclusions are not sensitive to the issuer-call assumption.