
13.00% p.a. Multi Barrier Reverse Convertible (Callable) — Simulation Analysis
Headline Simulation Results
Product Overview & How It Works (Layman)
This is a 13.00% p.a. fixed-coupon note linked to the worst performer of three Swiss stocks (Kuehne + Nagel, Sulzer, VAT Group). It pays a generous coupon every quarter regardless of how the stocks move, in exchange for the investor taking downside risk on the weakest of the three names.
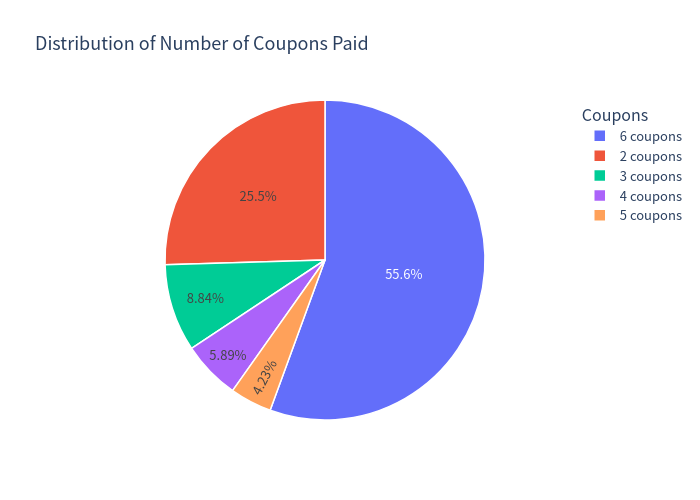
- Coupon: 13.00% p.a. (six quarterly coupons of CHF 32.50 per CHF 1,000, i.e. 3.25 points each; 19.5 points total if held to maturity).
- Downside protection (barrier 59%): If no stock ever trades at or below 59% of its starting level (observed continuously over the ~18-month life), capital is returned in full (100%).
- Knock-in risk: If any one stock touches the 59% barrier, protection is removed. At maturity you then receive par only if the worst-performing stock recovers to ≥100%; otherwise you are effectively delivered that worst stock and absorb its loss (value ≈ 100% × worst-stock performance).
- Issuer call: The issuer may redeem early (at par + the due coupon) on any of four quarterly observation dates. Calls typically happen when the worst-of is at/above its starting level — i.e. you get forced out precisely when the market is strong, capping your upside.
- Upside is capped: Beyond the fixed coupons, you do not participate in any rally.
Key Statistics (Annualized, per-horizon)
| Metric | Structured Product | Underlying Basket (total return)* |
|---|---|---|
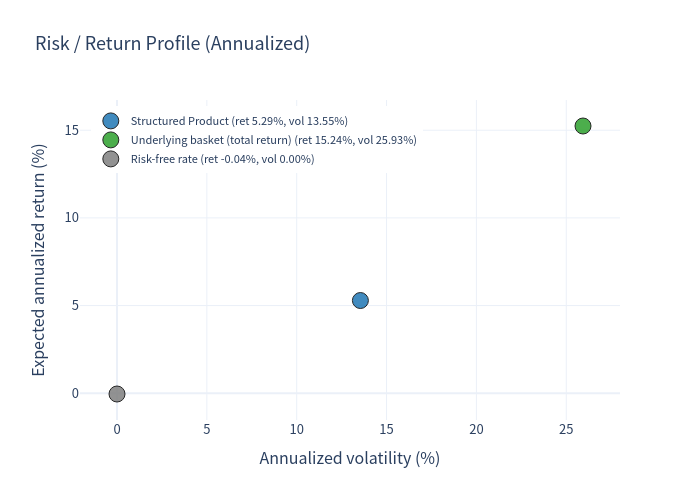
| Expected annualized return | 5.29% | 15.24% |
| Expected annualized volatility | 13.55% | 25.93% |
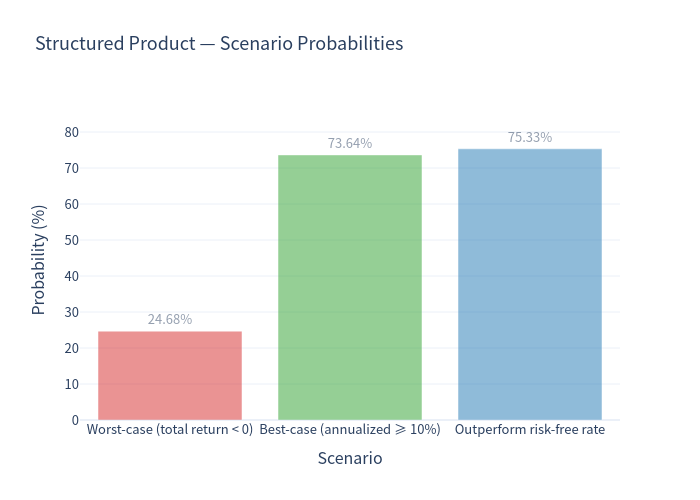
| Probability of loss | 24.68% | 31.94% |
| 99% confidence VaR (1-year) | -32.94% | -28.64% |
* Equal-weight basket of the three stocks, including blended dividend yield (~2.24%). The basket's high per-horizon annualized return is not a full-period figure — see note.
Reading the numbers together: The structured product delivers a lower expected return than simply holding the basket, but with roughly half the volatility (13.55% vs 25.93%). Over the realized holding period the product's average total return is 3.77% versus 6.51% for the basket, and its worst-tail VaR (-32.94%) is only marginally deeper than the basket's (-28.64%) — a consequence of the worst-of barrier, which is harsher than a plain basket.
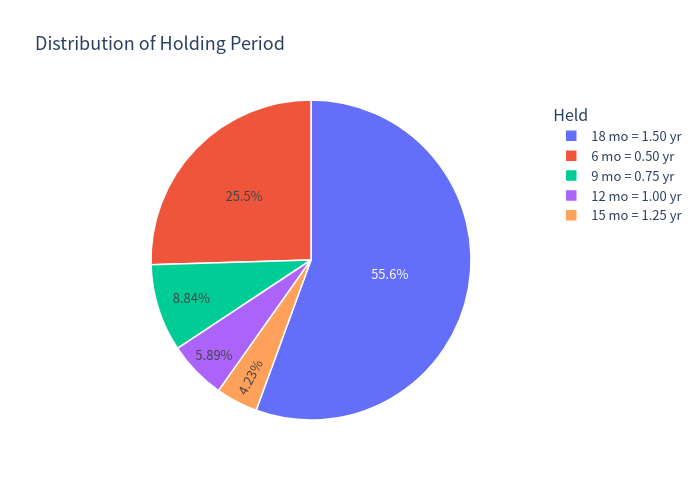
Note on annualization: ~44% of paths terminate early (called) during strong rallies; linearly annualizing those short holding periods inflates both instruments' mean annualized returns. As a sanity check, a fixed 18-month buy-and-hold of the basket averages ≈5.1% annualized price return (~7.3% with dividends), in line with the ~6% equity risk premium assumed.
Charts
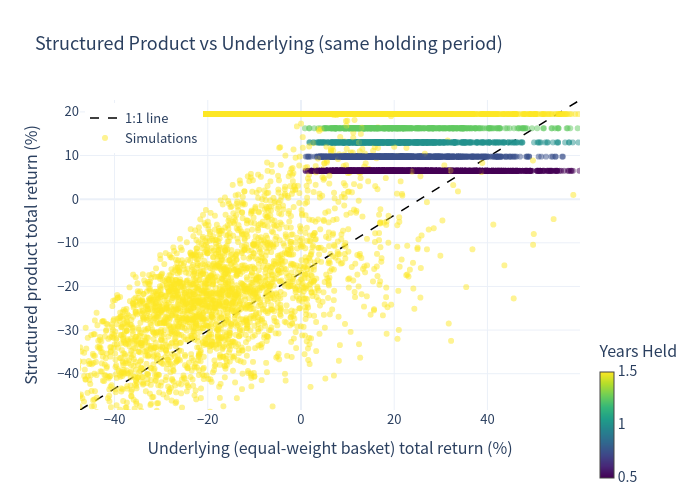
Simulation Outcomes — Product vs Underlying (per-path, same holding period)
Each dot is one simulation; the diagonal is the 1:1 line. Points below the line are paths where the product underperformed the basket; the dense cluster near the top-left reflects the capped, coupon-driven return profile.
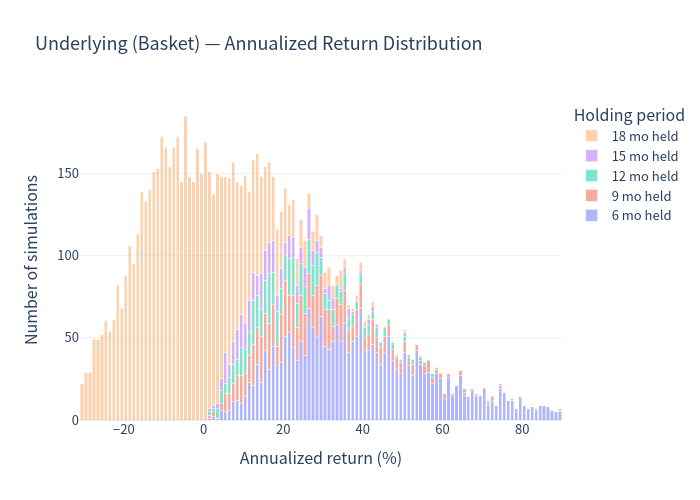
Annualized Return Distribution — Underlying Basket
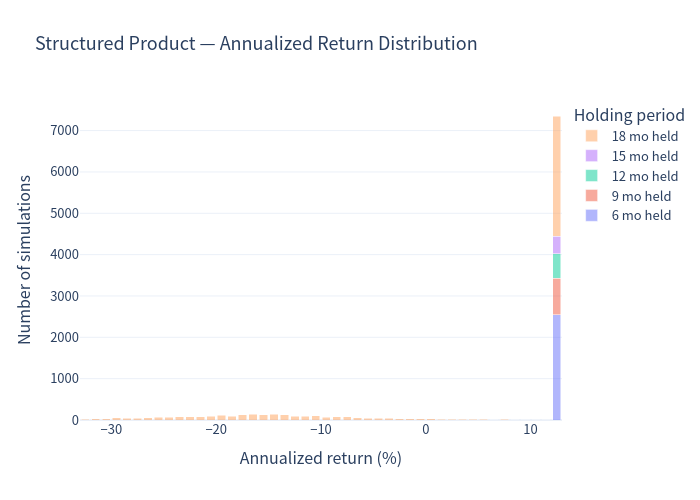
Annualized Return Distribution — Structured Product
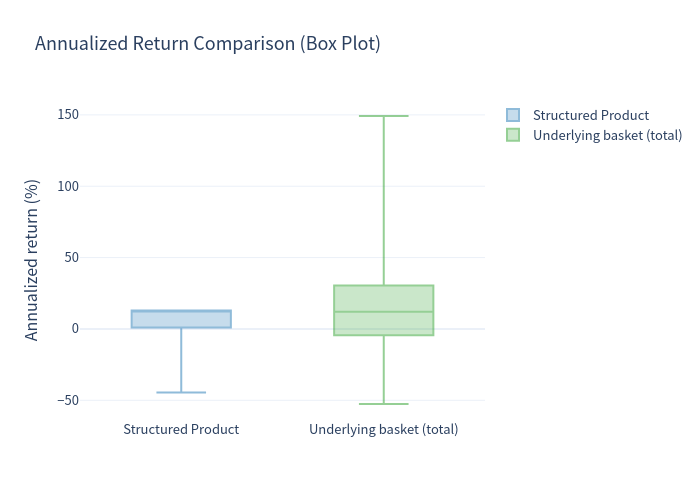
A tight distribution: outcomes are capped near ~+13% annualized (full coupons) with a fat left tail when the barrier is triggered.
Scenario Probabilities
Risk / Return Profile
The product sits far left of the basket: lower expected return, but materially lower volatility.
Annualized Return Comparison (Box Plot)
Holding Period Distribution
Number of Coupons Paid
Investment Commentary
Considerations / risks
- Capped upside: investors forgo rallies above the fixed coupon; in strong markets the basket clearly out-earns the note.
- Worst-of downside: loss tracks the weakest of three correlated (0.32–0.40) stocks; a single name breaching 59% removes protection for the whole note.
- Discretionary issuer call: the issuer can force early redemption, so the attractive coupon may not run for the full term.
- Credit exposure to the issuer/guarantor (Leonteq / PostFinance) and a hard downside tail (99% VaR ≈-32.94% annualized) — capital is at risk.
Potential merits