
Morgan Stanley Market-Linked Notes (due Aug 29, 2030) — Simulation Report
Headline Results
| Metric | Value |
|---|---|
| Expected annualized return | 5.79% |
| Expected total return over 4-year term | 26.09% |
| Probability of negative returns | 0.00% |
| 99% confidence VaR (1 year) | 0.00% |
| Expected holding period | 48 months (4 years, fixed) |
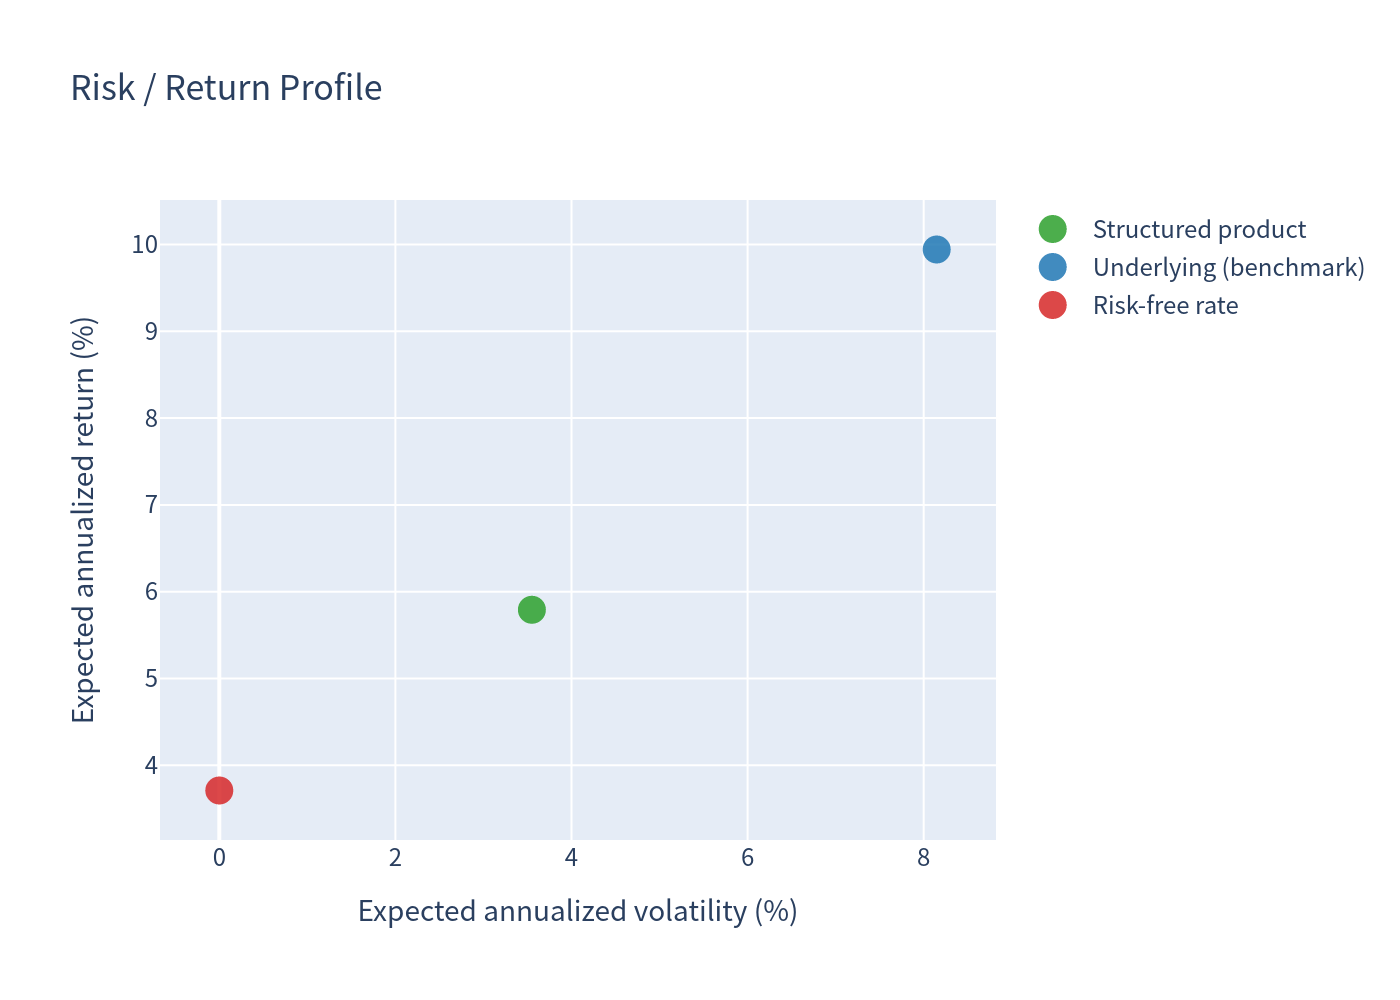
| Expected annualized volatility | 3.55% |
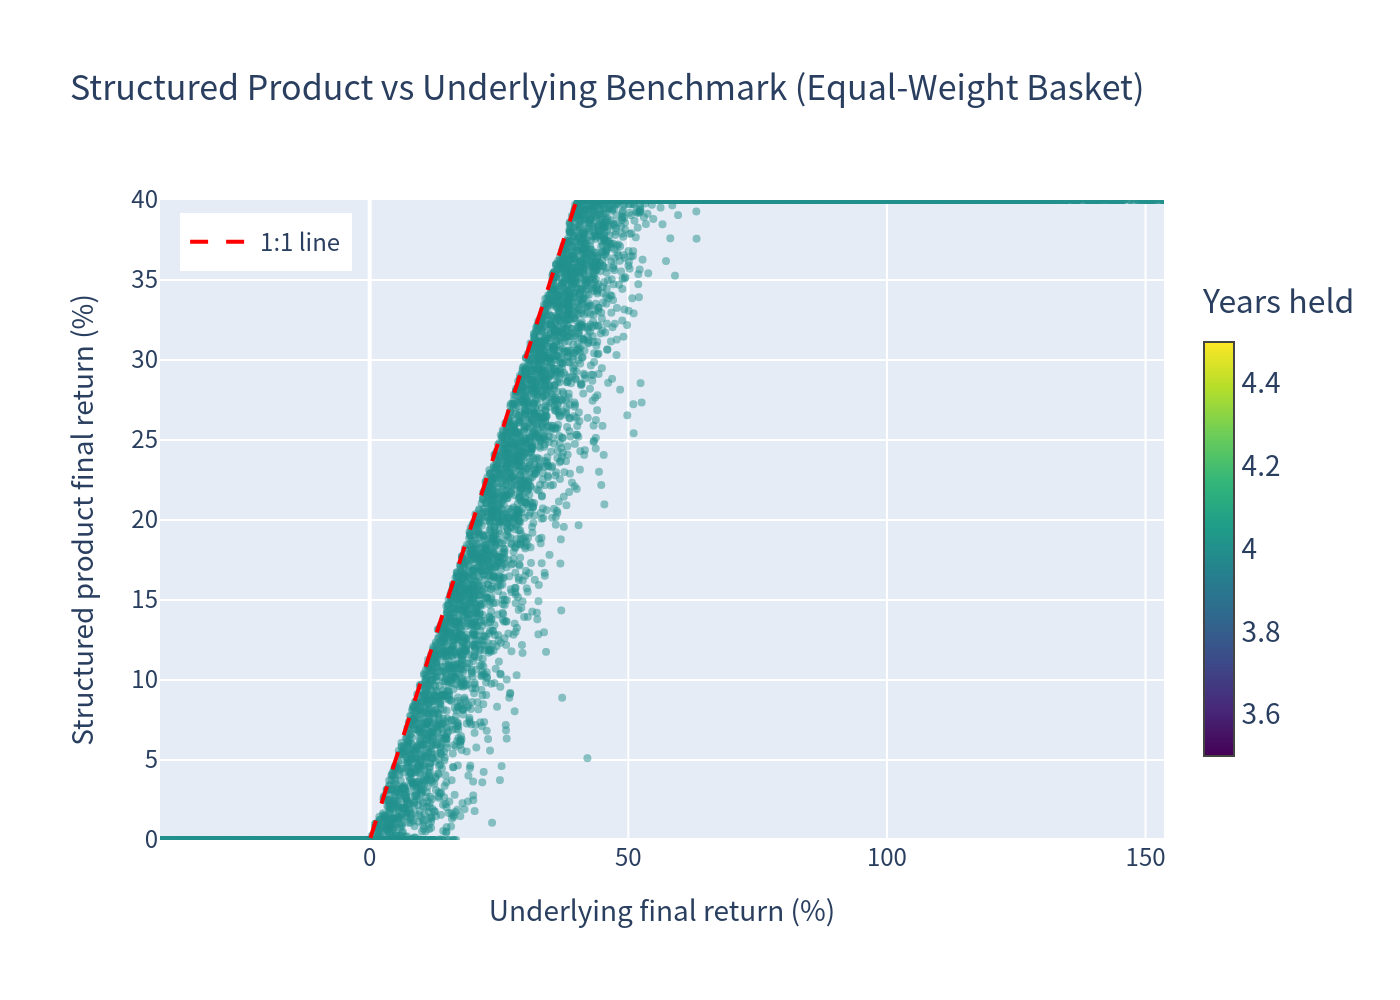
The note is principal protected at maturity: in no simulated scenario did the product return less than its initial value, so the probability of loss is zero and the 1-year 99% VaR is 0.00%. The cost of this protection is a capped upside — the maximum payment is assumed at 140% of par (40% total return), reached in approximately 46.2% of simulations.
Basic Product Information
| Issuer | Morgan Stanley Finance LLC (fully guaranteed by Morgan Stanley) |
| Type | Market-Linked Notes (principal-protected growth note, zero coupon) |
| Underlyings | Dow Jones Industrial Average (DJIA) and S&P 500 Index — payoff depends on the worst performing of the two |
| Term | Aug 31, 2026 → Aug 29, 2030 (48 months, single observation at maturity) |
| Upside participation | 100% of the worst performing underlier's gain, capped at the maximum payment at maturity ($1,375–$1,425 per note; midpoint $1,400 = 140% of par assumed) |
| Coupons / early redemption | none |
How It Works (layman's explanation)
- You invest $1,000 per note and hold for 4 years. The note pays no interest along the way.
- At maturity (Aug 2030), the performance of both the Dow Jones and the S&P 500 is measured against their start levels.
- Upside case: if both indices finish above their start levels, you receive your $1,000 back plus 100% of the gain of the weaker index — but the total gain is capped (assumed +40% maximum).
- Flat/down case: if either index finishes at or below its start level, you simply receive your $1,000 back — a 0% return on the note.
- In all cases you receive at least the stated principal amount at maturity.
Key Statistics (simulated, annualized)
| Metric | Structured Product | Underlying Benchmark* |
|---|---|---|
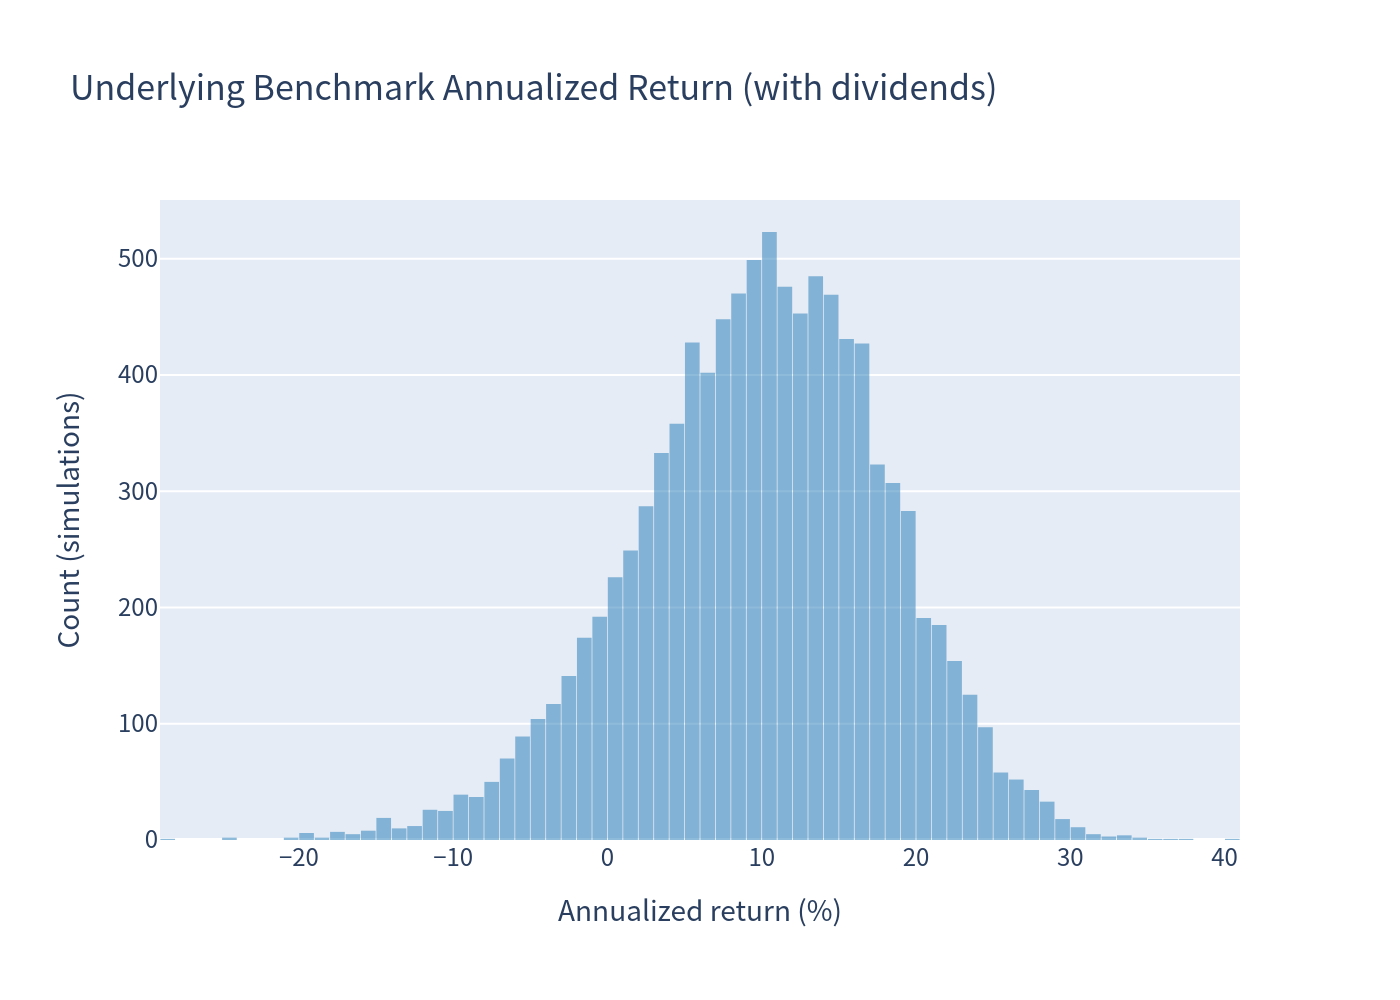
| Expected annualized return | 5.79% | 9.94% |
| Expected annualized volatility | 3.55% | 8.15% |
| Probability of loss | 0.00% | 11.38% |
| 99% confidence VaR (1 year) | 0.00% | −11.00% |
*Equal-weight basket of the Dow Jones and S&P 500 (both underlyings), including an estimated average dividend yield of 1.19% p.a.
Scenario Probabilities (structured product)
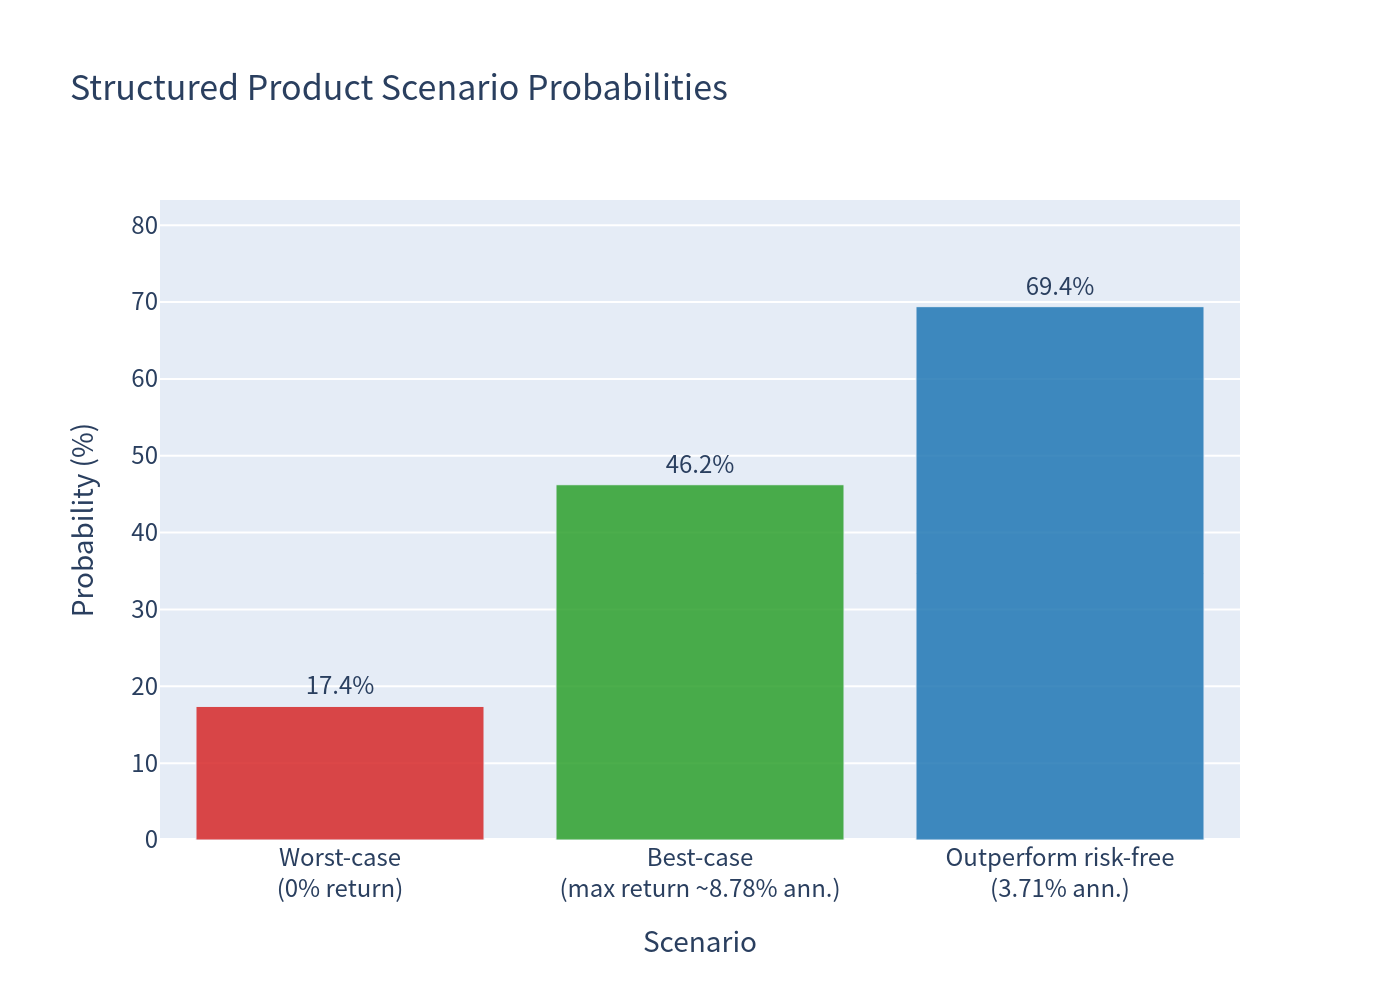
- Zero return (worst case, par payoff): 17.4%
- Maximum return (cap of +40% reached): 46.2%
- Positive return (upside payoff): 82.6%
- Outperform the risk-free rate (3.71% p.a.): 69.4%
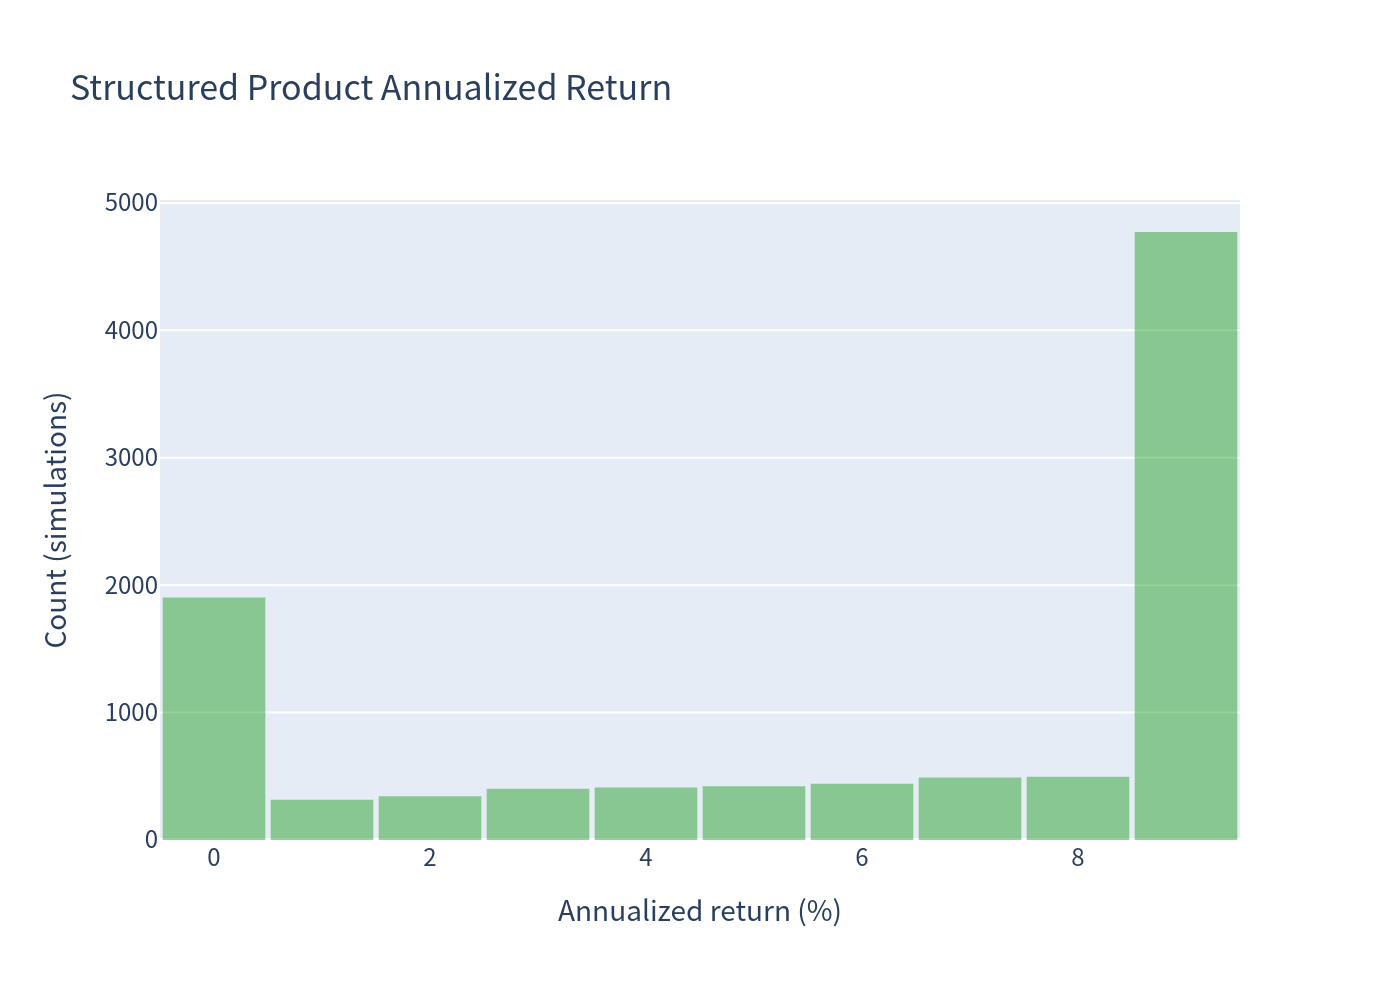
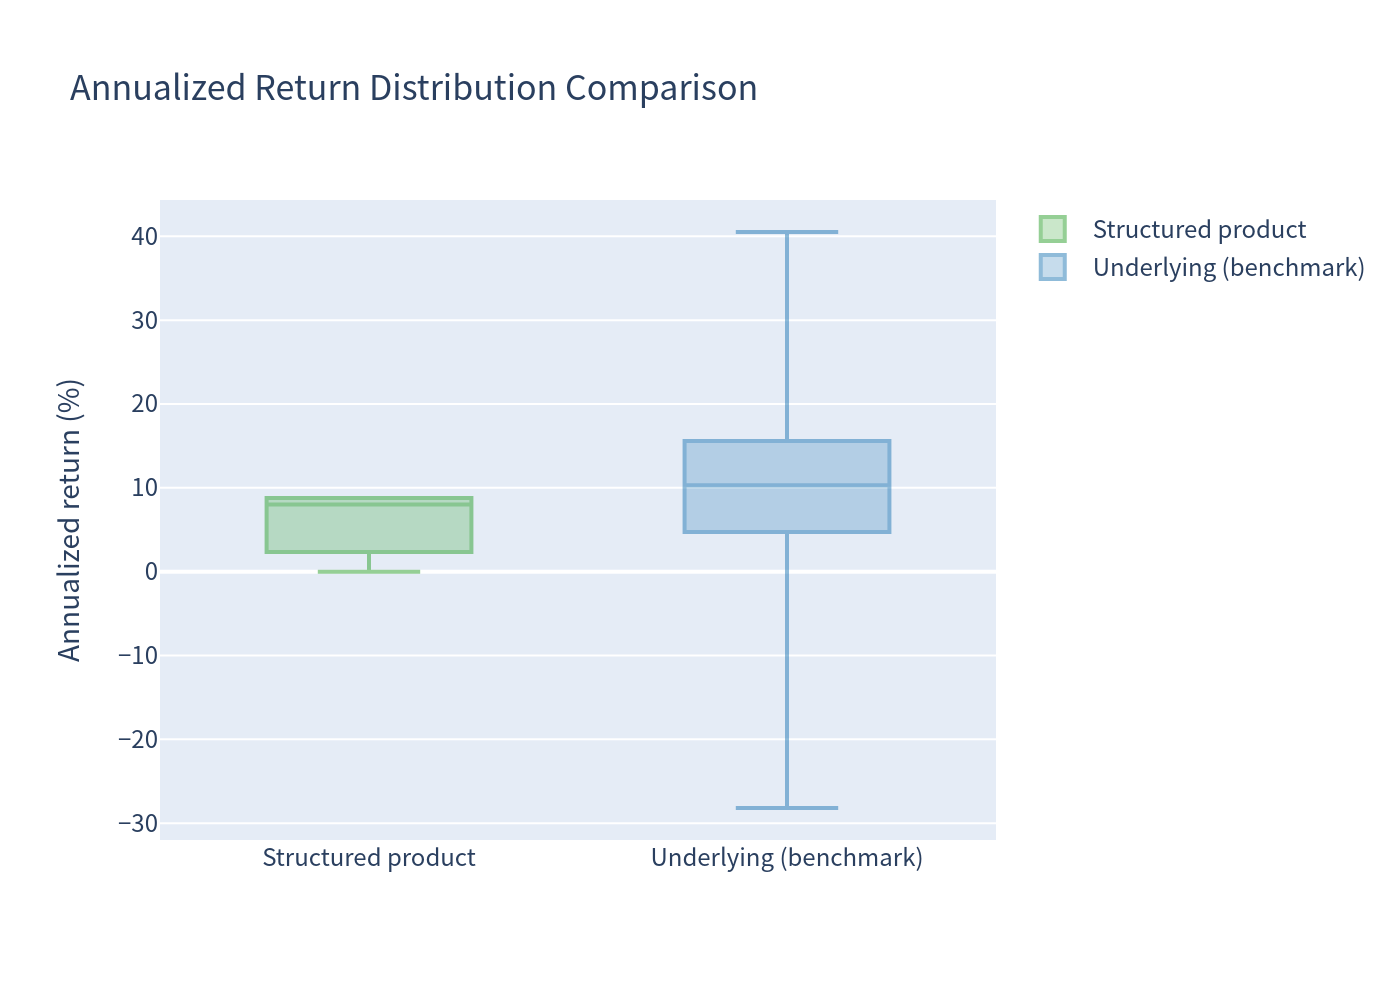
Distribution shape: the product's annualized return distribution is bounded between 0% and 8.78% (the cap). Median annualized return is 8.01%, with 25th–75th percentile range of 2.33%–8.78%.
Charts
Simulation Outcomes — Structured Product vs Underlying Benchmark
Scatter of simulated annualized returns for the note versus the underlying benchmark.
Annualized Return Distribution — Underlying Benchmark (with dividends)
Distribution of simulated annualized returns for the equal-weight equity basket.
Annualized Return Distribution — Structured Product
Distribution of simulated annualized returns for the principal-protected note.
Scenario Probabilities
Bar chart of scenario probabilities: zero return, maximum return, positive return, and outperformance of the risk-free rate.
Risk / Return Profile
Risk-return scatter positioning of the structured product relative to the underlying benchmark and risk-free rate.
Annualized Return Box Plot Comparison
Box plot comparing the distribution of annualized returns between the structured product and the underlying benchmark.
Investment Commentary
What the simulation shows
- The note converts the equity risk of the two largest US indices into a principal-protected, capped-return profile. Expected annualized return of 5.79% is comfortably above the risk-free rate (3.71%), and the note never loses money at maturity.
- Relative to a direct investment in an equal-weight basket of the two indices (9.94% expected annualized with dividends), the note gives up roughly 4.15% of expected return in exchange for eliminating downside risk and cutting volatility from ~8.15% to ~3.55%.
- Because the payoff is worst-of, a flat or negative finish in either index results in a 0% return even if the other index rises strongly — this occurred in ~17.4% of simulations.
- The upside cap binds frequently in the simulated distribution (46.2% of paths reach +40% total), so in strong bull markets the note behaves like a fixed ~8.78% p.a. asset.
Pros
- Full principal protection at maturity — no simulated loss scenario; 1-year 99% VaR of 0.00%.
- Attractive convexity in flat-to-moderately-rising markets: 100% participation in the weaker index's gain up to the cap.
- Lower volatility (3.55% p.a.) than direct equity exposure (~8.15% p.a.).
- Positive expected return above the risk-free rate in the base simulation.
Cons
- Upside is capped (~40% total return), forfeiting gains beyond the cap in strong bull markets (46.2% of simulations hit the cap).
- Zero coupon / no current income — the note pays no interest, and a 0% maturity return still loses to cash-like instruments over 4 years.
- Worst-of structure means one lagging index can eliminate the entire upside (17.4% of simulations finish at par).
- Issuer credit risk — payments depend on Morgan Stanley's ability to pay, though the notes are guaranteed by Morgan Stanley.
- Fixed 4-year lock-up with no early redemption or liquidity features.