
Morgan Stanley SPXFP Callable Jump Notes due October 30, 2031 — Simulation Analysis
Headline Simulation Results
| Metric | Result |
|---|---|
| Expected annualized return | 12.23% |
| Expected total return (over the realized holding period) | 25.39% |
| Expected holding period | ~2.53 years |
| Probability of a negative return | 0.00% (principal protected) |
| Probability of finishing exactly flat at par (0% return) | 8.80% |
| 99% confidence 1-year VaR | 0.00% |
| Probability of outperforming the risk-free rate (3.81%) | 86.32% |
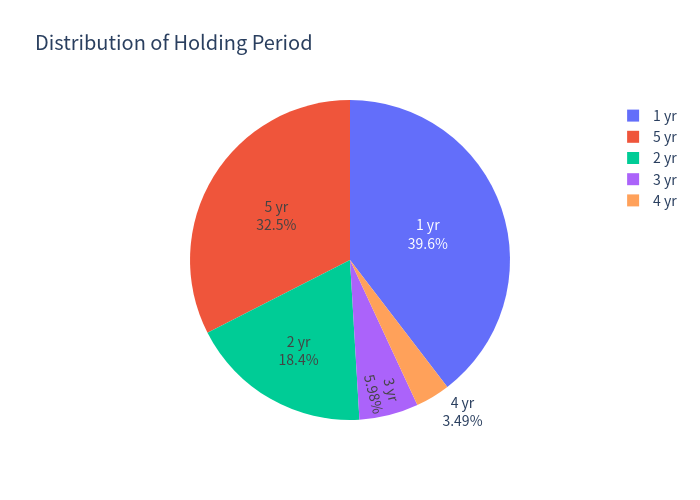
The notes are principal protected, so no scenario produces a loss of capital. The traded risk is opportunity cost: in 8.80% of scenarios the index finishes at or below its starting level and the investor receives exactly par after holding the full 5 years (a 0% return). The product is usually redeemed early — the issuer-optimal call fires in 72.51% of scenarios.
Basic Product Information
- Issuer / Guarantor: Morgan Stanley Finance LLC / Morgan Stanley (credit risk applies).
- Underlying: S&P 500® Futures Excess Return Index (SPXFP) — a single index; the payoff depends on this one underlying only.
- Principal: $1,000 per note; USD; no FX/quanto features.
- Coupon: None — the notes pay no interest.
- Upside: 140% participation in the positive performance of the index.
- Downside: Principal is returned in full if the index is flat or down at maturity.
- Callable: The issuer may redeem the notes monthly, beginning after one year, at pre-set prices that rise over time.
How it works (layman's explanation)
The note is a "participate up, protect down" structure with an issuer redemption option.
- If the index rises and the note is not called: at maturity the investor receives $1,000 plus 140% of the index gain (e.g. an index gain of +20% pays $1,280).
- If the index falls: the investor still receives the $1,000 principal back at maturity.
- Early redemption: starting one year in, the issuer can call the notes on any monthly date. The call price grows from $1,157.50 (≈ +15.75%) at the first date to $1,774.38 (≈ +77.4%) at the last date — a straight-line accrual of roughly 15.75% per year on the principal. The issuer redeems whenever it is economically cheaper for them than continuing the note, which effectively caps the upside and usually shortens the investment. Because the call price accrues at a high rate and is only triggered on a risk-neutral-rational basis, the notes behave like a high-yielding, capped, principal-protected instrument.
Key Statistics
| Series | Expected annualized return | Expected annualized volatility | Probability of loss | 99% VaR (1 year) |
|---|---|---|---|---|
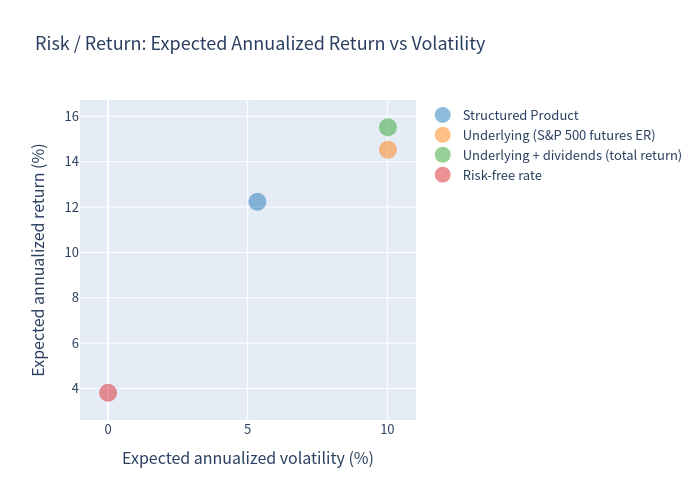
| Structured Product | 12.23% | 5.35% | 0.00% | 0.00% |
| Underlying (S&P 500 futures ER, price) | 14.53% | 10.02% | 8.80% | −10.36% |
| Underlying + dividends (total return) | 15.52% | 10.02% | 7.50% | −9.37% |
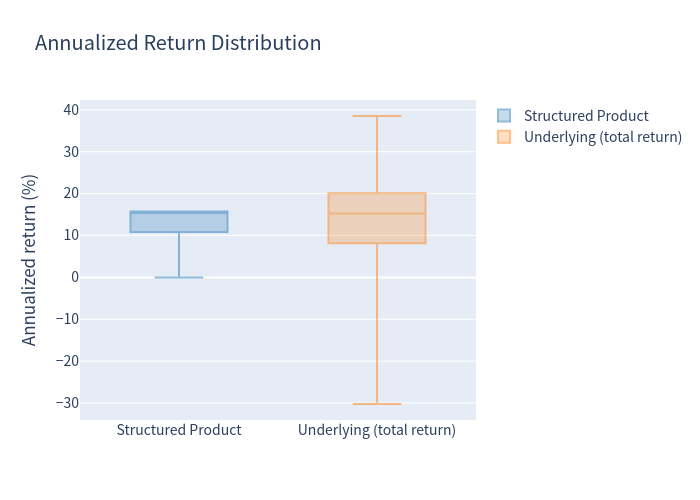
The structured product delivers roughly half the volatility of the underlying and a hard floor at par, but a lower expected return because the issuer's call caps the upside. Because many scenarios are redeemed within one to two years, annualized figures for short holds can look elevated; the median total return is 15.75% versus a mean of 25.39%.
Charts
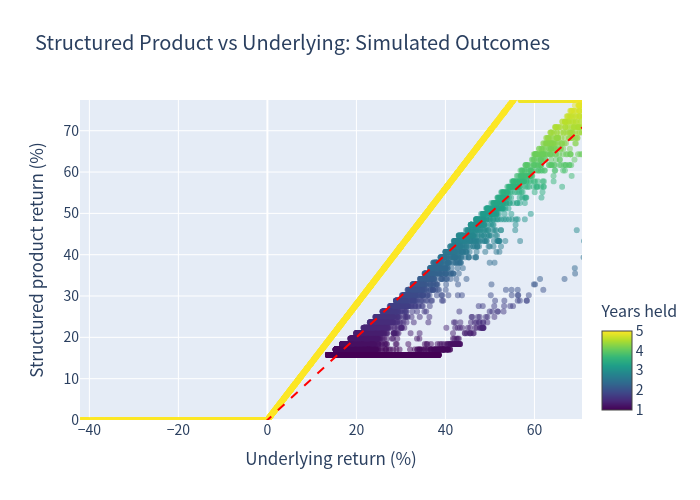
Simulated outcomes — product vs underlying (colour = years held)
A scatter of product outcomes against underlying outcomes, coloured by the number of years the note was held.
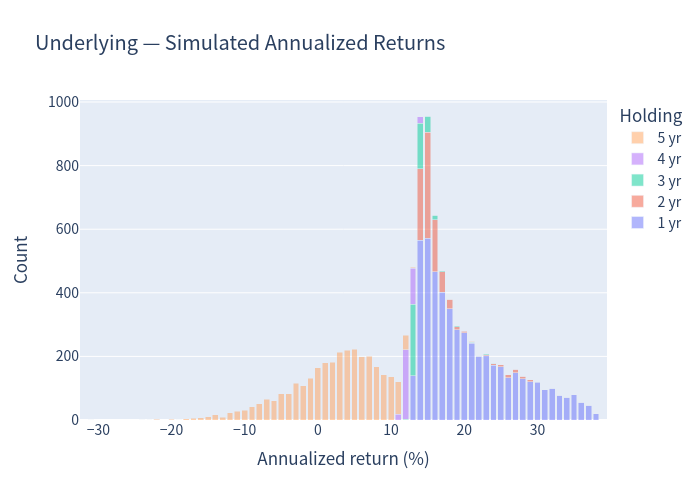
Underlying — simulated annualized returns (1% bins, stacked by holding period)
Distribution of annualized returns for the S&P 500 futures excess return index across simulated scenarios.
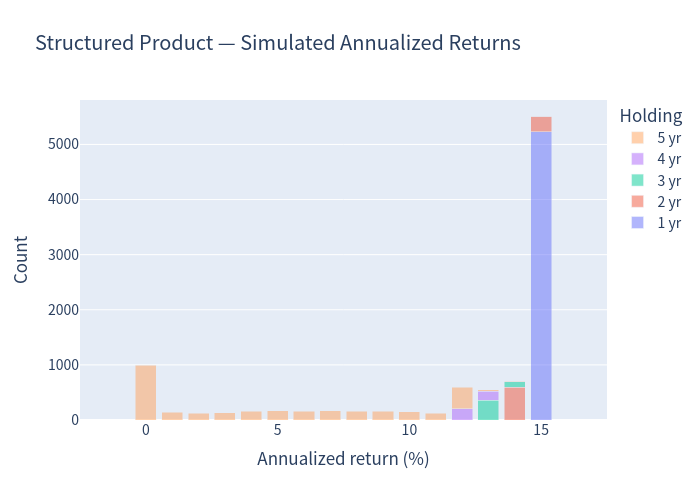
Structured product — simulated annualized returns (1% bins, stacked by holding period)
Distribution of annualized returns for the structured product, stacked by the holding period realised in each scenario.
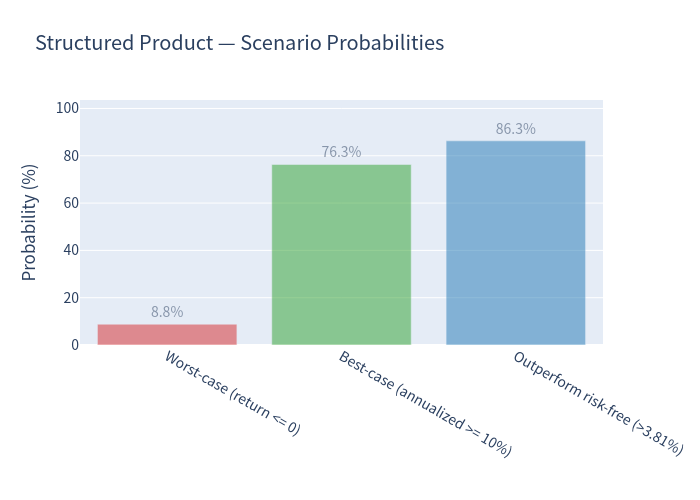
Scenario probabilities
Probabilities of the key simulated outcomes, including early redemption, flat-at-par maturity and outperformance of the risk-free rate.
Risk / return
Expected annualized return plotted against expected annualized volatility for the product and the underlying series.
Annualized return distribution (box plot)
Box plot comparison of annualized return distributions across the modelled series.
Distribution of holding period
Share of simulated scenarios by the number of years the notes remain outstanding before redemption or maturity.
Investment Commentary
Favourable features
- Capital protection: principal is returned in every simulated scenario, including a −100% index move; there are no barrier or knock-in conditions.
- Leveraged upside: 140% participation on positive index performance for scenarios that are not called early.
- Lower volatility and no tail below par: expected annualized volatility of ~5.4% versus ~10.0% for the index, and a 99% VaR of 0% versus −10.4% for the index.
- Attractive yield when called: the call prices accrue at ~15.75% per year, so early redemption typically locks in a double-digit annualized return (the expected return is 12.23% p.a. with an 86.3% chance of beating the 3.81% risk-free rate).
Trade-offs to weigh
- Upside is effectively capped. In 72.5% of scenarios the notes are called before maturity, and the product's annualized return is effectively capped near ~15.75% (its maximum), so the investor forgoes the stronger rallies that the underlying captures (hence the product's lower expected return, 12.23% vs 14.5–15.5% for the index).
- Zero-return outcomes. In 8.8% of scenarios the index ends at or below its start and the notes run to full maturity for no return — capital is preserved but idle for five years.
- Early-redemption reinvestment risk. Being redeemed early returns cash at a time when prevailing rates/yields may differ.
- Credit and liquidity risk. Payments depend on Morgan Stanley's creditworthiness, and the notes are not exchange-listed (limited secondary liquidity).