
11.30% p.a. Multi Barrier Reverse Convertible — Performance & Risk Evaluation
Product: Callable Multi Barrier Reverse Convertible (Worst-of) on dormakaba, Georg Fischer and OC Oerlikon — ISIN CH1607614075, CHF, maturity 24/04/2028.
Headline Simulation Results
| Metric | Value |
|---|---|
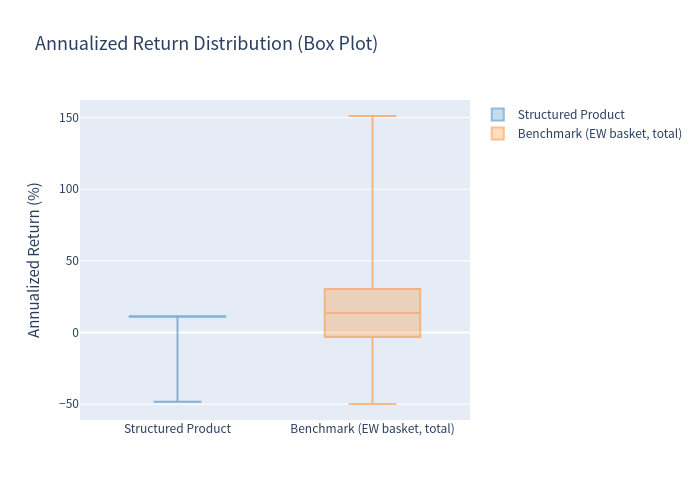
| Expected annualized return | 6.09% (median outcome 11.00%) |
| Expected total return over realized holding period | 5.07% |
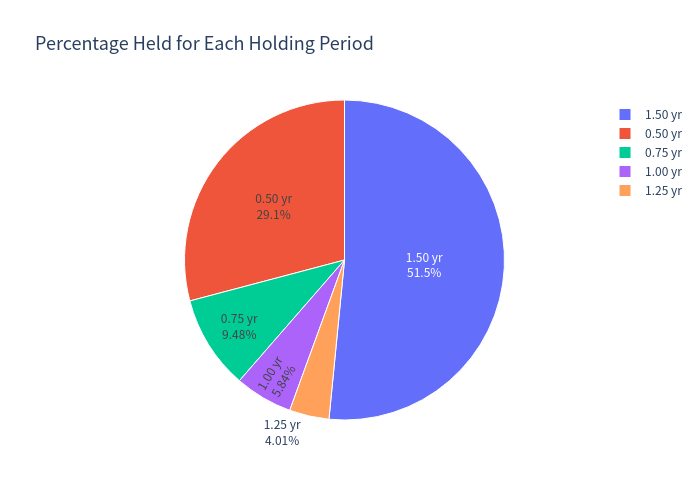
| Expected holding period | 13.18 months (1.10 years) |
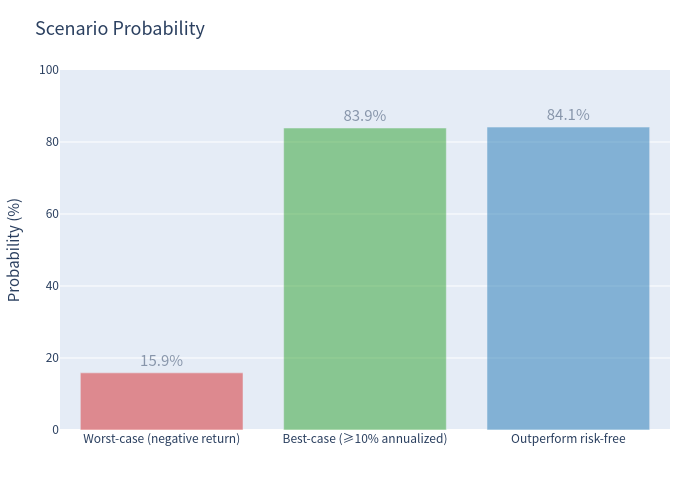
| Probability of a negative total return | 15.87% |
| 99% confidence VaR (1-year, annualized) | −32.87% |
| Worst simulated outcome (total return) | −62.84% |
| Probability called early | 48.45% |
What This Product Is & How It Works
This is a yield-enhancement, capital-protection-conditional note linked to the worst of three Swiss industrial stocks (dormakaba, Georg Fischer, OC Oerlikon).
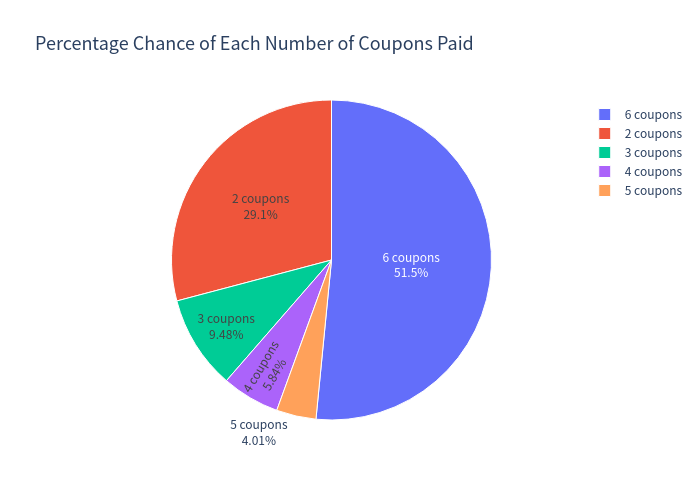
- You are paid a high fixed coupon of 11.30% p.a. (~2.825% per quarter, 6 quarterly payments) regardless of how the stocks perform, as long as you hold the note.
- Downside protection is conditional. If no stock ever trades at or below 55% of its starting level (monitored continuously over the life), you get your full par (100%) back at maturity. If any stock touches its 55% barrier, protection is lost and your principal is exposed to the worst-performing stock at maturity.
- Upside is capped. You never receive more than par plus the coupons — you do not participate in any rise in the shares.
- The note is callable by the issuer, quarterly from month 6. If called, you receive par + that quarter's coupon and the note ends. In practice the issuer tends to call when the stocks are flat-to-up, which caps your upside in strong markets (48% of simulations were called early).
In short: you are selling downside protection on the worst of three stocks to collect an attractive coupon, while giving up equity upside.
Key Statistics
Structured Product vs. Equal-Weight Benchmark
Simulated, over matched holding periods.
| Metric | Structured Product | Benchmark (Equal-Weight Basket, total return) |
|---|---|---|
| Expected annualized return | 6.09% | 15.42% |
| Expected annualized volatility | 12.08% | 24.79% |
| Probability of loss (negative return) | 15.87% | 29.60% |
| 99% VaR (1-year, annualized) | −32.87% | −31.11% |
Underlyings (20-Year History)
| Underlying | Last price (CHF) | 20-yr annualized price return | 20-yr annualized volatility | Dividend yield |
|---|---|---|---|---|
| dormakaba | 66.20 | 5.90% | 26.65% | 1.44% |
| Georg Fischer | 58.30 | 5.05% | 32.50% | ≈2.20% (est.) |
| OC Oerlikon | 5.84 | −4.50% | 52.35% | 3.50% |
| Equal-weight basket | — | — | — | ≈2.38% |
- Risk-free rate (CHF): ≈ 0.00% (1-year average short-term CHF rate, −0.05%).
- Barrier event (worst-of) frequency: 17.35% of simulations. Loss-producing scenarios (barrier hit and worst-of finishing at/below strike): 16.12%.
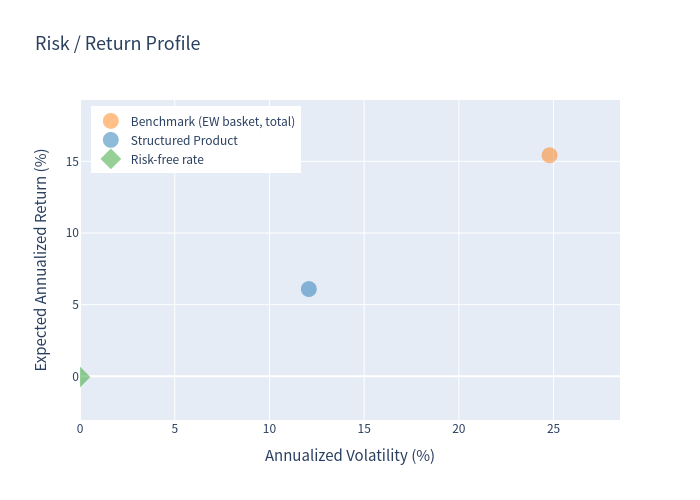
- The product roughly halves volatility (12.08% vs 24.79%) and lowers loss probability (15.87% vs 29.60%) versus holding the equal-weight basket — at the cost of giving up the basket's upside.
Charts
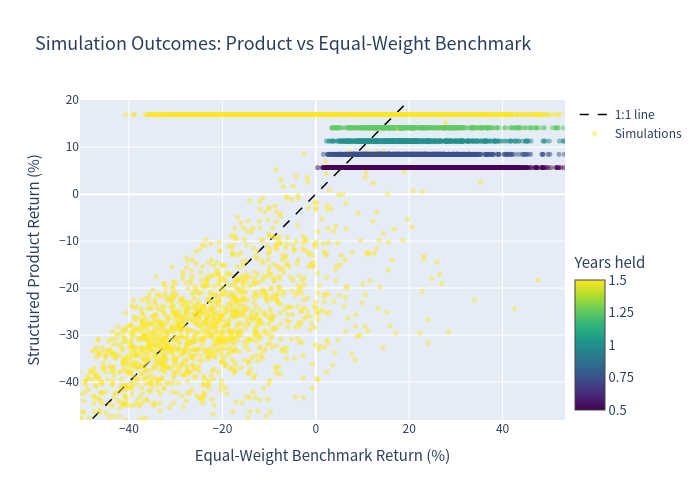
Simulation outcomes — product vs. equal-weight benchmark
Colour = holding period.
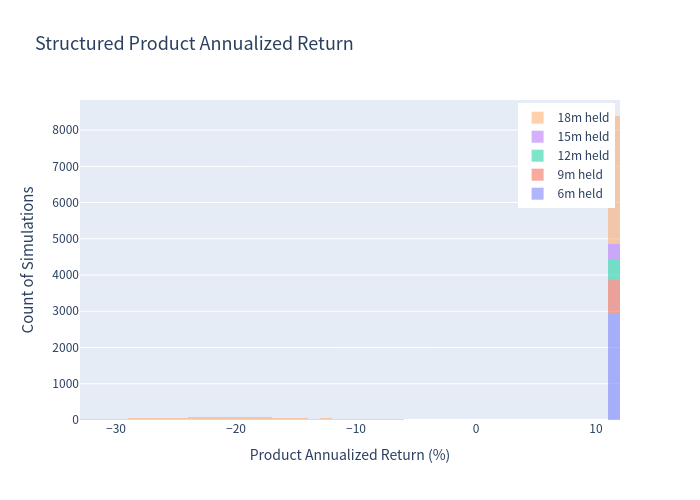
Structured product annualized return distribution
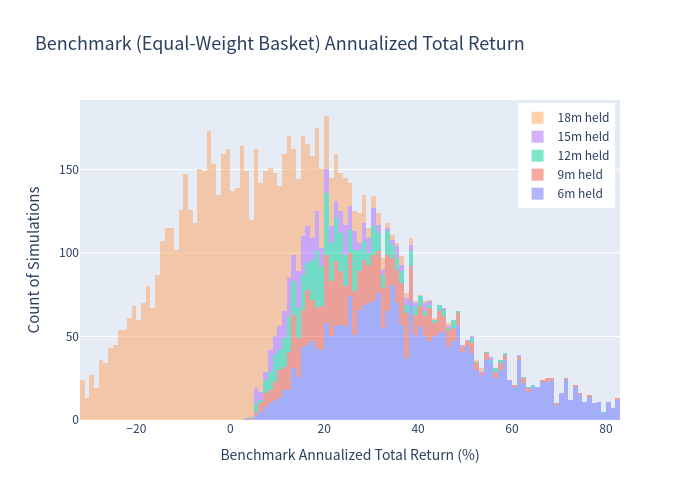
Benchmark annualized total return distribution
Risk / return profile
Expected return vs. volatility.
Annualized return distribution — product vs. benchmark
Scenario probabilities
Holding-period distribution
Callable — the note is not always held to maturity.
Number of coupons paid
A Note on Annualized Figures
Interpreting the 6.09% annualized figure
Because the note is callable, ~29% of simulations end at month 6 and ~38% end within 12 months. For these short holding periods the annualized figure is a linear scaling of the holding-period return, which can appear elevated in strong (called-early) markets. The cleaner "money made" measure is the expected total return of 5.07% over an average 1.10-year holding period. Interpret the annualized 6.09% together with this total return and holding period.
Investment Commentary
Simulation-based analysis; figures are estimates from a Monte-Carlo study, not guarantees. Not investment advice.
Strengths
Considerations / Risks