
tokenengine.ai
Structured Product Evaluator
info@tokenengine.ai
12.20% p.a. Callable Multi Barrier Reverse Convertible — Evaluation Report
Underlyings: HUBER+SUHNER, Kuehne + Nagel, Stadler Rail (worst-of, three Swiss equities) · Currency: CHF · Issuer: Leonteq Securities AG (Guarantor: Aargauische Kantonalbank)
1. Headline Simulation Results
Based on 10,000 simulated paths (18-month maximum term), the product is expected to deliver a positive but moderate return that is lower than the underlying basket in expectation, with materially lower volatility and a concentrated downside tail when the barrier is breached.
| Metric | Structured Product |
|---|---|
| Expected annualized return | 6.20% |
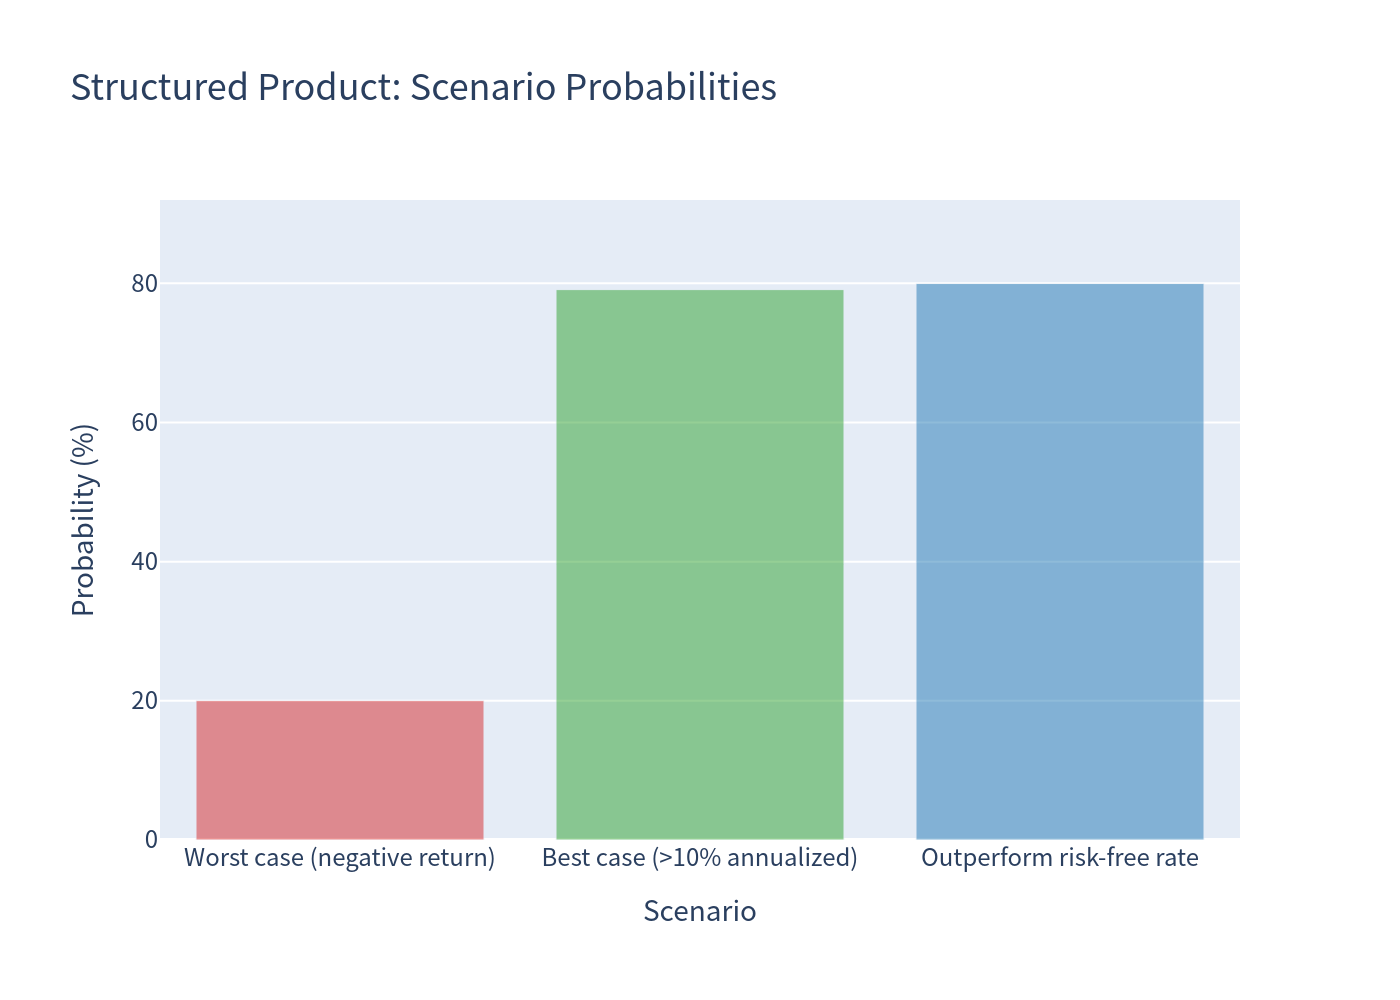
| Probability of negative return | 20.03% |
| 99% confidence VaR (1 year) | -29.18% |
| Expected total return over the realized holding period | 6.13% |
| Expected holding period | 14.42 months (1.20 years) |
| Coupon rate | 12.20% p.a. (12.20 index points over 1 year) |
2. Product Overview (how it works)
- The product pays a fixed 12.20% p.a. coupon (CHF 30.50 per CHF 1,000 per quarter) regardless of how the underlyings perform while it is alive.
- Capital protection is conditional. If the barrier is never breached, the investor gets 100% of nominal back at maturity. If, however, any one of the three stocks ever trades at or below 59% of its starting level (observed continuously over the whole life), the barrier is breached and, if the worst-performing stock also ends below its strike (100%), the investor loses the par redemption and receives the worst-performing stock (or its cash value), which can be well below 100%. If the worst-of ends at or above its strike, par is still repaid.
- Upside is fully capped at par — no matter how far the stocks rally, the investor receives only the coupon plus 100%.
- The product is callable by the issuer at four quarterly dates from month 6. If called, the investor receives par plus the coupon for that date and the product ends.
In short: a high-coupon bond whose principal is at risk only if the worst-of the three stocks breaches an already deep 59% barrier; the issuer holds a call to refinance when the stocks perform well.
3. Key Statistics
| Metric (annualized) | Structured Product | Underlying (equal-weight basket) | Underlying incl. dividends |
|---|---|---|---|
| Expected annualized return | 6.20% | 10.29% | 12.11% |
| Expected annualized volatility | 11.91% | 20.24% | 20.24% |
| Probability of loss | 20.03% | 34.26% | 34.26% |
| 99% VaR (1 year) | -29.18% | -24.29% | -24.29% |
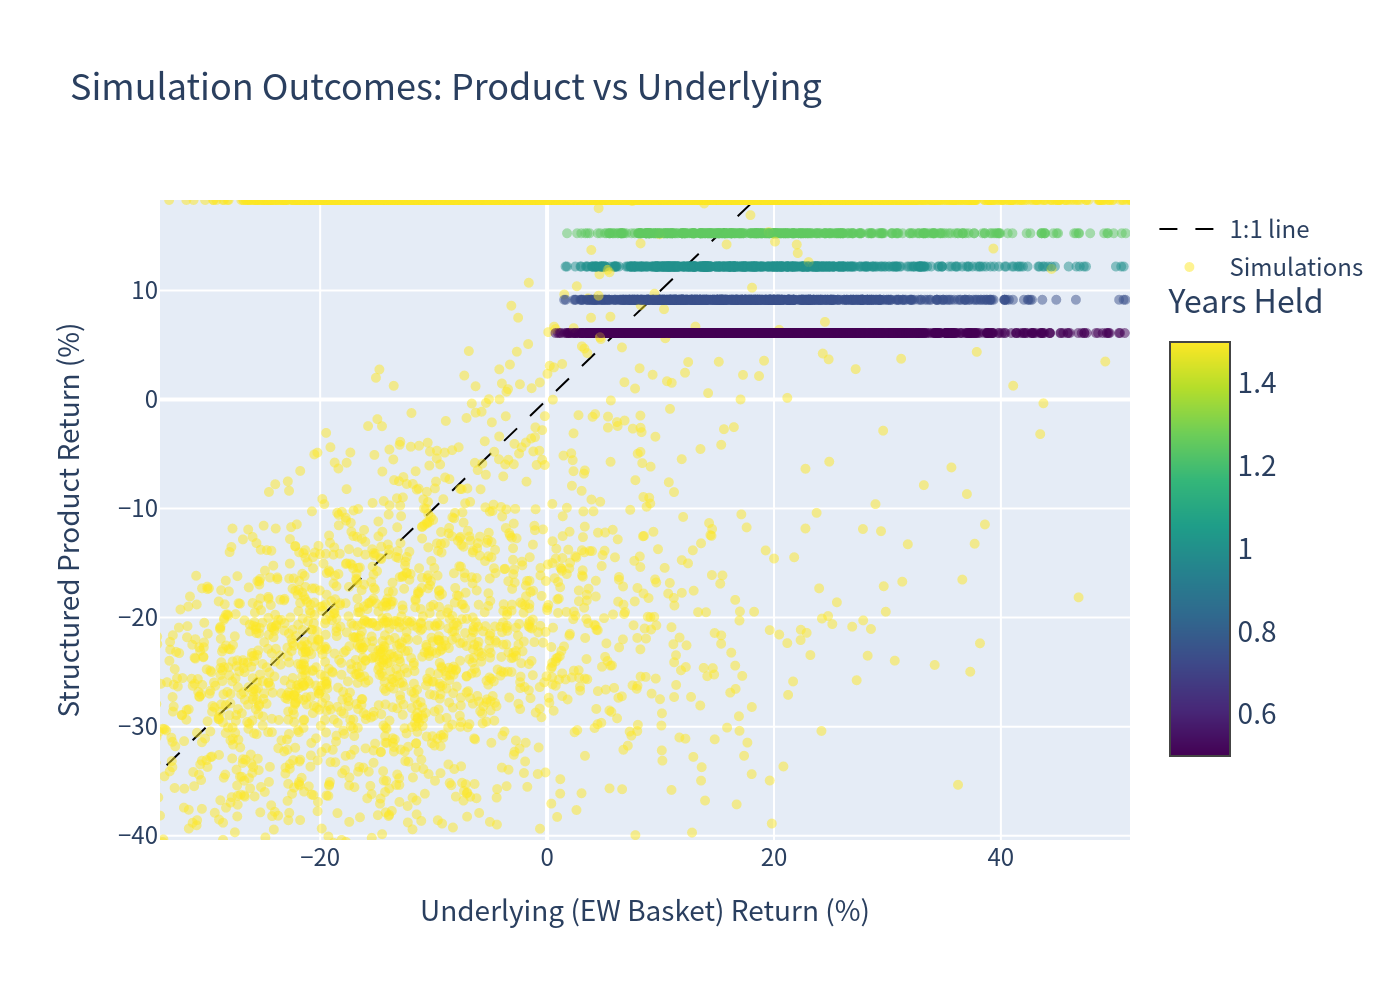
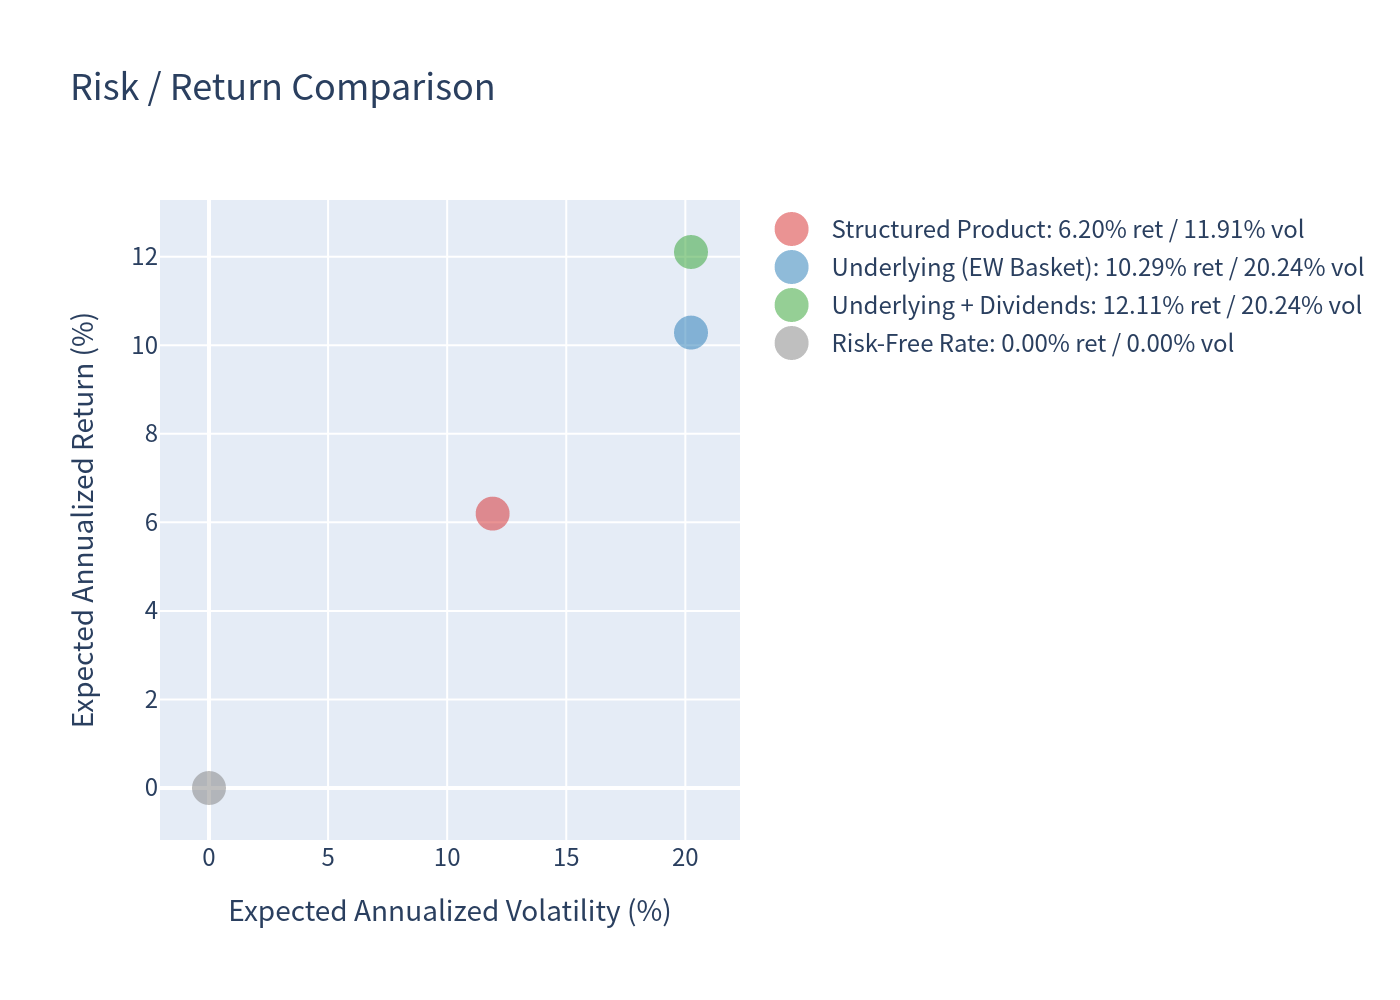
- The product roughly halves the volatility of the underlying basket (11.91% vs 20.24%).
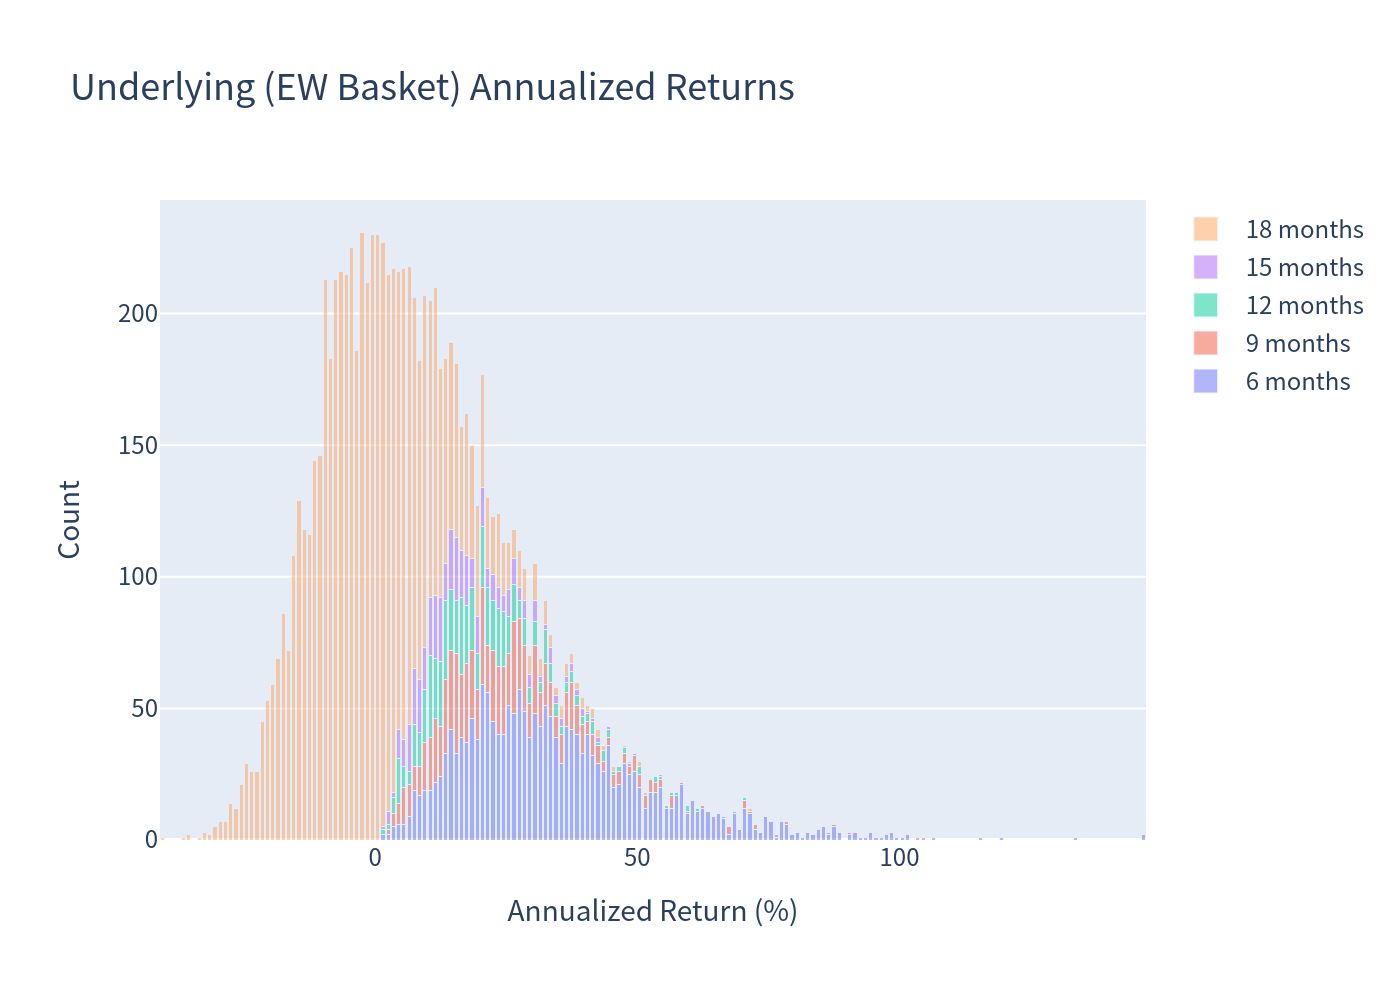
- Over the realized holding period, the mean total return is comparable (product 6.13% vs basket 6.53%, or 8.72% including dividends); the gap versus the annualized figures is a linear-annualization effect for the ~28% of paths that are called inside 12 months and for the underlying's higher convexity — those figures should be read together with the holding period.
- The product's 1-year 99% VaR (-29.18%) is worse than the basket's (-24.29%): because the payoff is concentrated in the worst of three names, the barrier-driven tail is deeper than the diversified basket's tail.
4. Return Distributions
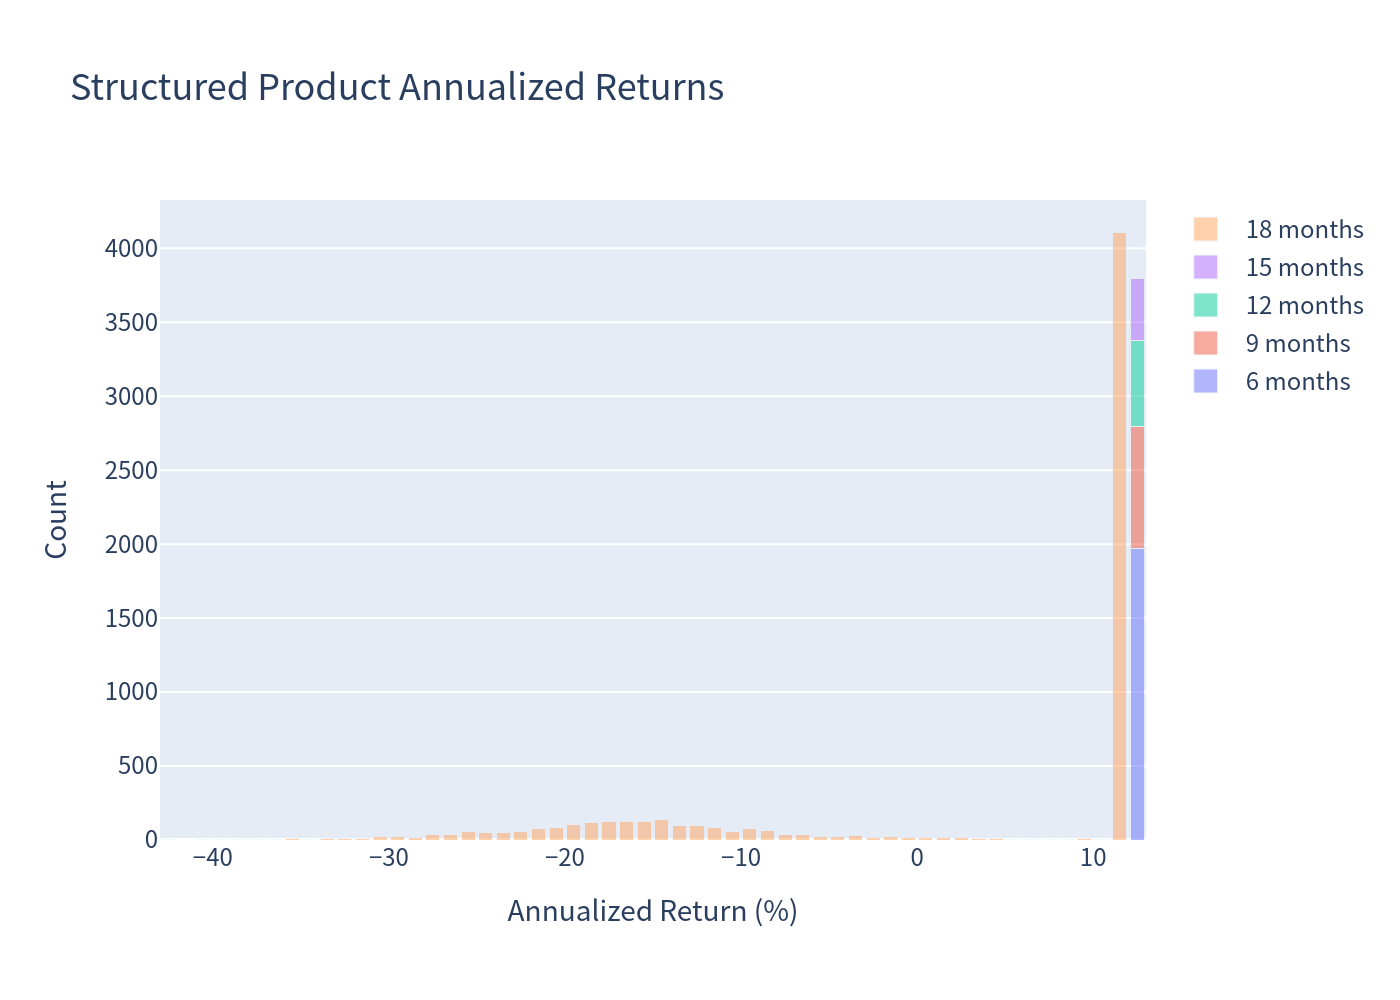
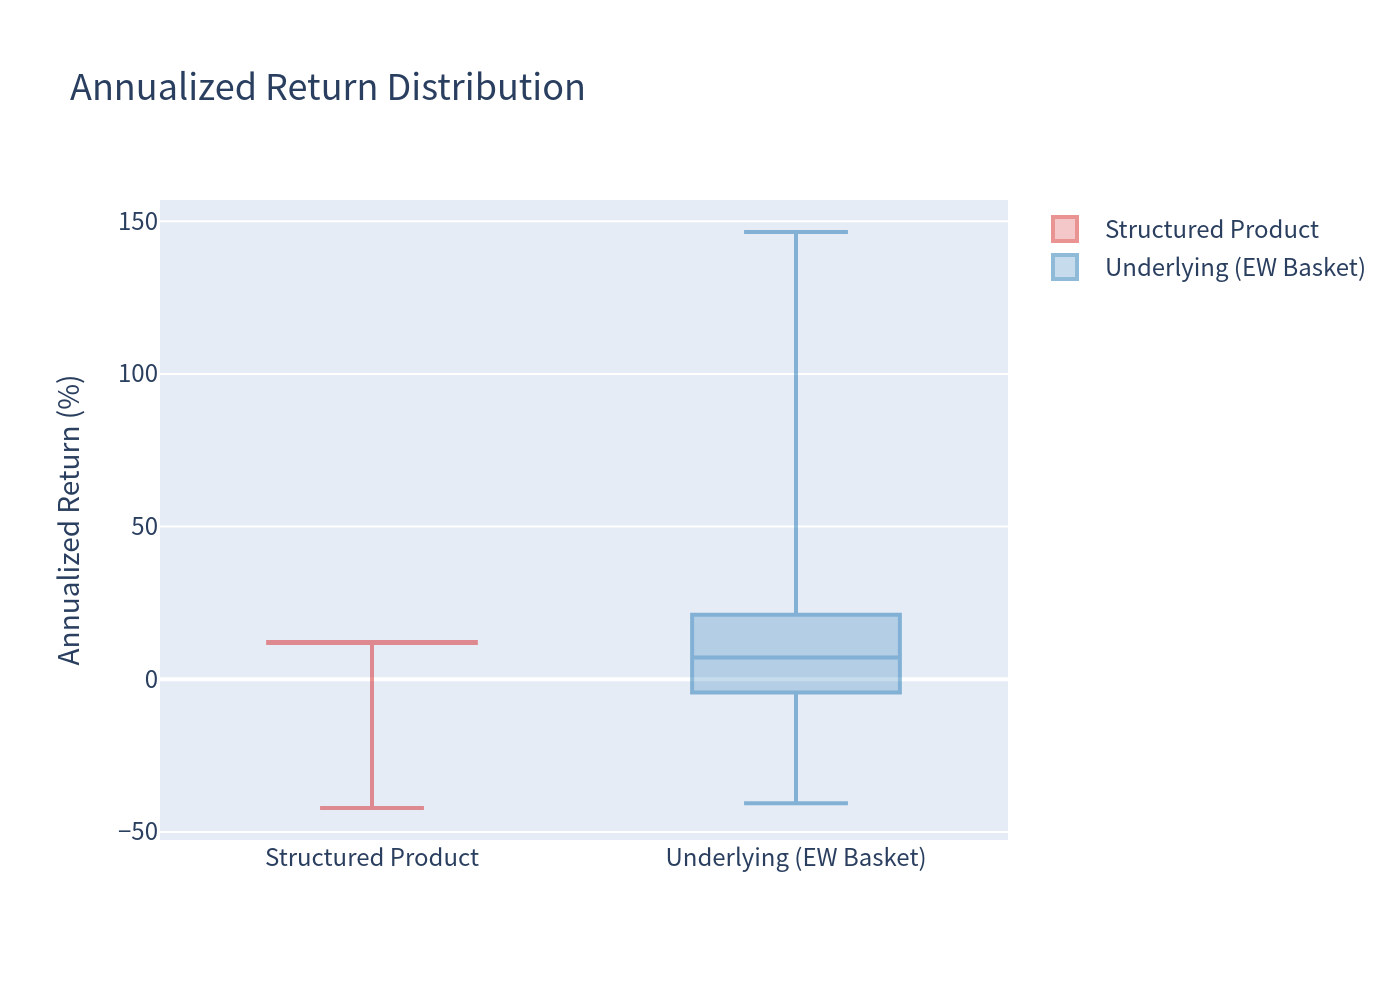
The structured product's outcome set is bounded on the upside: across the simulation the worst realized total return was about -56% (a deep barrier breach on the worst-of) and the best was a cap of +18.30% (all coupons, no capital loss). (The theoretical floor is far lower — approaching -81.70% if the worst-of fell to zero, i.e. 0 principal + 18.30 coupons; the -56% figure is the simulated sample minimum, not a contractual floor.) The underlying basket, by contrast, has a wide, roughly symmetric distribution.
5. Risk / Return and Distribution Charts
Holding-period / coupon distributions
(the product is not always held to maturity)
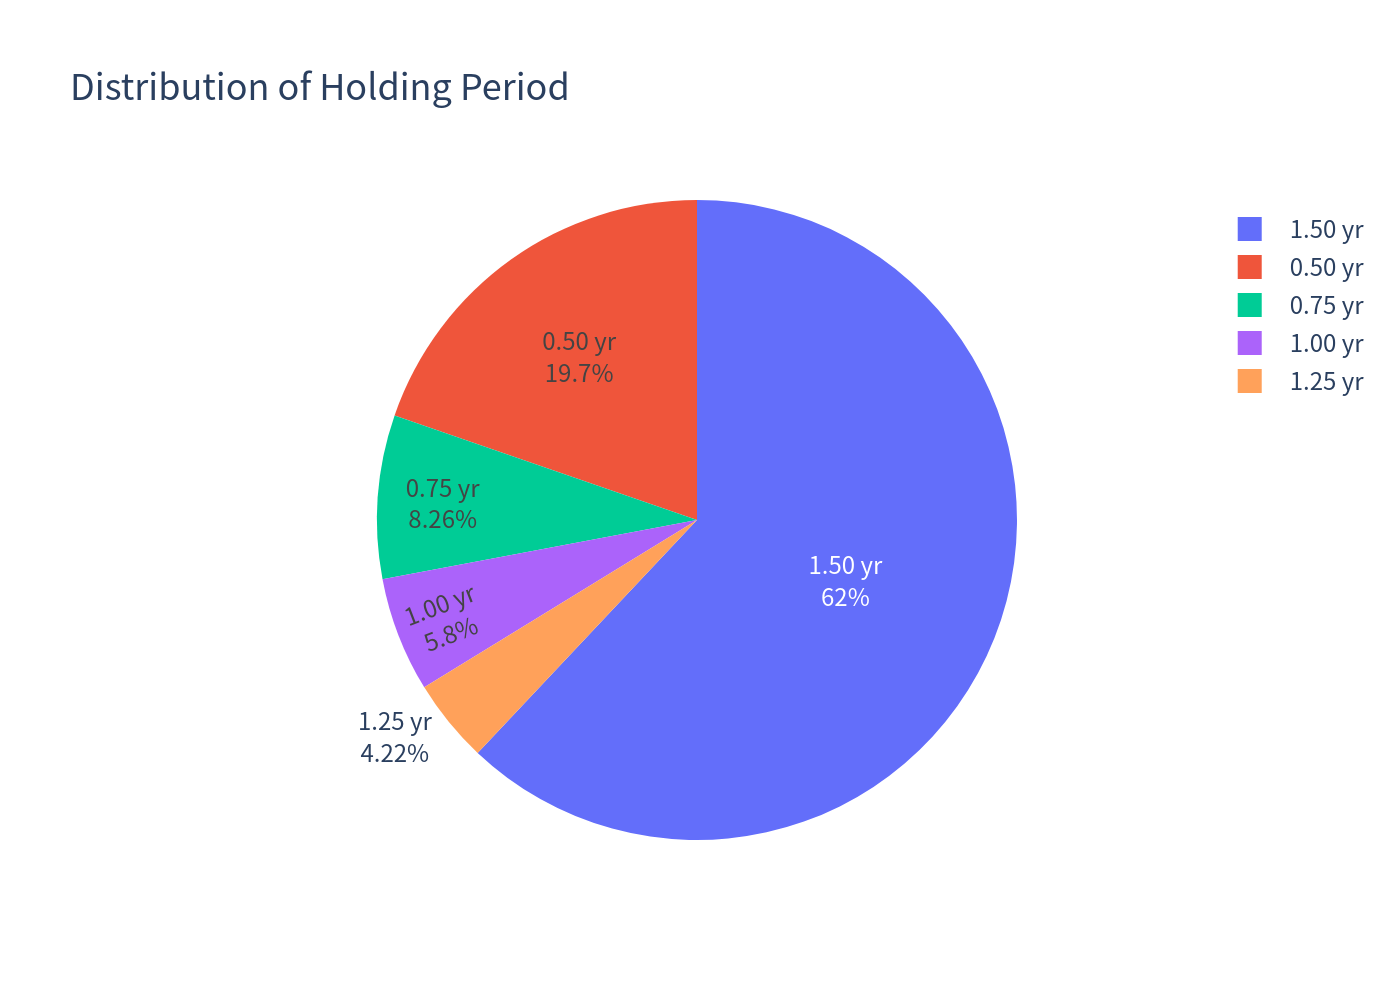
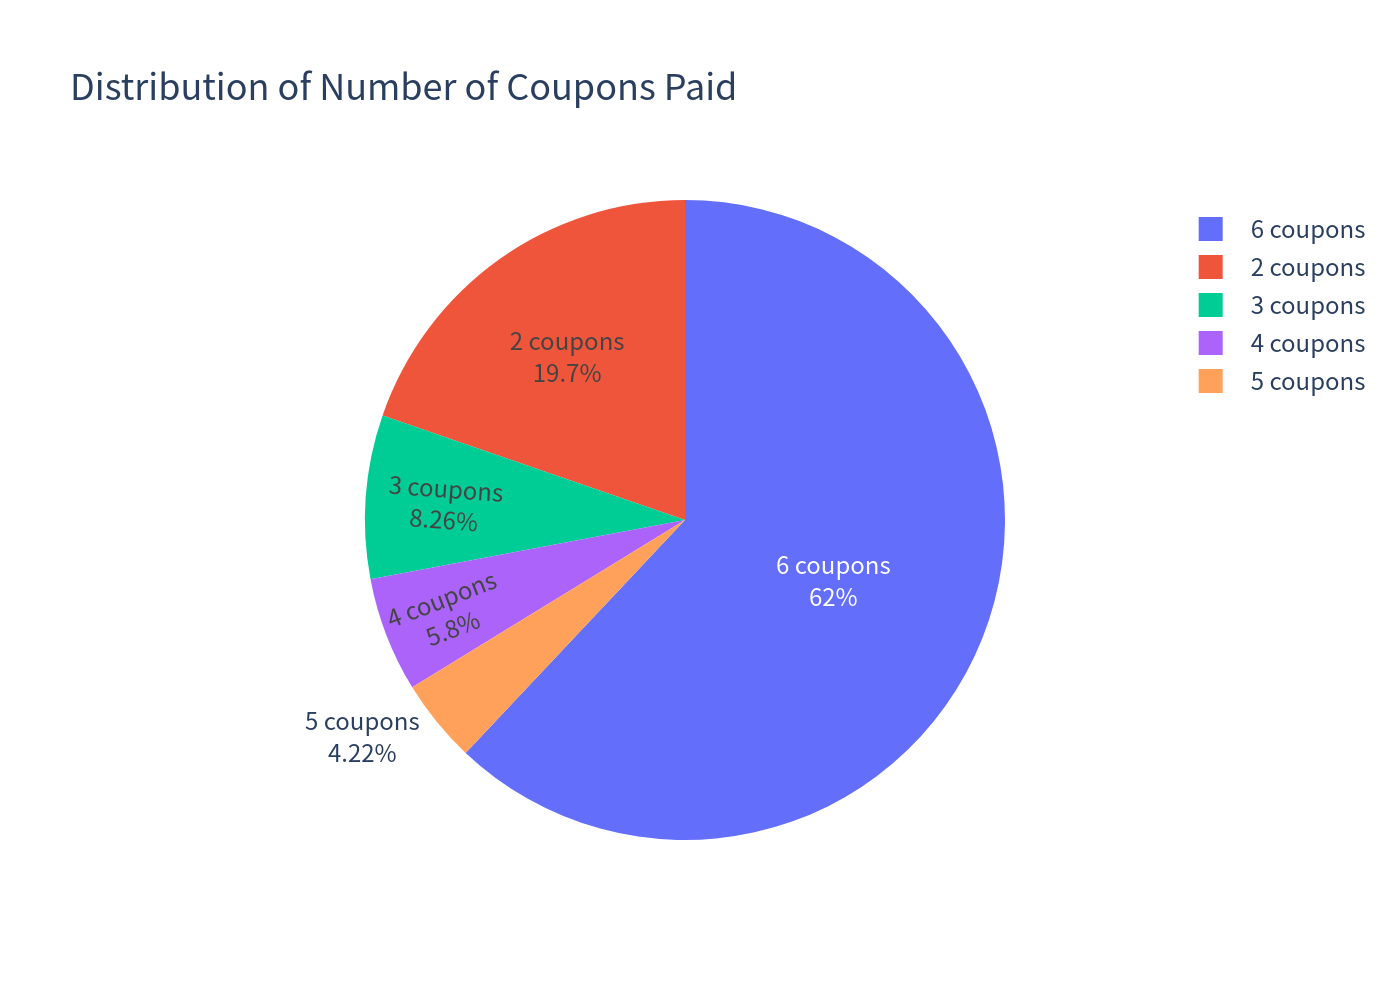
The issuer's call is the reason the holding period is variable: 62.02% of paths run the full 18 months, 19.70% are called at month 6, and the remainder at months 9 / 12 / 15 (8.26% / 5.80% / 4.22%). Correspondingly, the investor collects 2 to 6 coupons.
6. Investment Commentary
Potential positives
- High headline coupon (12.20% p.a.) paid unconditionally while the product is alive — attractive versus a CHF risk-free rate near 0%.
- Low realized volatility (11.91%): the coupon plus the 59% barrier keep the return distribution tight in the large majority of scenarios.
- Deep barrier (59%) with continuous monitoring — only the single weakest of the three stocks needs to fall 41% to breach the barrier, and about 78% of paths never breach it.
- Positive expected return in the base case (6.20% annualized / ~6% total).
Points to weigh
- Expected return below the underlying basket (6.20% vs 10.29% annualized, or vs 12.11% including dividends): the investor gives up upside for the coupon.
- Concentrated tail risk: the 1-year 99% VaR (-29.18%) is worse than the basket's; if the barrier is breached and the worst-of also ends below its strike, the investor is left holding the weakest stock and can post large losses (worst simulated outcome was about -56%; the theoretical floor is near -82%).
- Upside fully capped at +18.30% total, so strong equity rallies are forgone.
- Issuer call risk: the product tends to be called exactly when the stocks do well, truncating the coupon stream in the best scenarios (only 2 coupons in ~20% of paths).
- Credit / issuer risk of the issuer and guarantor, plus distribution fees up to 0.34% p.a.